. 2017 May 2;114(18):E3612-E3621.
doi: 10.1073/pnas.1619819114. Epub 2017 Apr 17.

Using microsecond single-molecule FRET to determine the assembly pathways of T4 ssDNA binding protein onto model DNA replication forks

Affiliations

Using microsecond single-molecule FRET to determine the assembly pathways of T4 ssDNA binding protein onto model DNA replication forks

Carey Phelps et al. Proc Natl Acad Sci U S A. .

Abstract

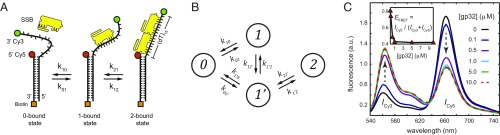
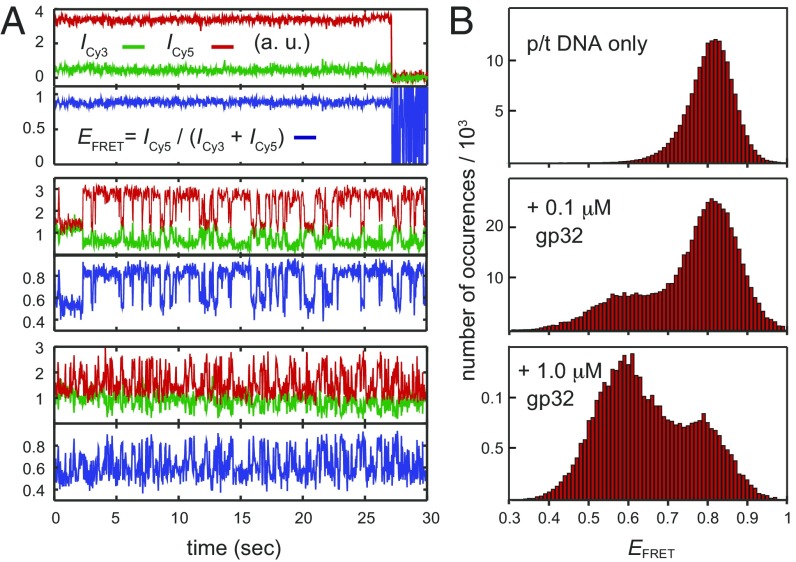
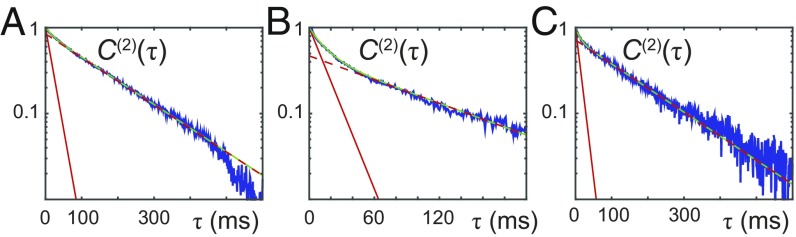
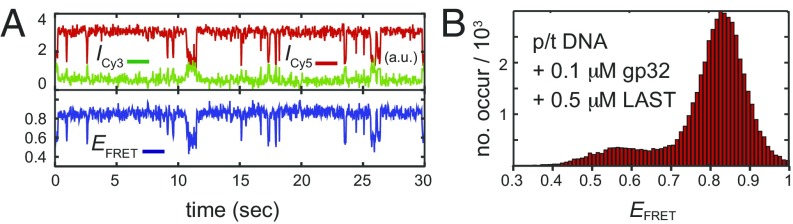
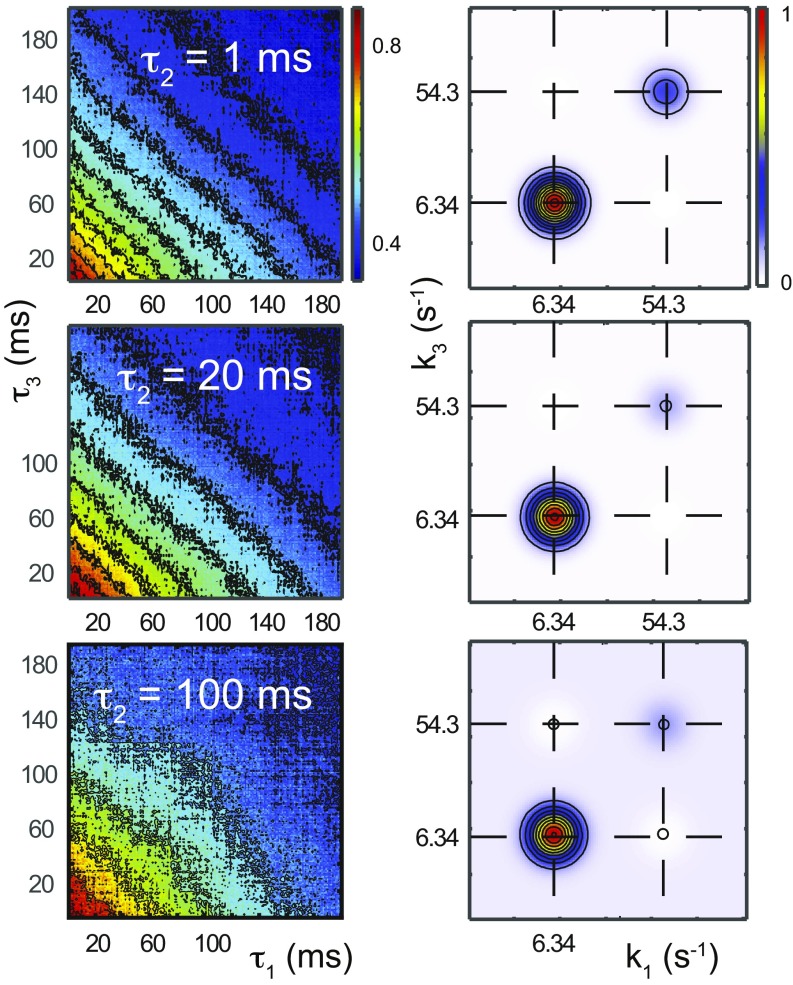
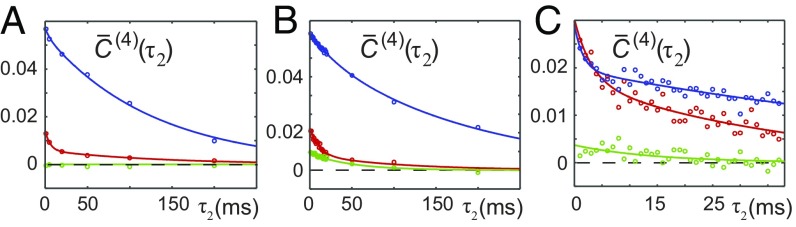
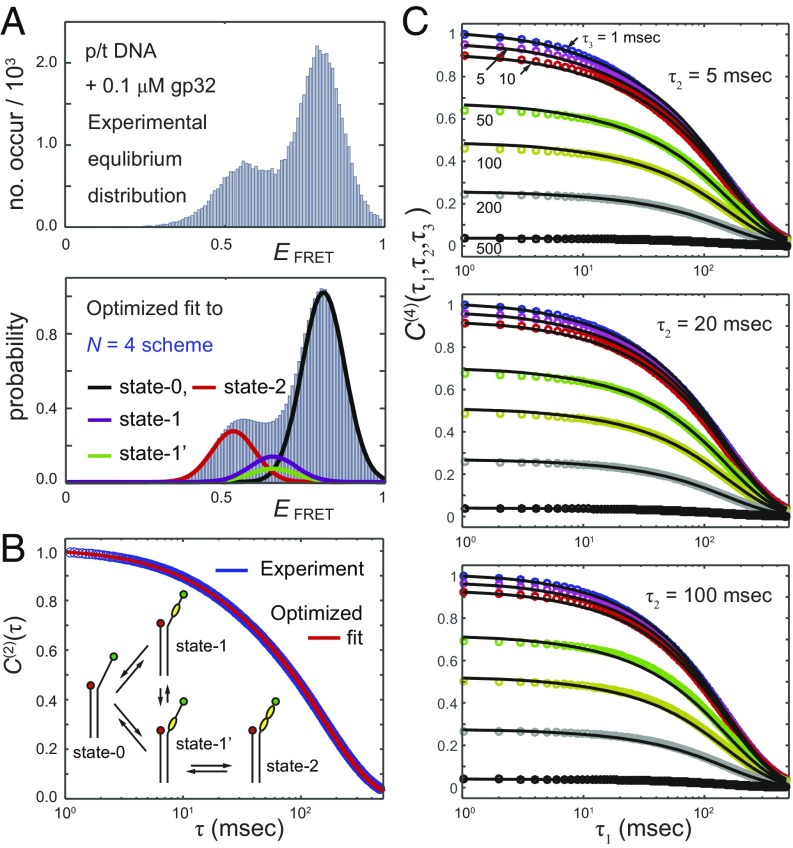
DNA replication is a core biological process that occurs in prokaryotic cells at high speeds (∼1 nucleotide residue added per millisecond) and with high fidelity (fewer than one misincorporation event per 107 nucleotide additions). The ssDNA binding protein [gene product 32 (gp32)] of the T4 bacteriophage is a central integrating component of the replication complex that must continuously bind to and unbind from transiently exposed template strands during DNA synthesis. We here report microsecond single-molecule FRET (smFRET) measurements on Cy3/Cy5-labeled primer-template (p/t) DNA constructs in the presence of gp32. These measurements probe the distance between Cy3/Cy5 fluorophores that label the ends of a short (15-nt) segment of ssDNA attached to a model p/t DNA construct and permit us to track the stochastic interconversion between various protein bound and unbound states. The length of the 15-nt ssDNA lattice is sufficient to accommodate up to two cooperatively bound gp32 proteins in either of two positions. We apply a unique multipoint time correlation function analysis to the microsecond-resolved smFRET data obtained to determine and compare the kinetics of various possible reaction pathways for the assembly of cooperatively bound gp32 protein onto ssDNA sequences located at the replication fork. The results of our analysis reveal the presence and translocation mechanisms of short-lived intermediate bound states that are likely to play a critical role in the assembly mechanisms of ssDNA binding proteins at replication forks and other ss duplex junctions.

Keywords: microsecond single-molecule FRET; multidimensional time correlation functions; ssDNA binding protein.


Conflict of interest statement

The authors declare no conflict of interest.

Figures

Fig. 1.
Fig. 1.
(A) Schematic of the unbound and bound states of binding for the ssDNA-(gp32)2 system. The p(dT)15 “tail” of a p/t DNA construct can bind up to two ssb proteins (gp32; yellow). FRET donor Cy3 and acceptor Cy5 chromophores (green and red circles, respectively) label the ends of the ssDNA region. Modified from ref. . (B) Reaction scheme indicating nonproductive (1-bound) and productive (1′-bound) intermediate states. (C) Bulk fluorescence measurements at 100 nM p/t DNA concentrations exhibited changes in the FRET efficiency on titration with gp32. The Inset shows the values of EFRET determined from peak Cy3/Cy5 fluorescence intensities.
Fig. 2.
Fig. 2.
(A) Representative single-molecule donor Cy3 (green), acceptor Cy5 (red), and smFRET trajectories (blue) taken from the 3′-Cy3/Cy5-p(dT)15-p/t DNA construct in the presence of 0, 0.1, and 1.0 μM gp32. The smFRET efficiency is calculated according to EFRET=ICy5/(ICy3+ICy5). (B) Histograms of the EFRET efficiency were obtained from several hundred smFRET trajectories in the presence of 0, 0.1, and 1.0 μM gp32.
Fig. 3.
Fig. 3.
Normalized second-order TCFs of microsecond-resolved smFRET trajectories of the 3′-Cy3/Cy5-p(dT)15-p/t DNA construct in the presence of (A) 0.1 μM gp32, (B) 1.0 μM gp32, or (C) 0.1 μM gp32 + 1.0 μM LAST peptide. Green curves are linear regression best fits to the data. Solid and dashed red lines indicate the fast and slow decay components, respectively. The above decays were constructed from hundreds of thousands of data points. The results of the fitting analysis are reported in SI Appendix, Table S2.
Fig. 4.
Fig. 4.
(A) Representative single-molecule donor Cy3 (green), acceptor Cy5 (red), and smFRET trajectories (blue) taken from the 3′-Cy3/Cy5-p(dT)15-p/t DNA construct in the presence of 0.1 μM gp32 + 0.5 μM LAST. The smFRET efficiency is calculated according to EFRET=ICy5/(ICy3+ICy5). (B) Histogram of the EFRET efficiency obtained from several hundred smFRET trajectories in the presence of 0.1 μM gp32 + 0.5 μM LAST.
Fig. 5.
Fig. 5.
(Left) Fourth-order TCFs and (Right) associated 2D rate spectra calculated from smFRET trajectories of the 3′-Cy3/Cy5-p(dT)15-p/t DNA construct in the presence of 0.1 μM gp32. The 2D rate spectra were calculated assuming a three-state (n = 3) scheme, and the characteristic rate constants were determined from the corresponding second-order TCFs (SI Appendix, Table S2). Each dataset was computed from hundreds of thousands of points.
Fig. 6.
Fig. 6.
Diagonal and off-diagonal amplitudes of the 2D rate spectra determined from smFRET trajectories of the 3′-Cy3/Cy5-p(dT)15-p/t DNA construct as a function of the interval τ2 and in the presence of (A) 0.1 μM gp32, (B) 0.1 μM gp32 + 1.0 μM LAST peptide, and (C) 1.0 μM gp32. Fast and slow diagonal amplitudes are shown in red and blue, respectively, and the cross-peak amplitude is shown in green. The corresponding eigenvalues obtained in each case are (A) λslow = 6.34 s−1 and λfast = 54.3 s−1; (B) λslow = 6.45 s−1 and λfast = 80.0 s−1; and (C) λslow = 10.6 s−1 and λfast = 71.9 s−1.
Fig. 7.
Fig. 7.
Optimized fits of the n = 4 scheme to experimental functions calculated from smFRET trajectories of the 3′-Cy3/Cy5-p(dT)15-p/t DNA construct in the presence of 0.1 μM gp32. (A, Upper) Experimental equilibrium distribution of states. (A, Lower) Optimized fits show the component populations of the 0-bound state (black curve), the 2-bound state (red curve), and the 1- and 1′-bound intermediates (purple and green curves, respectively). (B) The experimental second-order TCF (blue) is shown overlaid with the optimized fit (red). (C) Experimental fourth-order TCFs for various waiting times (circles) are shown compared with the corresponding optimized theoretical fits (solid black curves). The cumulative fitness of the optimized solutions for the n = 3 and 4 schemes was determined using SI Appendix, Eq. S9 and is reported in SI Appendix, Table S4.

Similar articles

Cited by

References

    1. Johnson A, O’Donnell M. Cellular DNA replicases: Components and dynamics at the replication fork. Annu Rev Biochem. 2005;74:283–315. - PubMed
    1. Mueser TC, Hinerman JM, Devos JM, Boyer RA, Williams KJ. Structural analysis of bacteriophage T4 DNA replication: A review in the Virology Journal series on bacteriophage T4 and its relatives. Virol J. 2010;7:359. - PMC - PubMed
    1. Nossal NG. The bacteriphage T4 DNA replication fork. In: Karam JD, Kreuzer KN, Hall DH, editors. Molecular Biology of Bacteriphage T4. American Society for Microbiology; Washington, DC: 1994. pp. 43–54.
    1. Nossal NG, Makhov AM, Chastain PD, 2nd, Jones CE, Griffith JD. Architecture of the bacteriophage T4 replication complex revealed with nanoscale biopointers. J Biol Chem. 2007;282:1098–1108. - PubMed
    1. Alberts BM. Prokaryotic DNA replication mechanisms. Philos Trans R Soc Lond B Biol Sci. 1987;317:395–420. - PubMed

Publication types

MeSH terms

LinkOut - more resources