. 2017 May 2;114(18):4661-4666.
doi: 10.1073/pnas.1701420114. Epub 2017 Apr 17.

IP3-mediated gating mechanism of the IP3 receptor revealed by mutagenesis and X-ray crystallography

Affiliations

IP3-mediated gating mechanism of the IP3 receptor revealed by mutagenesis and X-ray crystallography

Kozo Hamada et al. Proc Natl Acad Sci U S A. .

Abstract

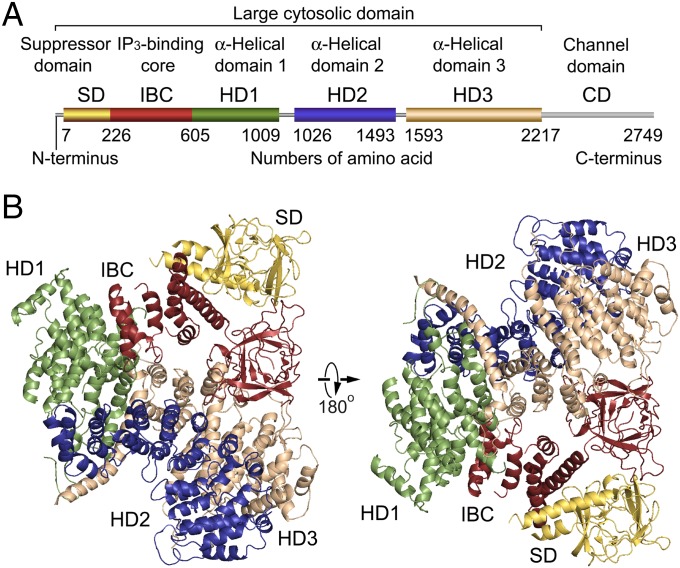
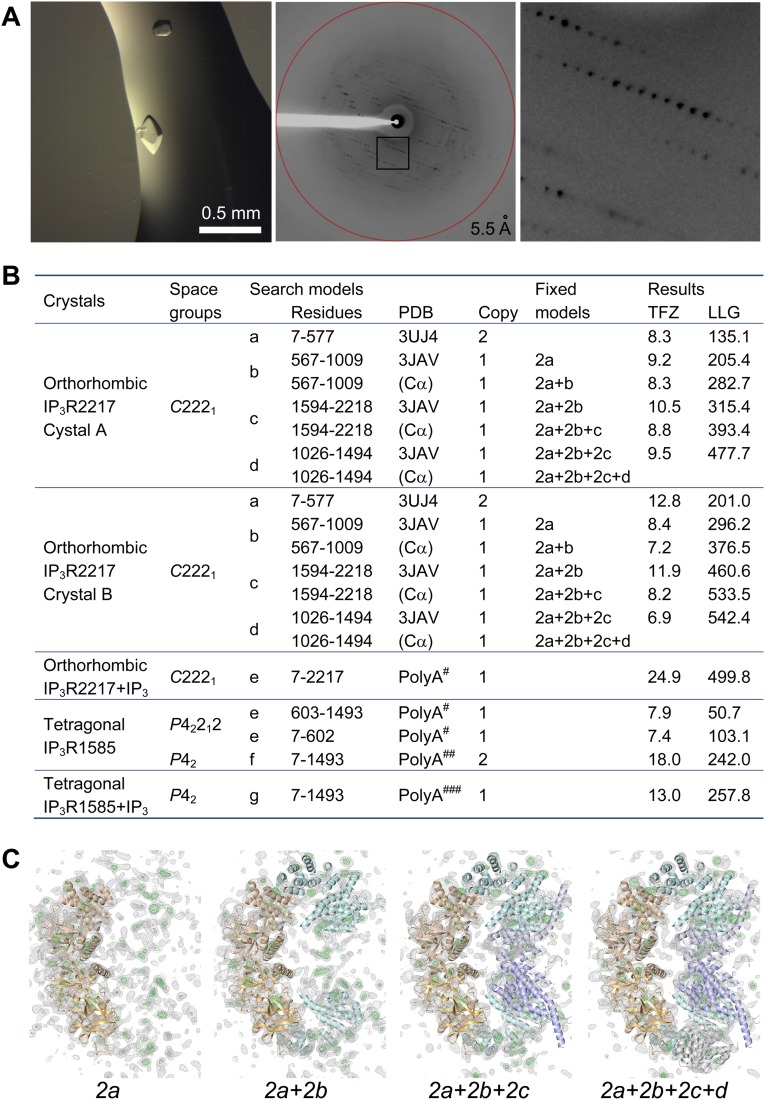
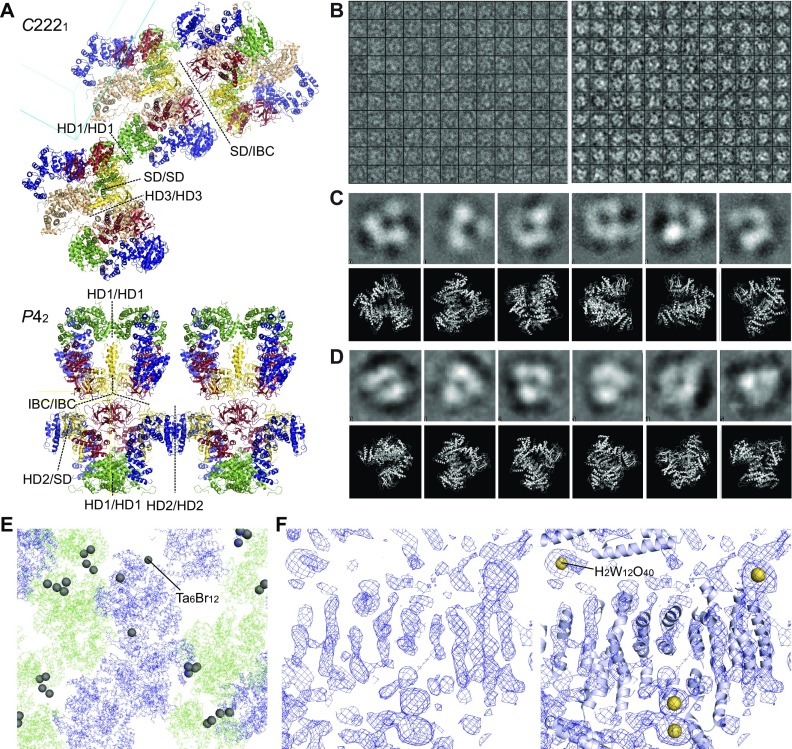
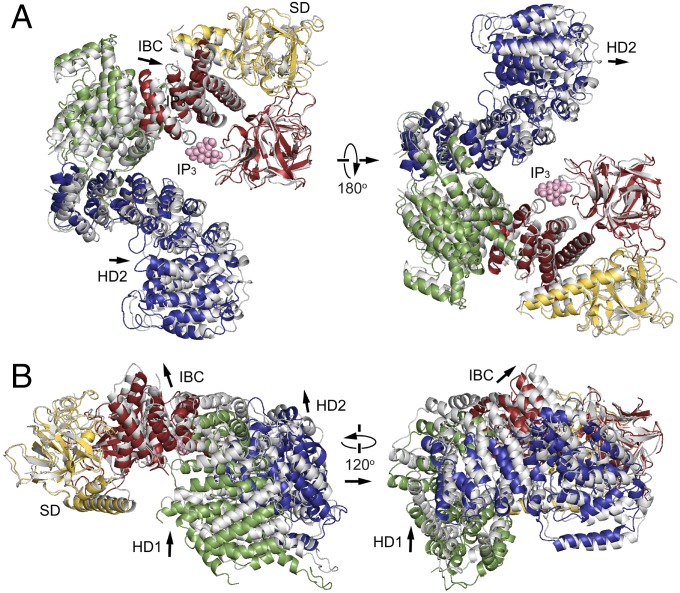
The inositol 1,4,5-trisphosphate (IP3) receptor (IP3R) is an IP3-gated ion channel that releases calcium ions (Ca2+) from the endoplasmic reticulum. The IP3-binding sites in the large cytosolic domain are distant from the Ca2+ conducting pore, and the allosteric mechanism of how IP3 opens the Ca2+ channel remains elusive. Here, we identify a long-range gating mechanism uncovered by channel mutagenesis and X-ray crystallography of the large cytosolic domain of mouse type 1 IP3R in the absence and presence of IP3 Analyses of two distinct space group crystals uncovered an IP3-dependent global translocation of the curvature α-helical domain interfacing with the cytosolic and channel domains. Mutagenesis of the IP3R channel revealed an essential role of a leaflet structure in the α-helical domain. These results suggest that the curvature α-helical domain relays IP3-controlled global conformational dynamics to the channel through the leaflet, conferring long-range allosteric coupling from IP3 binding to the Ca2+ channel.

Keywords: IP3 receptor; X-ray crystallography; allosteric regulation; calcium channel; gating mechanism.


Conflict of interest statement

The authors declare no conflict of interest.

Figures

Fig. 1.
Fig. 1.
Global architecture of the IP3R large cytosolic domain. (A) Domain organization. Each domain is depicted in a different color: yellow, suppressor domain (SD; 7–225 amino acid residues); red, IP3-binding core (IBC; 226–604 residues); green, α-helical domain 1 (HD1; 605–1,009 residues); blue, α-helical domain 2 (HD2; 1,026–1,493 residues); tan, α-helical domain 3 (HD3; residues 1,593–2,217); and gray, channel domain (CD; 2,218–2,749 residues). (B) Overall crystal structure of IP3R2217 viewed from two sides. The overall arrangement of domains is consistent with four crystal structures solved using C2221 and P42 crystals (5.8–7.4 Å datasets). The left corresponds to a top view from the cytosolic side with respect to the membrane in the tetrameric IP3R (Fig. S4F).
Fig. S1.
Fig. S1.
Crystallography of the large cytosolic domain of IP3R. (A) Bipyramidal crystals of IP3R1585 (Left) and an X-ray diffraction image measured from the crystal (Center). (Right) Magnification of the boxed area. (B) Structure determination statistics of IP3R2217 and IP3R1585 by molecular replacement. The polyalanine (PolyA) models refined in the C2221#, P42212##, and P42### crystal lattices were used as search models. (C) Electron density maps in gray (2Fo-Fc, contoured at 1.5 σ) or in green (Fo-Fc, contoured at 3.0 σ), calculated from molecular replacement of the C2221 dataset using each search model presented in the upper table. Note that the residual electron density outside the search model was visible in 2Fo-Fc and Fo-Fc maps. LLG, log-likelihood gain; TFZ, translation function z-score.
Fig. S2.
Fig. S2.
Crystallographic analyses and validations of IP3R2217 and IP3R1585. (A) Ribbon representations of IP3R2217 in the C2221 crystal lattice (Upper) and IP3R1585 in the P42 crystal lattice (Lower). The contacts between adjacent molecules are shown by dotted lines. Cyan and yellow lines indicate axes of unit cells. (B) Boxes (180 Å × 180 Å) showing the IP3R2217 particles picked from a cryo-EM micrograph obtained on a JEM-2100F microscope (Left) and micrograph of negative-stained IP3R obtained on an FEI Tecnai 12 electron microscope (Right). The mean particle diameter of negatively stained particles was 140 ± 13 Å (n = 19). (C and D) Characteristic class averages of cryo-EM images (C) and negative-stained particles (D) are shown in the upper rows, and the lower rows show obtained crystal structures, manually fitted to each class average. (E) Experimental phasing using heavy atom clusters. Heavy atom sites (Ta6Br12) in the C2221 crystal determined by SAD. (F) A density modified map solved by MR-SAD experimental phasing with H2W12O40 tungsten clusters (Left), and our model superimposed with the map as a reference (Right).
Fig. 2.
Fig. 2.
IP3-mediated rotation of HD1 about the IP3-binding site. (A) Comparison of IP3R1585 structures in the absence of IP3 (colored) with one in the presence of IP3 (gray). Two structures were superposed by fitting of the N-terminal β-domain (7–-430 residues). (B) Side views of these two crystal structures. IP3 molecules are in pink, and arrows indicate the direction of domain relocations by IP3.
Fig. 3.
Fig. 3.
Long-range conformational changes in the large cytosolic domain by IP3. (A) Comparison of IP3R2217 structures in the absence of IP3 (colored) and in the presence of IP3 (gray). Two structures were superposed by fitting of the N-terminal β-domain (7-430 residues). (B) Side views of the two crystal structures. IP3 molecules are in pink, and arrows indicate the direction of domain relocations by IP3. (C) The helical arrangements (helices 1–6) at transitional regions from IBC to HD1 of IP3R2217 (Left) and IP3R1585 (Right) were viewed from an IP3-binding site.
Fig. S3.
Fig. S3.
Representative electron density maps and models as revealed by X-ray crystallography using 5.8–7.4 Å datasets. (A) The phased 5.8 Å diffraction dataset showing a 2Fo-Fc map contoured at 1.5 σ fitted with amino acid side chains in four helices of SD and IBC domains. (B) The bound IP3 molecules and hydrogen bonds from surrounding amino acid residues in the IBC of the 6.2 Å model (chain B) and the 7.4 Å model (chain A). The real-space correlation coefficients (RSCCs) of IP3 in the chain A and B calculated from the 6.2 Å dataset were 0.72 and 0.87, respectively, and the RSCC sof IP3 in the chain A and B calculated from the 7.4 Å dataset were 0.76 and 0.71, respectively. The 2Fo-Fc map is contoured at 1.0 σ. (C) Ribbon models of IP3R2217determined with the 7.3 Å dataset superimposed on the corresponding 2Fo-Fc map (gray) contoured at 1.5 σ. (D) All eight ribbon models in both chain A and chain B refined with 5.8, 6.2, 7.3, and 7.4 Å datasets (IBC, SD, HD1, and HD2) and all HD3 models in the chain A and B superimposed. The color coding of domains is similar to that in Fig. 1.
Fig. S4.
Fig. S4.
Comparison of domain arrangements in three models determined by X-ray crystallography and the cryo-EM analysis. (A) Arrangement of four domains in our models refined by P42 (5.8 Å) and C2221 (7.3 Å) datasets, and a cryo-EM model determined by 4.7 Å (PDB ID code 3JAV). Polyalanine or side chain-placed models are depicted in ribbon models, whereas the Cα modeled region in the cryo-EM model is presented in a cartoon loop model. (B) The electron density maps and models around a domain interface between HD1 and HD2 in P42 and C2221 models and the cryo-EM model. (C) The helices and corresponding maps in a continuous region between IBC and HD1 in P42 and C2221 models, and the cryo-EM model. The electron density map phased by X-ray models is presented by a 2Fo-Fc map contoured by 1.5 σ, and a cryo-EM map obtained by single-particle analysis (EMD-6369) is contoured by 5.0 σ. (D) Comparison of the helical regions in IBC and HD2 (Left) and four domains (Right) in X-ray models and the cryo-EM model. The P42 chain A (red), C2221 chain A (gray), and cryo-EM chain A (blue) models fitted by superimposing the HD1 domain. (Left) Angles of IBC rotation measured between two F445 residues in helix 6 of IBC about Y633. (Right) Angles of IBC rotation measured between two Y167 residues about Y633, and the rotation of HD2 measured between the L1449 (L1450 in the cryo-EM model) residues about Q749. The angle between HD2 domains of P42 and C2221 models was 2.9° about Q749. (E) The X-ray model of the large curvature helical domains comprising HD1 and HD3, which is refined with the 7.3 Å dataset, superimposed on a cryo-EM model (3JAV) determined at 4.7 Å. (F) Docking of IP3R2217 crystal structures into the IP3R1 tetramer IP3R2217 molecules superposed on the top (Upper) and side (Lower) views of the rat IP3R1 tetramer model constructed by cryo-EM using the Coot program package. Critical residues (Y167 and E2100) are dotted, and subunit interfaces are indicated by dotted lines.
Fig. 4.
Fig. 4.
Essential role of HD3 on IP3R channel gating. (A) Two regions deleted in mutants lacking1,268-1,492 residues in HD2 domain and 2,195–2,215 residues in HD3 domain are depicted in the IP3R2217 crystal structure (Left), and our prepared deletion mutants are schematized (Right). (B) The 0.3-nM BK-evoked Ca2+ release from the ER was measured in Neuro2a cells under a nominally Ca2+-free condition. Typical responses of eight cells transfected with full length IP3R1 (control) or with HD3-mut (Δ2195–2215) were presented in the differences of Fura-2 ratio. (C) Bar charts summarizing the relative population ± SEM (%) of 0.3 nM BK responding cells calculated from data of more than four independent experiments (Left) and the amplitude of [Ca2+]i increase ± SEM (ΔR) calculated from data of more than 30 cells in (Right) (control, n = 326; D2550A, n = 183; HD2-mut, n = 121; HD3-mut, n = 228; CT-mut, n = 244; HD2+CT-mut, n = 35; HD3+CT-mut, n = 96). A Ca2+-conducting pore mutant (D2550A) served as a negative control (50). The significance of multiple comparisons was estimated by Dunnett’s method. ***P < 1 × 10⁻⁵.
Fig. S5.
Fig. S5.
Construction and expression/function analyses of truncated IP3R channels. (A) Primers for construction of IP3R1 mutants. Table lists forward primers (P1, P3, and P5) and reverse primers for the amplification of inserts as described in Methods. (B) Expression of recombinant IP3R1 in Neuro2a cells. Each lane of a 5% SDS/PAGE gel was applied with lysate of cells transfected with pEGFP-C1, EGFP-IP3R1 (control), EGFP-IP3R1Δ2195–2215 (HD3-mut), EGFP-IP3R1Δ1268–1492 (HD2-mut), and EGFP-IP3R1Δ2700–2749 (CT-mut). The relative amount of endogenous IP3R1was negligible compared with overexpressed IP3R1. (C) The 1 nM BK-evoked Ca2+ release from the ER was measured in Neuro2a cells under nominal Ca2+ free conditions. The bar charts summarize the relative population ± SEM (%) of 1 nM BK-responding cells calculated from the data of more than four independent experiments (Left) and the amplitude of [Ca2+]i increase ± SEM (ΔR) calculated from the data of more than 40 cells (Right). The significance of multiple comparisons was estimated by Dunnett’s method. ***P < 0.001; **P = 0.0017. (D) Typical images of [Ca2+]i measurements of control (Upper Left), HD3-mut (Upper Right), HD2-mut (Lower Left), and CT-mut (Lower Right) using Neuro2a cells cultured in two different dishes (Dish1/2). In each panel, the left images show GFP fluorescence and the middle and right images show F340/F380 ratios, with thermal pseudocolor coding before and after stimulation with 0.3 nM BK, respectively. Note that [Ca2+]i in cells transfected with control or CT-mut plasmids was increased by 0.3 nM BK, but was not increased in cells transfected with HD3-mut or HD2-mut plasmids. (E) Confirmation of ER targeting of IP3R1 mutants carried out in accordance with our previous studies, using COS-7 cells. Note that characteristic reticular distribution support deletion and substitution mutants were suitably targeted to the ER. (F) Binding abilities with ConA-Sepharose, confirming that the deletion and substitution mutants should be glycosylated. Lane E, 1% Triton X-100 extracts of COS-7 cells; lane C, ConA-Sepharose–bound fractions. The IP3R was detected by 4C11.
Fig. 5.
Fig. 5.
Critical sites in HD3 responsible for channel gating. (A) Amino acid sequences represent our mutated sites in which 10–11 amino acid residues (10G- and 11G-mut) or 5–6 amino acid residues (5Ga-, 5Gb-, 5Gc-, and 6G-mut) were substituted for glycine residues. (B) Mutated sites in the IP3R2217 crystal structure: 5Ga-mut, red; 5Gb-mut, purple; 5Gc-mut, green; and 6G-mut, blue. A critical glutamate residue, E2100, is shown in yellow. (C) Bar charts summarizing the relative population ± SEM (%) of 0.3 nM BK responding cells calculated from data of more than seven independent experiments (Left) and the amplitude of [Ca2+]i increase ± SEM (ΔR) calculated from data of more than 50 cells (Right) (control, n = 167; D2550A, n = 58; 10G-mut, n = 137; 11G-mut, n = 90; 5Ga-mut, n = 171; 5Gb-mut, n = 144; 5Gc-mut, n = 163; 6G-mut, n = 149). The significance of multiple comparisons was estimated by Dunnett’s method. *P = 0.0139; ***P < 0.001. (D) Model for IP3-dependent gating mechanism of IP3R. Two opposing IP3R2217 molecules are delineated by superimposing in the cryo-EM map (EMD-6369). Color codes of domains and critical sites in the leaflet structure are the same as in Figs. 1 and 3. The Ca2+ conducting pore formed with the transmembrane helix and the C-terminal region (light blue) were prepared according to coordinates of rat IP3R1 (PDB ID code 3JAV). We propose that IP3-dependent global conformational changes and gating transmission by the leaflet structure work in concert to open the channel pore (dotted lines).
Fig. S6.
Fig. S6.
Construction and function/expression analyses of glycine substitution mutants, and highly conserved amino acid sequences in the leaflet structure. (A) Primers for construction of substitution mutants. The table lists forward primers (P7–P12). (B) Expression of recombinant IP3R1 mutants in Neuro2a cells confirmed by Western blot analysis using a 4C11 monoclonal antibody. (C) The 0.3 nM BK-evoked Ca2+ release from the ER measured in Neuro2a cells under nominal Ca2+-free conditions. The bar charts summarize the relative population ± SEM (%) of 0.3 nM BK-responding cells calculated from the data of more than six independent experiments (Left) and the amplitude of [Ca2+]i increase ± SEM (ΔR) calculated from the data of more than 100 cells (Right). The significance of multiple comparisons was estimated by Dunnett’s method. ***P < 0.0001. (D) Sequences of IP3R and RyR isoforms of mouse (m), human (h), Xenopus (x), Drosophila (d), starfish (p), and Caenorhabditis elegans (c) around the leaflet structure aligned using the Clustal X program. Conserved branched chain amino acids, glutamates, basic amino acids, and phenylalanine residues are colored in green, orange, blue, and gray, respectively. GenBank accession numbers and residue numbers of each sequence are shown. (E) Atomic structure around the leaflet region of rabbit RyR1 modeled by high-resolution cryo-EM analyses (PDB ID code 5T15). The amino acid residues corresponding to the 5Ga, 5Gb, 5Gc, and 6G regions mutated in this study are colored red, purple, green, and blue, respectively. The channel domain of rabbit RyR1 and the leaflet-containing helical domain are colored blue and tan, respectively.

Similar articles

Cited by

References

    1. Berridge MJ. Inositol trisphosphate and calcium signalling. Nature. 1993;361:315–325. - PubMed
    1. Mikoshiba K. IP3 receptor/Ca2+ channel: From discovery to new signaling concepts. J Neurochem. 2007;102:1426–1446. - PubMed
    1. Patterson RL, Boehning D, Snyder SH. Inositol 1,4,5-trisphosphate receptors as signal integrators. Annu Rev Biochem. 2004;73:437–465. - PubMed
    1. Furuichi T, et al. Primary structure and functional expression of the inositol 1,4,5-trisphosphate-binding protein P400. Nature. 1989;342:32–38. - PubMed
    1. Nishiyama M, Hong K, Mikoshiba K, Poo MM, Kato K. Calcium stores regulate the polarity and input specificity of synaptic modification. Nature. 2000;408:584–588. - PubMed

Publication types

MeSH terms

Substances