. 2017 May 2;114(18):E3679-E3688.
doi: 10.1073/pnas.1617259114. Epub 2017 Apr 17.

Defective synaptic connectivity and axonal neuropathology in a human iPSC-based model of familial Parkinson's disease

Affiliations

Defective synaptic connectivity and axonal neuropathology in a human iPSC-based model of familial Parkinson's disease

Georgia Kouroupi et al. Proc Natl Acad Sci U S A. .

Abstract

α-Synuclein (αSyn) is the major gene linked to sporadic Parkinson's disease (PD), whereas the G209A (p.A53T) αSyn mutation causes a familial form of PD characterized by early onset and a generally severe phenotype, including nonmotor manifestations. Here we generated de novo induced pluripotent stem cells (iPSCs) from patients harboring the p.A53T mutation and developed a robust model that captures PD pathogenic processes under basal conditions. iPSC-derived mutant neurons displayed novel disease-relevant phenotypes, including protein aggregation, compromised neuritic outgrowth, and contorted or fragmented axons with swollen varicosities containing αSyn and Tau. The identified neuropathological features closely resembled those in brains of p.A53T patients. Small molecules targeting αSyn reverted the degenerative phenotype under both basal and induced stress conditions, indicating a treatment strategy for PD and other synucleinopathies. Furthermore, mutant neurons showed disrupted synaptic connectivity and widespread transcriptional alterations in genes involved in synaptic signaling, a number of which have been previously linked to mental disorders, raising intriguing implications for potentially converging disease mechanisms.

Keywords: Parkinson’s disease; axonal degeneration; dystrophic neurites; small molecules; α-synuclein.


Conflict of interest statement

The authors declare no conflict of interest.

Figures
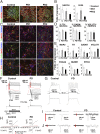
Fig. 1.
Fig. 1.
Directed neuronal differentiation of iPSCs. (A) Immunostaining of control, PD1, and PD2 iPSC-derived NPCs for Pax6 (green) and Nestin (red). Cell nuclei are counterstained with TOPRO3 (blue). (Scale bar, 40 µm.) (B) RT-qPCR analysis of Nestin and Pax6 mRNA expression normalized to GAPDH levels. Data represent mean ± SEM (n = 3–5 for each cell line). (C) Immunostaining of iPSC-derived neurons at 50 DIV. Cells were stained (red) for MAP2 or βIII-tubulin (TUJ1) and (green) for TH (dopaminergic neuron marker), GABA (GABAergic neuron marker), and VGLUT1 (glutamatergic neuron marker). TOPRO3+ nuclei are in blue. (Scale bar, 40 µm.) (D) Quantification of TH+, GABA+, and VGLUT1+ neurons as percentage of MAP2+ cells in control, PD1, and PD2 lines. Data represent mean ± SEM (n = 3–5 for each cell line). (E) RT-qPCR analysis of mRNA expression for MAP2, TH, GAD67 (GABAergic neuron marker), and VGLUT1, as well as for the dopaminergic lineage markers FOXA2, NURR1, and PITX3. Data represent mean ± SEM (n = 3–5 for each cell line). (FJ) Representative electrophysiological recordings from control and PD cells with typical neuronal morphology between 55 and 70 DIV. (F, Upper panels) Superimposed traces of currents evoked by depolarizing voltage steps (scheme of the protocol is shown in the Bottom Left panel). (Insets below Upper panels) Expanded from red lines rectangular traces of fast-activating, fast-inactivating inward Na+ currents evoked by depolarizing voltage steps. (Bottom panels) Superimposed traces of currents evoked by the same set of depolarizing voltage steps after 1-min preapplication of TTX (tetrodotoxin, 1 µM) + TEA (tetraethylammonium, 20 mM). Note the strong inhibition of both inward and outward components. (G) Examples of voltage deflections and different patterns of action potential generation induced by current injections (40 pA). Current-clamp recordings from two control cells (Left traces) and two PD-derived cells (Right traces). Protocol of current step is shown. (H) Current–voltage relations of outward K+ and inward Na+ currents (black) under control conditions and after 1 min application of 1 µM TTX + 20 mM TEA (red). (I and J) Spontaneous synaptic activity of the neurons measured at −70 mV. GABAergic (I) and glutamatergic (J) synaptic currents are depicted.
Fig. 2.
Fig. 2.
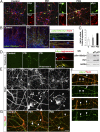
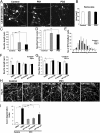
Pathological phenotypes of PD iPSC-derived neurons. (A) Immunostaining for αSyn (green) and TUJ1 (red) in control, PD1, and PD2 iPSC-derived neurons at 50 DIV. (Insets) The marked regions at higher magnification. (Scale bar, 40 µm.) (B) Immunostaining for Ser129-phosphorylated αSyn [p(Ser129)αSyn] (green) and TUJ1 (red) in control and PD iPSC-derived neurons at 50 DIV. (Scale bar, 40 µm.) pS129 staining in PD neurites is shown at higher magnification (Right). (C, Upper graph) Quantification of αSyn mRNA by RT-qPCR in control (C), PD1, and PD2 iPSC-derived neurons at 48 DIV. Data represent mean ± SEM (n = 3–5 for each cell line). (Lower panel) Detection of αSyn and p(Ser129)αSyn by Western blot (WB); GAPDH shows equal protein loading. (D) Thioflavin S staining shows protein aggregates in PD cultures at 50 DIV. Clearance of protein depositions by proteinase K. (Scale bar, 20 µm.) Costaining of aggregated proteins (aggresomes; arrowheads; Upper micrograph in red) and αSyn (green) inside inclusion bodies (merged picture, Lower micrograph). (Scale bar, 20 μm.) (E) Immunostaining for TUJ1 in control, PD1, and PD2 iPSC-derived neurons at 50 DIV. Higher magnification (Lower panels) shows neurites with swollen varicosities and spheroid inclusions (arrowheads in PD1 and PD2 neurons) that frequently end up in fragmented processes (arrow). (Scale bar, 10 µm.) (F) Coimmunostaining for αSyn (green) and TUJ1 (red) in PD iPSC-derived neurons shows αSyn+ swollen varicosities (arrowheads) in neurites with earlier (i) and more advanced (ii) signs of degeneration. (Scale bars, 10 µm.) (G) Coimmunostaining for TUJ1 (red) and the axonal protein TAU (green) in iPSC-derived neurons reveals colocalization of the two proteins in swollen varicosities and axonal fragments. Arrowheads and arrows indicate blebbed and fragmented axons, respectively. (Scale bar, 10 µm.)
Fig. 3.
Fig. 3.
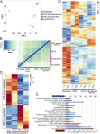
Summary of RNA-seq analysis. (A) Graph depicting the first two principal components (PC1 and PC2) of all sequenced samples. Principal component analysis was performed on the 1,000 genes having the highest expression variance across all samples. All groups exhibit distinct expression patterns and within-group uniformity. Samples: fibroblasts (green)—1, fetal; 2, control (C1); and 3, PD1; HUES/iPSCs (magenta)—4, HUES; 5, C1-1 iPSCs; 6, C1-2 iPSCs; 7, PD1-1 iPSCs; and 8, PD1-2 iPSCs; iPSC-derived NPCs (purple)—9, HUES-NPCs; 10, C1-1 NPCs; 11, C1-2 NPCs; 12, PD1-1 NPCs; and 13, PD1-2 NPCs; iPSC-derived neurons (orange)—14, HUES-neurons; 15, C1-1 neurons; 16, C1-2 neurons; 17, PD1-1 neurons; and 18, PD1-2 neurons. (B) Sample gene expression distance heat map calculated using all expressed genes in all samples: fibroblasts (green), HUES/iPSCs (magenta), NPCs (purple), and iPSC-derived neurons (orange). (C) Heat map depicting the expression of the 500 genes with the highest mean expression across all sequenced samples. (D) Heat map of differentially expressed transcripts between PD1-1/PD1-2 and C1-1/C1-2 iPSC-derived neurons. A total of 647 differentially expressed transcripts (268 up-regulated and 379 down-regulated) were detected between PD and control neurons (P < 0.05). Higher expressions are in red, and lower expressions are in blue. (E) Enrichment analysis of the significantly (P < 0.05) altered genes in the RNA-seq analysis of PD versus control iPSC-derived neurons against GO terms.
Fig. 4.
Fig. 4.
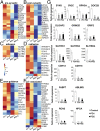
Gene expression analysis of iPSC-derived neurons. (AF) Differential gene expression between control (clones C1-1 and C1-2) and PD1 (clones PD1-1 and PD1-2) iPSC-derived neurons at 48 DIV. Heat maps of genes encoding presynaptic (A) and postsynaptic proteins (B), trans-synaptic adhesion molecules (C), cadherins (D), axon guidance molecules (E), and calcium-associated proteins (F). High expressions are in red and low expressions are in blue. (G) RT-qPCR analysis of selected genes in control (C), PD1, and PD2 iPSC-derived neurons at 48 DIV: presynaptic SYN3, SV2C, RPH3A, and DOC2B; postsynaptic DLGAP2 and receptors GRIN2D and GRIP2; trans-synaptic adhesion SLITRK1, -2, and -4; cadherins CDH 13 and 15, genes associated with axon guidance FABP7 and ABLIM3; and calcium-associated RCN3 and HPCA. Gene expression normalized to GAPDH. Data represent mean ± SEM (one-way ANOVA, *P < 0.05, **P < 0.01, ***P < 0.001, n = 3–5 for each cell line).
Fig. 5.
Fig. 5.
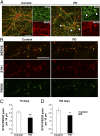
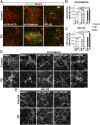
Synaptic connections in iPSC-derived neurons. (A) Immunofluorescence puncta of the presynaptic protein synapsin 1 (SYN1, green) in control and PD MAP2-positive (red) neurons seeded on mouse astrocytes and maintained for 100 DIV. Arrowheads indicate that SYN1 remains in the soma of many PD neurons in contrast to control neurons. (Insets) The marked regions at higher magnification. (Scale bar, 40 µm.) (B) Maximum projection confocal images showing SYN1+ (red) and PSD95+ (green) synaptic puncta pairs in control and PD neurons. (Scale bar, 10 µm.) (C and D) Quantification of the number of SYN1+/PSD95+ puncta pairs per 10 µm at 70 DIV (C) and at 100 DIV (D) in control and PD neurons. Data represent mean ± SEM (Student’s t test, *P < 0.05, **P < 0.01).
Fig. 6.
Fig. 6.
Reversal of the neuropathological phenotype of PD iPSC-derived neurons by small molecules targeting αSyn. (A) Neurite analysis. Representative fluorescent images of iPSC-derived neurons at 50 DIV transduced with a lentiviral vector expressing red fluorescent protein DsRed under the control of the human synapsin 1 promoter (LV.SYN1.DsRed). (Scale bar, 40 µm.) Quantification of soma size (B), neurite length (C), and number of neurites extending from the soma (D and E) in SYN1.DsRed-positive cells. Data represent mean ± SEM (one-way ANOVA, *P < 0.05, ***P < 0.001, n = at least 100 single DsRed-labeled neurons for each cell line). (F and G) Quantification of neurite length (F) and the number of neurites extending from the soma (G) of SYN1.DsRed-positive cells in control and PD1 neurons without treatment (DMSO) and after exposure to NPT100-18A, ELN484228, and NPT100-14A (2 nM). Data represent mean ± SEM (Student’s t test for control–DMSO vs. PD1–DMSO, **P < 0.01, one-way ANOVA for control–DMSO vs. control–compounds and for PD1–DMSO vs. PD1–compounds, *P < 0.05, n = at least 100 single DsRed-labeled neurons for each condition). (H) Axonal pathology observed by TUJ1 immunostaining in PD1 cells is significantly improved by compound treatment. (Scale bar, 40 µm.) (I) Quantification of axonal degeneration by measuring the ratio of TUJ1+ spots over the total TUJ1+ area in untreated (DMSO) or compound-treated PD1 iPSC-derived neurons. Data represent mean ± SEM (one-way ANOVA, **P < 0.01, ***P < 0.001, n = 20 randomly selected fields for each condition).
Fig. 7.
Fig. 7.
Rescue of the cytotoxic effect of proteasome inhibition on PD iPSC-derived neurons. (A) Representative images of control and PD iPSC-derived neurons (55 DIV) immunostained for active cleaved caspase 3 (green) and MAP2 (red) after 24 h incubation with or without the proteasome inhibitors epoxomicin (1 µM) and MG-132 (10 µM). (Scale bar, 40 µm.) (B and C) Quantification of LDH activity (490–630 nm) in the culture supernatant as a measure of cytotoxicity in cells treated with epoxomicin (B) or MG-132 (C) under the same conditions as above. Data represent mean ± SEM from LDH activity in supernatants derived from 4 to 32 wells of four to six independent experiments performed in neurons derived from two iPSC lines from each subject (one-way ANOVA or ANOVA in Ranks for between-group comparisons followed by Dunn’s test or Holm–Sidak for pairwise comparisons, *P < 0.05, ***P < 0.001). (D and E) Induced-cytotoxicity experiments in iPSC-derived neurons (55–57 DIV) untreated (DMSO) or treated with small-molecule inhibitors of αSyn aggregation NPT100-18A, NPT100-14A, and ELN484228 (2 µM). Representative fluorescent images show TUJ1-positive neuronal network in DMSO and compound-treated cells after (D) epoxomicin (1 µM) or (E) MG-132 (10 µΜ) addition for 24 h. (Scale bar in D, 40 µm.)

Similar articles

Cited by

References

    1. Lees AJ, Hardy J, Revesz T. Parkinson’s disease. Lancet. 2009;373:2055–2066. - PubMed
    1. Obeso JA, et al. Missing pieces in the Parkinson’s disease puzzle. Nat Med. 2010;16:653–661. - PubMed
    1. Schapira AH, Tolosa E. Molecular and clinical prodrome of Parkinson disease: Implications for treatment. Nat Rev Neurol. 2010;6:309–317. - PubMed
    1. Braak H, Braak E. Pathoanatomy of Parkinson’s disease. J Neurol. 2000;247:II3–II10. - PubMed
    1. Bendor JT, Logan TP, Edwards RH. The function of α-synuclein. Neuron. 2013;79:1044–1066. - PMC - PubMed

Publication types