. 2017 Apr 18:8:14780.
doi: 10.1038/ncomms14780.

Neutrophil stunning by metoprolol reduces infarct size

Affiliations

Neutrophil stunning by metoprolol reduces infarct size

Jaime García-Prieto et al. Nat Commun. .

Abstract

The β1-adrenergic-receptor (ADRB1) antagonist metoprolol reduces infarct size in acute myocardial infarction (AMI) patients. The prevailing view has been that metoprolol acts mainly on cardiomyocytes. Here, we demonstrate that metoprolol reduces reperfusion injury by targeting the haematopoietic compartment. Metoprolol inhibits neutrophil migration in an ADRB1-dependent manner. Metoprolol acts during early phases of neutrophil recruitment by impairing structural and functional rearrangements needed for productive engagement of circulating platelets, resulting in erratic intravascular dynamics and blunted inflammation. Depletion of neutrophils, ablation of Adrb1 in haematopoietic cells, or blockade of PSGL-1, the receptor involved in neutrophil-platelet interactions, fully abrogated metoprolol's infarct-limiting effects. The association between neutrophil count and microvascular obstruction is abolished in metoprolol-treated AMI patients. Metoprolol inhibits neutrophil-platelet interactions in AMI patients by targeting neutrophils. Identification of the relevant role of ADRB1 in haematopoietic cells during acute injury and the protective role upon its modulation offers potential for developing new therapeutic strategies.


Conflict of interest statement

The authors declare no competing financial interests.

Figures
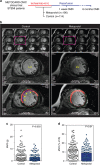
Figure 1
Figure 1. Metoprolol administration during ongoing AMI reduces MVO in patients.
(a) METOCARD-CNIC trial scheme: patients with ongoing ST-segment elevation myocardial infarction (STEMI) were recruited and randomized to receive metoprolol (15 mg i.v. doses) or control before reperfusion. A total of 220 patients were evaluated for MVO by cardiac magnetic resonance (CMR) imaging 1 week after AMI and 202 patients for an additional CMR at long-term LVEF 6 months after AMI for ventricular function assessment. (b) Representative CMR exams (short-axis covering the entire left ventricle (LV) from base to apex), showing significant differences in 1-week MVO between a control patient (left) and a metoprolol-treated patient (right). Lower panels show detailed views of the boxed images, revealing MVO (blue area, automatic quantification), defined as the absence of contrast wash-in inside the delayed gadolinium-enhanced area (red, semiautomatic quantification). Yellow arrowheads indicate MVO in the LV wall. (c) Quantification of MVO in grams of left ventricle. (d) Quantification of MVO relative to the infarcted area (%). Dots represent values for individual patients: 114 in the control group (grey) versus 106 in the metoprolol group (blue). Data are means±s.e.m. and compared by unpaired Student's t-test.
Figure 2
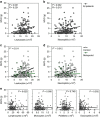
Figure 2. Metoprolol abrogates neutrophil count positive association with extent of MVO.
Sensitivity analysis of the association between MVO and leukocyte and subpopulations count on admission from METOCARD-CNIC trial patients. (a,b) Association between MVO and absolute leukocyte or neutrophil count on admission. Grey dots represent individual values and line linear relationship. (c,d) Linear regression comparison between MVO and leukocytes and neutrophils in the subsets of METOCARD patients indicating loss of correlation in the metoprolol treated group (green) as compared to control group (white). P′, stands for interaction P value. (e) Association between MVO and rest of white blood cells subpopulations: Platelets, lymphocytes, eosinophils and monocytes showing no correlation in the extent of MVO. P stands for P value and R, for Pearson's correlation coefficient.
Figure 3
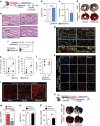
Figure 3. Metoprolol reduces neutrophil infiltration and capillary obliteration in murine IR.
(a) Mouse model of myocardial IR. (b, c) Histological evaluation of left ventricle (LV) area at risk (AAR) and infarct size (IS) in mice subjected to IR and randomized to receive metoprolol (blue) or vehicle (white); NS stands for non-significant. n=8. (d) Representative images of LV slices showing AAR (negative for Evans Blue) in upper panels and extent of necrosis (triphenyltetrazoliumchloride (TTC)-negative area in lower panels). (e) Capillary oblliteration quantified in H&E ten random images; n=5–6. (f) Representative H&E myocardial images at 6 h reperfusion showing disarrayed and abundant obstructed capillaries in the vehicle-treated sample; metoprolol-treated samples show injury and nuclear condensation but no signs of MVO; green scale bars, 50 μm. Detailed amplification of the boxes show obstructed capillaries indicated with black arrows; black scale bars, 10 μm. (g) Confocal images from LV at 6 h after reperfusion onset showing massive vascular neutrophil migration (LysM-GFP, green) and co-aggregates with platelets (CD41, red) vehicle- but not in metoprolol-treated mice; scale bar, 25 μm. Next, amplified boxes indicating regions of capillary obstruction; scale bar, 10 μm. Bottom yellow panels show computed 3D reconstructions. (h,i) Myeloid-derived cell infiltration dynamics showing maintained attenuation in hearts from metoprolol-treated mice. n=5. (j) Neutrophilic proportions infiltrate dynamics. (k) Representative confocal images of LV sections taken from injured mice after 6 and 24 h reperfusion onset. Myeloid infiltration (LysM-GFP+, green) most of which are neutrophil (Ly6G+, red) is evident in vehicle-treated mice and significantly attenuated in those from metoprolol-treated mice; merged images show double positive cells (LysM+/Ly6G+, that is, neutrophils). Scale bar, 50 μm; n=3–5. (l) Representative confocal images of neutrophil infiltration 24 h after reperfusion onset. Vehicle-treated mice show massive myocardial neutrophil infiltration (LysM-GFP+, green), with dispersed cells attached to the injured cardiac fibre membranes (α-actinin, red; laminin, grey). (m) LysM+ total area in the LV section as a %AAR; scale bar, 20 μm; n=5–6. (nq) Effect of metoprolol on limiting-infarct size in neutrophil-depleted mice. (n) Neutrophil depletion model. (o) Myocardial area at risk (AAR). (p) Infarct size. (q) Representative transverse ventricular slices showing AAR and infarct size Data are means±s.e.m. *P<0.05; **P<0.01, determined by the nonparametric Wilcoxon–Mann–Whitney test for each panel.
Figure 4
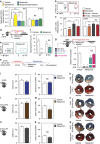
Figure 4. Metoprolol directly inhibits neutrophil deleterious function through a ADRB1-blockade.
(a) Effect of metoprolol on CXCL1-induced migration of fresh isolated primary neutrophils (Ly6G+) from WT or Adrb1-knockout (β1KO) mice. CXCL1-stimulated cells were incubated with vehicle, epinephrine (10 μM), metoprolol (10 μM) and epinephrine+metoprolol; n=4 independent experiments. NS, stands for non-significant. (b,c) Inhibitory effect of metoprolol on W-peptide-induced ROS production on fresh isolated primary neutrophils (Ly6G+) from WT or β1KO mice. Mean fluorescent intensity of Rho123 in Ly6G+ neutrophils after W-peptide stimulation. n=6 independent experiments; flow cytometry plots illustrate reduced expression of Rho123 in metoprolol-treated neutrophils. (df) Effect of metoprolol on limiting-thioglycolate-induced peritoneal infiltration on WT and β1KO mice. (e) Flow cytometry plots illustrating reduced infiltration of neutrophils (CD115neg; GR1+) in metoprolol-treated mice. Absolute neutrophils detected per ml of infiltrate at 16 h after thioglycolate injection in WT mice (n=7–9) or β1KO mice (n=5). (g) Effect of metoprolol on thioglycolate-induced neutrophil infiltration in the four BMT groups. Protocol scheme for thioglycolate-induced peritonitis assay after bone-marrow transplants (BMT) between WT and β1KO mice, evaluating the influence of the presence or absence of ADRB1 in circulating cells. Data are normalized to vehicle; n=4–9. (h) Protocol scheme for IR experiments in chimeric animals after BMT, evaluating the infarct-limiting effect of metoprolol in the presence or absence of ADRB1 in circulating cells. (iq) Area at risk (AAR) and infarct size, as well as representative images of Evans blue and TTC staining in metoprolol-treated and vehicle-treated β1KO and chimeras (WT bone marrow transplanted into β1KO mice and reverse transplants). Infarct size is reduced by metoprolol only when circulating cells express β1-adrenergic receptor; n=9 (i,j), n=8 (l,m), n=5–6 (o,p). Data are means±s.e.m. *P<0.05; **P<0.01; ***P<0.001, determined by the nonparametric Wilcoxon–Mann–Whitney test or using the one-way ANOVA and Holm Sidak's post-hoc multiple comparisons method.
Figure 5
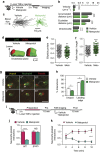
Figure 5. Metoprolol stuns neutrophils and prevents interactions with platelets.
(a) Experimental design: WT mice receiving TNFα were randomized to receive i.v. metoprolol or vehicle before analysis of cremaster muscle vessels by 2D and 3D intravital microscopy. (b) Quantification of parameters related to two-dimensional intravascular motility; n=54–141 cells from 3 to 4 mice. (c) Representative tracks of crawling neutrophils within inflamed vessels. (d) 3D reconstructions of representative neutrophils within live vessels of saline-treated and metoprolol-treated mice (red, uropod; green, cell body). (e,f) Quantification of 3D parameters, indicating reduced elongation (prolate ellipticity) and enhanced projection of recruited neutrophils into the luminal space (height-to-length ratio); n=68–105 cells from 3 to 4 mice. (g,h) Representative time-lapse images and percentage of interactions of platelets (CD41, red) with the polarized neutrophil uropod (CD62L, yellow) or leading edge (Ly6G, green); n=28–29 vessels from 3 to 4 mice. White arrowheads indicate interactions with the uropod and the dotted line the displacement of the cells during 30 s. Scale bar, 10 μm. (i) Protocol scheme for evaluating the acute inhibitory effect of metoprolol on activated and polarized neutrophils on WT and AdrbB1-knockout (β1KO) mice. (j) Absolute neutrophil–platelet intravascular interactions in WT and β1KO mice. NS, stands for non-significant. (k) Temporal neutrophil–platelet interaction inhibition in WT mice after administration with i.v. metoprolol. Data are means±s.e.m. *P<0.05; **P<0.01; ***P<0.001, determined by unpaired Student's t-test for each parameter.
Figure 6
Figure 6. Metoprolol inhibits neutrophil–platelet interactions.
(a) Experimental scheme and representative confocal images evaluating the effect of metoprolol on the number of co-aggregates of neutrophils (LysM-GFP+, green) and platelets (CD41, red) in the post-reperfused mouse myocardium. (b,c) LysM-GFP+ cells (neutrophils) attached to coronary vessels (n=7–9) and the numbers of interacting platelets (CD41+) per neutrophil in reperfused myocardium. Scale bar, 20 μm. (d) Protocol scheme for the IR experiment evaluating the effect of neutrophil-platelet blockade with anti-PSGL1 Ab (administered 15 min after ischaemia onset, that is, 30 min before reperfusion) on the infarct-limiting effect of metoprolol (administered 35 min after ischaemia onset, that is,10 min before reperfusion). (eg) AAR, infarct size, and representative images of Evans blue and TTC staining in vehicle- and metoprolol-treated mice pretreated with anti-PSGL1 Ab. n=5–7. NS, stands for non-significant. Data are means±s.e.m. *P<0.05; **P<0.01. Comparison was determined by the nonparametric Wilcoxon–Mann–Whitney test.
Figure 7
Figure 7. Metoprolol inhibits neutrophil–platelet interactions in patients.
(a) Effect of metoprolol on neutrophil–platelet co-aggregate formation in epinephrine-stimulated whole blood from healthy volunteers (n=20). Whole blood was incubated in vitro with epinephrine 5 μΜ and metroprolol (Meto, concentrations in μΜ). (b) In vivo effect of metoprolol (up to15 mg i.v.) on the number of neutrophil i.v.platelet co-aggregates in acute coronary syndrome (ACS) patients scheduled for coronary angioplasty. Blood was drawn before and after metoprolol i.v. administration; n=6 ACS patients. Pre, before i.v. administration; Post, after i.v. administration. Data are means±s.e.m. *P<0.05; **P<0.01, determined by one-way ANOVA and Holm Sidak's post-hoc multiple comparisons method.

Comment in

References

    1. Ibanez B., Heusch G., Ovize M. & Van de Werf F. Evolving therapies for myocardial ischemia/reperfusion injury. J. Am. Coll. Cardiol. 65, 1454–1471 (2015). - PubMed
    1. Hausenloy D. J. & Yellon D. M. Myocardial ischemia-reperfusion injury: a neglected therapeutic target. J. Clin. Invest. 123, 92–100 (2013). - PMC - PubMed
    1. Vinten-Johansen J. Involvement of neutrophils in the pathogenesis of lethal myocardial reperfusion injury. Cardiovasc. Res. 61, 481–497 (2004). - PubMed
    1. Kolaczkowska E. & Kubes P. Neutrophil recruitment and function in health and inflammation. Nat. Rev. Immunol. 13, 159–175 (2013). - PubMed
    1. Fernandez-Jimenez R. et al.. Pathophysiology underlying the bimodal edema phenomenon after myocardial ischemia/reperfusion. J. Am. Coll. Cardiol. 66, 816–828 (2015). - PubMed

Publication types

MeSH terms