. 2017 Apr 18:8:14920.
doi: 10.1038/ncomms14920.

Unification of de novo and acquired ibrutinib resistance in mantle cell lymphoma

Affiliations

Unification of de novo and acquired ibrutinib resistance in mantle cell lymphoma

Xiaohong Zhao et al. Nat Commun. .

Abstract

The novel Bruton's tyrosine kinase inhibitor ibrutinib has demonstrated high response rates in B-cell lymphomas; however, a growing number of ibrutinib-treated patients relapse with resistance and fulminant progression. Using chemical proteomics and an organotypic cell-based drug screening assay, we determine the functional role of the tumour microenvironment (TME) in ibrutinib activity and acquired ibrutinib resistance. We demonstrate that MCL cells develop ibrutinib resistance through evolutionary processes driven by dynamic feedback between MCL cells and TME, leading to kinome adaptive reprogramming, bypassing the effect of ibrutinib and reciprocal activation of PI3K-AKT-mTOR and integrin-β1 signalling. Combinatorial disruption of B-cell receptor signalling and PI3K-AKT-mTOR axis leads to release of MCL cells from TME, reversal of drug resistance and enhanced anti-MCL activity in MCL patient samples and patient-derived xenograft models. This study unifies TME-mediated de novo and acquired drug resistance mechanisms and provides a novel combination therapeutic strategy against MCL and other B-cell malignancies.


Conflict of interest statement

The authors declare no competing financial interests.

Figures
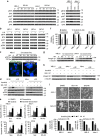
Figure 1
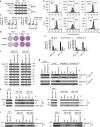
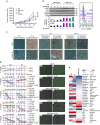
Figure 1. B-cell receptor (BCR) signalling is a central ‘outside-in' and ‘inside-out' signalling hub for MCL cell survival and growth.
(a) Co-culture with lymph node stromal cells (HK-Ad) and bone marrow stromal cells (HS-5) induced a time-dependent BCR signalling activation detected by western blot for BCR downstream molecules (BTK, AKT, ERK) phosphorylation in MCL cell lines (HBL-2, Jeko-1). (b) Co-culture with lymph node stromal cells induced BCR signalling activation detected by western blot for BCR downstream molecules (BTK, AKT, ERK) phosphorylation in primary MCL samples (MCL1–5). (c) Co-culture with lymph node stromal cells induced BCR (CD79a) phosphorylation detected by western blot and immunofluorescence staining in HBL-2 cells in co-culture with HK cells. Scale bar, 10 μM. (d) Inhibition of BCR signalling using BTK and PI3Kδ inhibitors (50 nM ibrutinib and 100 nM GS-1101) attenuated stroma-induced AKT and ERK activation in SP49 and Mino cells. (e) Ibrutinib induced cell apoptosis, overcame stroma-mediated drug resistance and enhanced doxorubicin (0.5 μM)-induced apoptosis in Jeko-1, HBL-2, Mino and SP49 cells (Sus, cells in suspension, HK-Ad, cells in co-culture with HK cells). *P<0.05 and **P>0.05 (Student's t-test). (f) Ibrutinib inhibited clonogenic growth with and without stroma co-culture. (g) Co-culture of stromal HK cells with MCL cells upregulated β1 expression in HBL-2 and Jeko-1 cells. (h) Inhibition of BCR signalling using BTK and PI3Kδ inhibitors (1 μM ibrutinib and 1 μM GS-1101) attenuated stroma-induced integrin β1 expression in HBL-2, Jeko-1 and Mino cells. (i) Inhibition of BCR signalling by ibrutinib attenuated adhesion of HBL-2, Jeko-1 and MCL patient cells to stroma cells (HK or HS-5) determined by microscopic examination and by the intensity of calcein-AM. Results in ai are representative or means±s.d. from at least three biological replicates. See also Supplementary Figs 1, 8 for full gel scan of the WB.
Figure 2
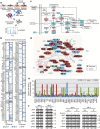
Figure 2. Chronic ibrutinib treatment leads to kinome reprogramming and PI3K-AKT-mTOR pathway activation and ibrutinib resistance in MCL cells.
(a) Schematic workflow of activity-based protein profiling (ABPP) to identify global kinome changes in MCL cells. Briefly, cell lysis were sonicated, desalted and followed by incubation with 10 μM desthiobiotin-ATP probes. The labelled proteins were reduced, alkylated and trypsin digested, and the labelled peptides were purified with high capacity streptavidin agarose resin, washed, eluted and subjected to LC-MS/MS for quantification. (b) Kinome profiling of IR MCL cells compared with parental cells (HBL-2, Jeko-1, SP49). Ratios ≥1 indicate increased kinase ATP probe binding with relative increased activity, and values <1 indicate decreased ATP probe binding with decreased activity relative to parental cells. Data averages of two biological replicates. (c) KEGG pathway analysis map showing activation of PI3K-AKT-mTOR as a central signalling hub of kinome reprogramming for IR development. Pink, kinases with increased activity detected by ABPP. (d) Common kinase ATP-binding changes after 6-h ibrutinib treatment in all three parental MCL cell lines (Jeko-1, HBL-2, SP49). Kinome trees reproduced courtesy of Cell Signaling Technology. (e) Sustained kinase ATP-binding activity in IR MCL lines relative to their parental cell lines after 6 h ibrutinib treatment. (f) Western blots showing increased AKT, 4EBP and S6K1 phosphorylation in Jeko-1-IR and HBL-2-IR cell lines, as well as sustained AKT activation in the presence of ibrutinib (6 μM, 12 h) treatment in IR cells compared with parental (Sen) cells. (b,d,e) are from two biological replicates with four technical replicates. Results in f are representatives of three independent experiments. The relative changes of proteins were measured by quantitative densitometry and indicated below each lane. See also Supplementary Figs 2, 8 for full gel scan of the WB.
Figure 3
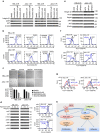
Figure 3. Interplay of PI3K-AKT-mTORC and integrin β1/integrin linked kinase pathways in IR MCL cells.
(a,b) Western blots (a) and flow cytometry (b) showing increased and sustained integrin β (β1) expression in IR MCL cells compared to parental (Sen) cells in the absence and presence of ibrutinib treatment (6 h). (c) Cell adhesion assay showing increased and sustained cell adhesion of IR MCL cells to stromal HK cells in the absence and presence of ibrutinib treatment (12 h). (d) Colony formation assay showing enhanced clonogenic growth in IR MCL cells in the absence and presence of ibrutinib treatment. (e,f) Cell adhesion assay (e) and western blots (f) showing stable integrin β1 (CD29) knockdown with shRNAs significantly decreased rictor, pAKT, p4EBP and pS6K1 in IR MCL cells and significantly attenuated cell adhesion of parental (Sen) and IR MCL cells to HK stromal cells. (g) Co-immunoprecipitation revealed β1 and ILK form a complex in Jeko-1-IR and HBL-2-IR cells and β1 knockdown abolished β1/ILK complex formation. *indicates the specific band for integrin β1 (h) Co-immunoprecipitation showing ILK co-immunoprecipitates with rictor to form a more abundant complex in Jeko-1-IR and HBL-2-IR cells versus that shown in their parental (Sen) cells. (i) Co-immunoprecipitation showing suppression of β1/ILK co-immunoprecipite formation in parental (Sen) but not in IR MCL cells after ibrutinib treatment in HBL-2-IR and Jeko-1-IR cells. Scale bar, 10 μm. Results in ag are representative of at least three independent experiments or means±s.d. from at least three biological replicates. For af, relative changes of proteins were measured by quantitative densitometry and indicated below each lane. See also Supplementary Figs 3, 8 for full gel scan of the WB.
Figure 4
Figure 4. Functional dissection of mTORC1 and mTORC2 in cell growth and stroma/MCL interaction in acquired IR MCL cells.
(ac) Treatment with the PI3K/mTOR inhibitors BEZ235 and AZD8055, but not ibrutinib, significantly decreased AKT phosphorylation, β1 expression (a,b), and adhesion to HK stromal cells (c) in IR MCL cells. (d) Rapamycin inhibited mTORC1 activation, but had no effect on AKT activation and β1 expression in IR MCL cells. (e,f) Inhibition of mTORC2 by rictor knockdown using a pool of siRNAs decreased AKT activation, β1 expression and cell adhesion. In contrast, blocking mTOR1 by raptor knockdown with siRNA showed no changes in AKT activation and β1 expression in IR MCL cells. (g) Treatment with AKT inhibitor (AKTi, A674563, for 12 h) significantly attenuated β1 (CD29) expression in IR MCL cells. (h) Diagram of functional regulation of mTORC1 and mTORC2 in proliferation, AKT activation, β1 expression and cell adhesion in IR cells. Results in ag are representative of at least three independent experiments or means±s.d. from at least three biological replicates. See also Supplementary Figs 4, 8 for full gel scan of the WB.
Figure 5
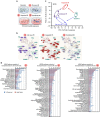
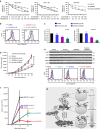
Figure 5. Functional coordination between TME-mediated (de novo) and acquired IR.
(a) Diagram of three types of drug resistance mechanisms for kinase activity profile: parental cells after co-culture with stromal (HK) cells (de novo DR), IR cells after chronic ibrutinib exposure in cell suspension (acquired DR) and IR cells selected with drug (chronic ibrutinib exposure) in the presence of stroma (combined DR). Parental cells in suspension are as reference. (b) Significant increased kinase ATP-binding changes in de novo DR cells (left), acquired DR cells (middle) and combined DR (right). Parental cells maintained in suspension were used as the control reference population (Jeko-1, HBL-2 and SP49). Kinome trees reproduced courtesy of Cell Signaling Technology. (c) Principal component analysis (PCA) of kinomes of parental/sensitive, de novo IR (TME-mediated), acquired IR and IR selected while adherent to TME stroma (combined IR) cells, which correlate with the first two principal components. (d) KEGG pathway enrichment analysis revealed highly significant pathways (−log P value>2) in the three types of IR kinome. Parental cells maintained in suspension were used as the control reference population. There is a greater overlap between acquired IR and combined IR relative to de novo IR. See also Supplementary Fig. 5.
Figure 6
Figure 6. IR mechanism sustained in in vivo xenograft model, ex vivo primary MCL specimens and recapitulated in drug screening assay.
(a) Xenograft experiments showed that HK cells enhanced tumour formation of both parental (Sen) and IR MCL cells (HBL-2). IR MCL cells had more robust tumour formation in vivo compared with parental cells. *P<0.05, n=5 per cohort (Student's t-test). (b) Immunoblot and flow cytometry conducted on MCL samples from NOD/SCID mice injected with HBL-2 cells and IR HBL-2 with and without co-injection of HK cells of cohorts as described in a. 1–8 represent eight xenografts, with relative expression of pAKT and p-4EBP were quantitated by quantitative densitometry and shown in coloured bar graph. (c) Immunohistochemistry stains showing elevated AKT activation (c) and β1 expression (d) in IR MCL patient samples when compared with ibrutinib-sensitive samples or samples on the progression after ibrutinib treatments. Scale bar, 10 μm. (d) A cell-based drug screening assay was used to measure cell growth and chemosensitivity to indicated chemical agents in a reconstructed TME. Parental and IR cells (SP49-Sen and SP49-IR) were seeded in 384-well plates of reconstructed bone marrow, including high physiological cell densities (1–10 × 106 cells per ml), extracellular matrix (collagen 1) and human bone marrow derived stromal cells (BMSC). A panel of drugs at five different concentrations was added to the media, and plates were continuously imaged for 96 h using a digital image analysis algorithm to identify viable cells based on membrane motion (pseudo-coloured in green). Changes in viability are quantified by area under curve (AUC). Left, cell growth and viability of sensitive (Sen) and IR MCL cells was measured with no treatment, treatment with ibrutinib, doxorubicin, MK2206 or INK128; right, images at 48 h in these conditions. Negative controls (no drug) were included, as well as positive controls for each drug (cell line MM1.S at highest drug concentration). Scale bar, 30 μm. (e) Heat map showing chemosensitivity of parental (Sen) and IR cells (Resis) to 31 agents including protein kinase inhibitors, inhibitors of enzymatic processes and chemotherapeutic agents. See also Supplementary Figs 6, 8 for full gel scan of the WB.
Figure 7
Figure 7. Inhibition of the PI3K-AKT-mTOR pathway overcomes IR in ex vivo and in vivo using patient derived xenografts (PDX) model.
(ac) AZD8055 treatment in combination with ibrutinib more substantially inhibited cell viability measured by CCK8 assay in IR MCL cells (a), more substantially inhibited β1 expression (b) in two IR primary samples and cell adhesion (c) in four IR primary MCL patient samples. *P<0.05 and **P≥0.05 (Student's t-test). (d,e) AZD8055 treatment led to a reduction in tumour growth that was enhanced in combination with ibrutinib (co-treatment). (d) the co-treatment of AZD8055 and ibrutinib markedly reduced pAKT, p4EBP and CD29 levels (e) in murine xenografts as indicated. (f) Combinatorial treatments of BEZ235 or AZD8055 with ibrutinib induced more dramatic anti-MCL activity in a patient-derived xenograft from IR MCL (PDX). The NSG mice bearing the PDXs were randomly divided into six groups (5 per group), with growing tumours subsequently treated with solvent (equal volume of vehicle, blue), ibrutinib 25 mg kg−1 alone (orange), AZD8055 5 mg kg−1 alone (purple), BEZ235 10 mg kg−1 alone (green), ibrutinib 25 mg kg−1 with AZD8055 5 mg kg−1 (red), or ibrutinib 25 mg kg−1 with BEZ235 10 mg kg−1 (green) all by oral gavage daily. Tumour burden was assessed by tumour volume measurements at days 1, 12 and 19 after treatment. (g) A simplified IR model showing enforced interaction of the MCL-stromal cells and IR development under ibrutinib treatment. β1 contributed to the PI3K-AKT-mTOR1 activation through forming complex with ILK and mTORC2 and that PI3K-AKT, in turn, induced β1 expression, thereby generating a positive feedback loop, ensuring high level and sustained TME–lymphoma interaction and allowing cells to acquire a more permanent and complex drug resistance phenotype in MCL cells. Results in a,c are shown as mean+s.d. from at least three biological replicates. See also Supplementary Figs 7, 8 for full gel scan of the WB.

Similar articles

Cited by

References

    1. Jares P., Colomer D. & Campo E. Molecular pathogenesis of mantle cell lymphoma. J. Clin. Invest. 122, 3416–3423 (2012). - PMC - PubMed
    1. Lwin T. et al.. A microenvironment-mediated c-Myc/miR-548m/HDAC6 amplification loop in non-Hodgkin B cell lymphomas. J. Clin. Invest. 123, 4612–4626 (2013). - PMC - PubMed
    1. Shain K. H., Dalton W. S. & Tao J. The tumor microenvironment shapes hallmarks of mature B-cell malignancies. Oncogene 34, 4673–4682 (2015). - PMC - PubMed
    1. Woyach J. A., Johnson A. J. & Byrd J. C. The B-cell receptor signaling pathway as a therapeutic target in CLL. Blood 120, 1175–1184 (2012). - PMC - PubMed
    1. Shipp M. A. BCR signalling and survival pathways in lymphoma. Hematol. Oncol. 33, 140–141 (2015).

Publication types

MeSH terms

LinkOut - more resources