. 2018 Apr;23(4):892-903.
doi: 10.1038/mp.2017.28. Epub 2017 Apr 18.

Perisomatic changes in h-channels regulate depressive behaviors following chronic unpredictable stress

Affiliations

Perisomatic changes in h-channels regulate depressive behaviors following chronic unpredictable stress

C S Kim et al. Mol Psychiatry. 2018 Apr.

Abstract

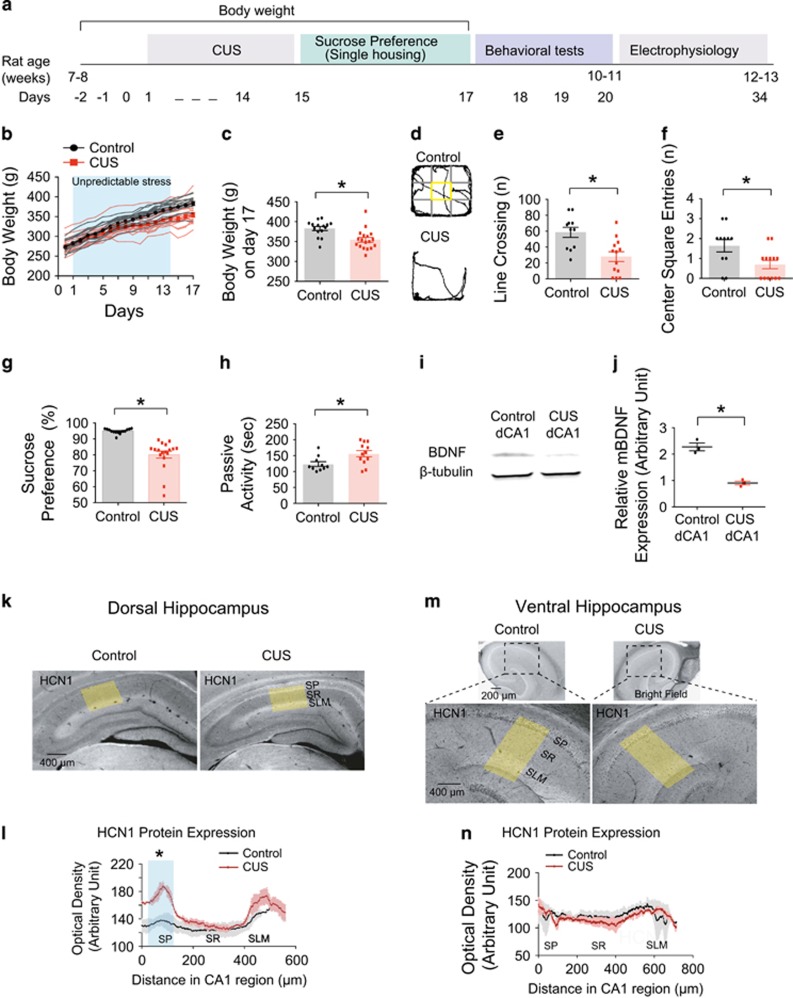
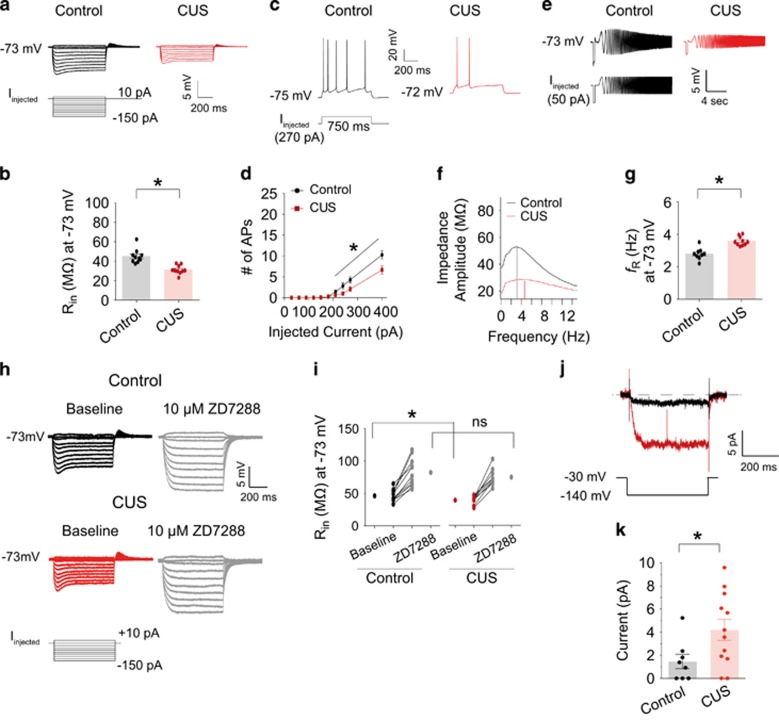
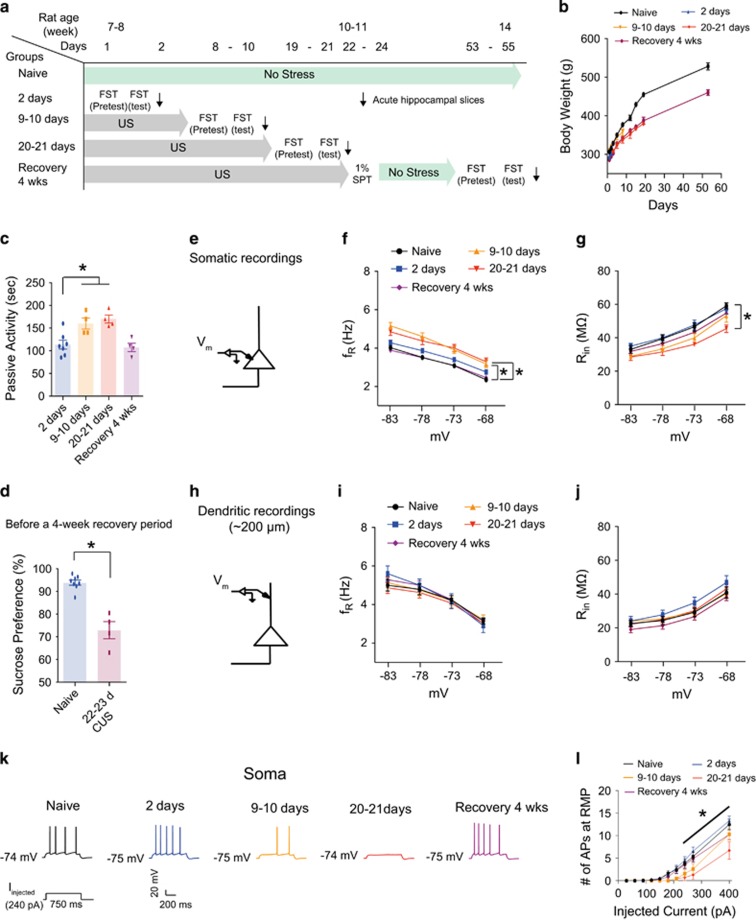
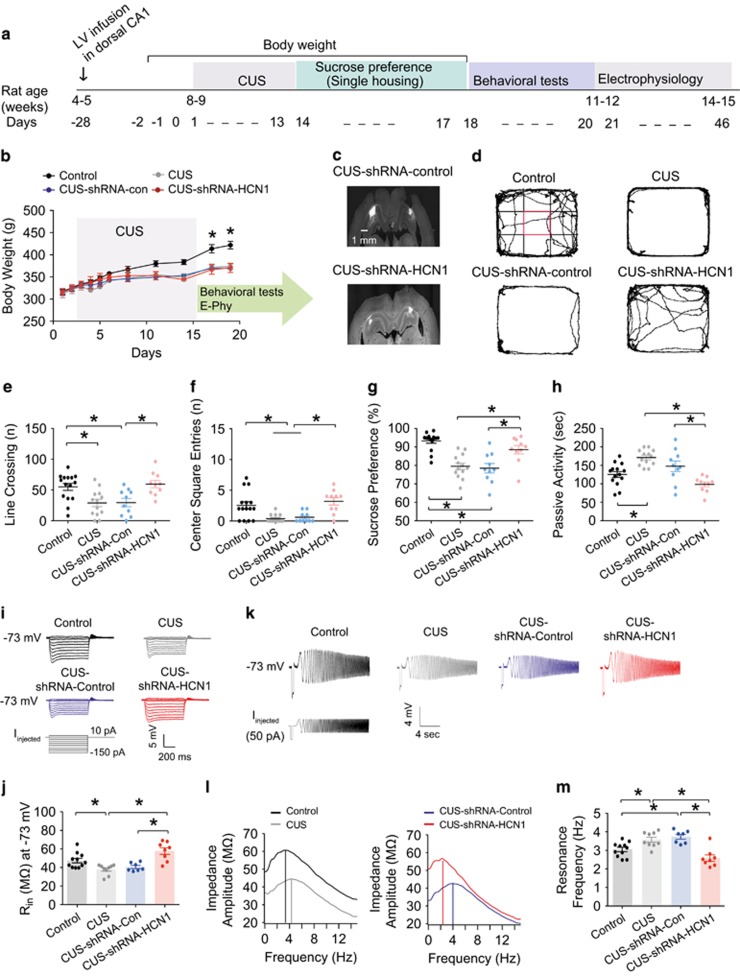
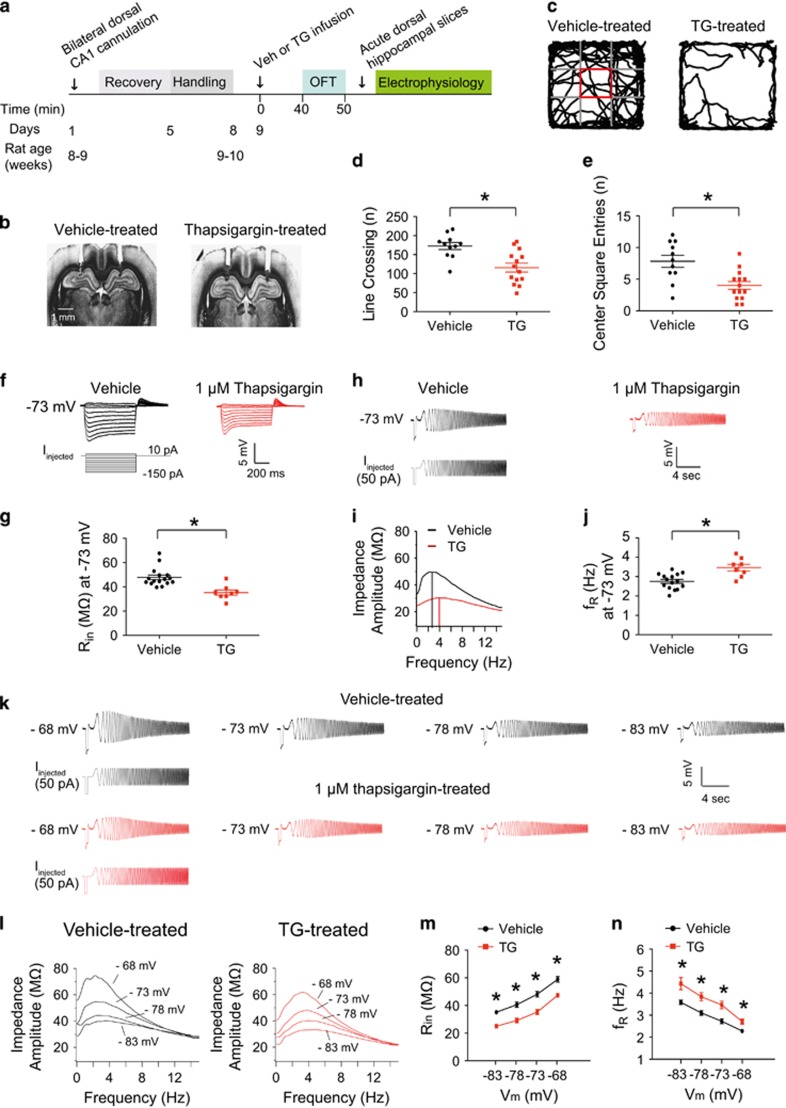
Chronic stress can be a precipitating factor in the onset of depression. Lentiviral-mediated knockdown of HCN1 protein expression and reduction of functional Ih produce antidepressant behavior. However, whether h-channels are altered in an animal model of depression is not known. We found that perisomatic HCN1 protein expression and Ih-sensitive physiological measurements were significantly increased in dorsal but not in ventral CA1 region/neurons following chronic unpredictable stress (CUS), a widely accepted model for major depressive disorder. Cell-attached patch clamp recordings confirmed that perisomatic Ih was increased in dorsal CA1 neurons following CUS. Furthermore, when dorsal CA1 Ih was reduced by shRNA-HCN1, the CUS-induced behavioral deficits were prevented. Finally, rats infused in the dorsal CA1 region with thapsigargin, an irreversible inhibitor of the SERCA pump, exhibited anxiogenic-like behaviors and increased Ih, similar to that observed following CUS. Our results suggest that CUS, but not acute stress, leads to an increase in perisomatic Ih in dorsal CA1 neurons and that HCN channels represent a potential target for the treatment of major depressive disorder.


Conflict of interest statement

The authors declare no conflict of interest.

Figures

Figure 1
Figure 1
CUS increased HCN1 protein expression in dorsal but not in ventral CA1 region. (a) Timeline of chronic unpredictable stress, behavioral tests, and electrophysiology. (b) Rats subjected to chronic unpredictable stress gained less body weight than those from control rats. (c) On day 17, CUS-treated rats showed significantly decreased body weight compared to those from control rats. (d) Representative video tracking images during the last 5 min of open field test of age-matched individual rats—control vs CUS-treated rats. CUS-treated rats showed decreases in line crossing (e) and center square entries (f). (g and h) CUS-treated rats displayed decreased sucrose preference (i.e., anhedonic-like effect) and increased passive activity time (i.e., behavioral despair-like effect). (i) Representative bands from western blotting of control and CUS groups. (j) Mature BDNF (mBDNF) protein expression was normalized to β-tubulin. mBDNF protein expression was significantly decreased in CUS group compared to control group. (k and m) Representative dorsal and ventral hippocampal slices immunolabeled with antibody against HCN1. Yellow boxes depict the region of the slice used for quantification of the optical density. (l and m) Quantification of HCN1 protein expression from perisomatic to distal dendritic region of CA1 in dorsal and ventral hippocampus. Data are expressed as mean±s.e.m. with significance indicated by *P<0.05, compared with control group. BDNF, brain-derived neurotrophic factor; CUS, chronic unpredictable stress.
Figure 2
Figure 2
Upregulation of Ih-related electrophysiological measurements in dorsal CA1 neurons following CUS (a) Representative voltage responses with step current injections at a common membrane potential (−73 mV; 750 ms). (b) Input resistance (Rin) at -73 mV was significantly reduced in dorsal CA1 neurons following CUS. (c) Representative voltage responses with depolarizing current step (270 pA; 750 ms) at resting membrane potential. (d) CUS led to a decrease in action potential firing in dorsal CA1 neurons compared to control group. (e) Representative voltage traces and current injections at −73 mV. (f) The profile of impedance amplitude for voltage traces in e. Vertical lines indicate the resonance frequencies. (g) Resonance frequency was significantly increased in dorsal CA1 neurons following CUS. (h) Representative voltage responses with step current injections at common membrane potential (−73 mV; 750 ms). (i) Bath application of 10 μm ZD7288 showed similar changes in Rin in dorsal CA1 neurons from control and CUS groups. (j) Ih was measured by stepping from a holding potential of −30 mV to −140 mV for 500 ms. (k) Ih was significantly increased in CUS group compared to control group. Data are expressed as mean±s.e.m. with significance indicated by *P<0.05, compared with control group. CUS, chronic unpredictable stress.
Figure 3
Figure 3
Upregulation of perisomatic but not dendritic Ih in dorsal CA1 neurons correlated with the time course of CUS. (a) Timeline of the experimental procedure. (b) Body weight changes during the time course of CUS. (c) Passive activity time gradually increased with increasing duration of CUS. Rats receiving a 4-week recovery period showed no persistent behavioral despair. (d) Rats subjected to 22–23 days CUS displayed a decreased sucrose preference (i.e., anhedonic-like effect) compared to naive rats. (e) Schematic of the somato-apical trunk depicting the somatic recordings. (f) fR was significantly increased from 9–10 days CUS to 20–21 days CUS compared to naive group at each membrane potential. This CUS-induced an increase in fR did not occur after a 4-week recovery period. (g) Rin was significantly decreased after 20–21 days CUS compared to naive group at each membrane potential except at −83 mV. This CUS-induced a reduction in Rin did not occur after a 4-week recovery period compared to naive group. (h) Schematic of the somato-apical trunk depicting the dendritic recordings. (I and J) fR and Rin were not significantly altered during the time course of CUS or after a 4-week recovery time. (k) Representative voltage responses with depolarizing current step (240 pA; 750 ms) at RMP. (l) Action potential firing was gradually decreased with increasing duration of CUS. This CUS-induced decrease in action potential firing did not occur after a 4-week recovery period. Data are expressed as mean±s.e.m. with significance indicated by *P<0.05, compared with naive group or 20–21 days CUS group. CUS, chronic unpredictable stress; FST, forced swim test; RMP, resting membrane potential; SPT, sucrose preference test; US, unpredictable stress.
Figure 4
Figure 4
Lentiviral-mediated knockdown of HCN1 protein expression in dorsal CA1 region/neurons led to resiliency to CUS. (a) Timeline of CUS, behavioral tests, and electrophysiology. (b) Body weight changes during CUS. (c) Representative coronal sections of the brains display the areas (CA1 region) infected by lentivirus. (d) Representative video tracking images during the last 5 min of open field test of age-matched individual rats exposed to CUS or CUS-shRNA-control or shRNA-HCN1 infusion. CUS or CUS-shRNA-control rats showed decreases in number of line crossing (e) and center square entries (f) compared to the control group. CUS-shRNA-HCN1 rats displayed increases in number of line crossing (e) and center square entries (f) compared to the CUS or CUS-shRNA-control groups. (g) CUS or CUS-shRNA-control rats showed a decreased sucrose preference (i.e., anhedonic-like effect) compared to the control group. CUS-shRNA-HCN1 rats showed an increased sucrose preference compared to the CUS or CUS-shRNA-control groups. (h) CUS or CUS-shRNA-control rats displayed an increase in passive activity (i.e., behavioral despair) compared to the control group. CUS-shRNA-HCN1 rats showed a decrease in passive activity compared to the CUS or CUS-shRNA-control groups. (I) Representative voltage responses with step current injections at −73 mV (750 ms). (j) Rin was significantly reduced in the CUS or CUS-shRNA-control groups compared to the control group. When HCN1 protein was reduced, Rin was significantly increased compared to the CUS or CUS-shRNA-control groups. (k) Representative voltage traces and current injections at −73 mV. (l) The profile of impedance amplitude for voltage traces in k. Vertical lines indicate the resonance frequencies. (m) Resonance frequency was significantly increased in the CUS or CUS-shRNA-control groups compared to the control group. CUS-induced an increase in fR, which was significantly decreased by shRNA-HCN1 compared to the CUS or CUS-shRNA-control groups. Data are expressed as mean±s.e.m. with significance indicated by *P<0.05, compared with control group or CUS-shRNA-HCN1 group. CUS, chronic unpredictable stress.
Figure 5
Figure 5
In vivo block of SERCA pumps in dorsal CA1 region/neurons produced an anxiogenic-like behavior and increased Ih. (a) Timeline of thapsigargin experiment. (b) Representative coronal sections of the brains display the location of the infusion needle track within the dorsal hippocampus of CA1. (c) Representative video tracking images during the 10 min of open field test of age-matched individual rats with vehicle or thapsigargin infusion. Rats bilaterally infused with 1 μm thapsigargin showed a decreased locomotor activity (d) and lowered center square entries (e) compared to the vehicle-treated group. (f) Representative voltage responses with step current injections at −73 mV (750 ms). (g) TG-treated dorsal CA1 neurons had a decreased Rin compared to vehicle-treated group. (h) Representative voltage traces and current injections at −73 mV. (i) The profile of impedance amplitude for voltage traces in (h). Vertical lines indicate the resonance frequencies. (j) TG-treated dorsal CA1 neurons showed an increased fR compared to vehicle-treated group. (k) Representative voltage traces and current injections at different membrane potential (ranging from −68 mV to −83 mV; −5 mV interval). (l) The profile of impedance amplitude for voltage traces in (k). TG-treated dorsal CA1 neurons displayed a lowered Rin (k and m) and a higher fR (k and n) compared to vehicle-treated group. Data are expressed as mean±s.e.m. with significance indicated by *P<0.05, compared with vehicle-treated group. OFT, open field test; TG, thapsigargin.

Comment in

  • A Possible Link Between HCN Channels and Depression.
    Kim CS, Johnston D. Kim CS, et al. Chronic Stress (Thousand Oaks). 2018 Jan-Dec;2:2470547018787781. doi: 10.1177/2470547018787781. Epub 2018 Jul 24. Chronic Stress (Thousand Oaks). 2018. PMID: 30259006 Free PMC article.

Similar articles

Cited by

References

    1. Campbell S, Marriott M, Nahmias C, MacQueen GM. Lower hippocampal volume in patients suffering from depression: a meta-analysis. Am J Psychiatry 2004; 161: 598–607. - PubMed
    1. Kennedy SH, Evans KR, Kruger S, Mayberg HS, Meyer JH, McCann S et al. Changes in regional brain glucose metabolism measured with positron emission tomography after paroxetine treatment of major depression. Am J Psychiatry 2001; 158: 899–905. - PubMed
    1. Mayberg HS, Brannan SK, Tekell JL, Silva JA, Mahurin RK, McGinnis S et al. Regional metabolic effects of fluoxetine in major depression: serial changes and relationship to clinical response. Biol Psychiatry 2000; 48: 830–843. - PubMed
    1. Santarelli L, Saxe M, Gross C, Surget A, Battaglia F, Dulawa S et al. Requirement of hippocampal neurogenesis for the behavioral effects of antidepressants. Science 2003; 301: 805–809. - PubMed
    1. Nestler EJ, Barrot M, DiLeone RJ, Eisch AJ, Gold SJ, Monteggia LM. Neurobiology of depression. Neuron 2002; 34: 13–25. - PubMed

Publication types

MeSH terms

Substances