. 2017 Apr 14:9:38.
doi: 10.1186/s13148-017-0335-5. eCollection 2017.

DNA methylation profiling in peripheral lung tissues of smokers and patients with COPD

Affiliations

DNA methylation profiling in peripheral lung tissues of smokers and patients with COPD

Isaac K Sundar et al. Clin Epigenetics. .

Abstract

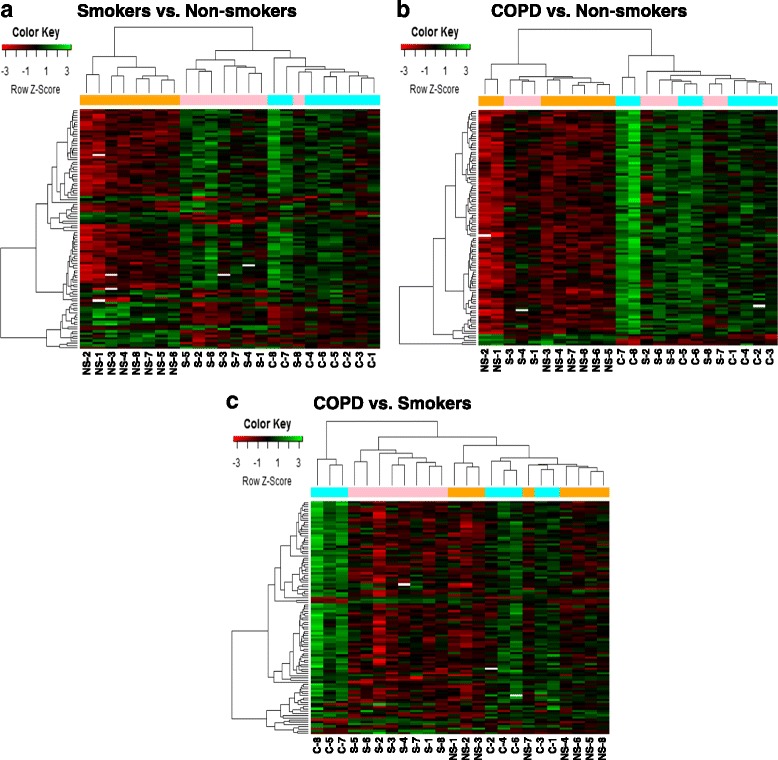
Background: Epigenetics changes have been shown to be affected by cigarette smoking. Cigarette smoke (CS)-mediated DNA methylation can potentially affect several cellular and pathophysiological processes, acute exacerbations, and comorbidity in the lungs of patients with chronic obstructive pulmonary disease (COPD). We sought to determine whether genome-wide lung DNA methylation profiles of smokers and patients with COPD were significantly different from non-smokers. We isolated DNA from parenchymal lung tissues of patients including eight lifelong non-smokers, eight current smokers, and eight patients with COPD and analyzed the samples using Illumina's Infinium HumanMethylation450 BeadChip.

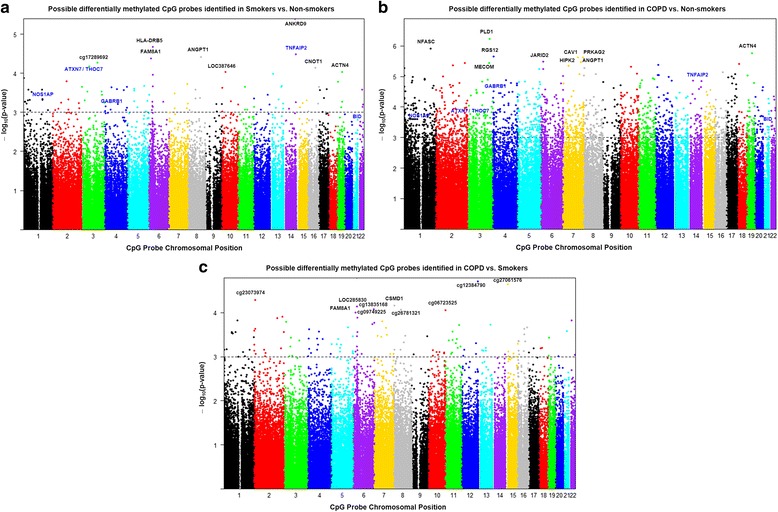
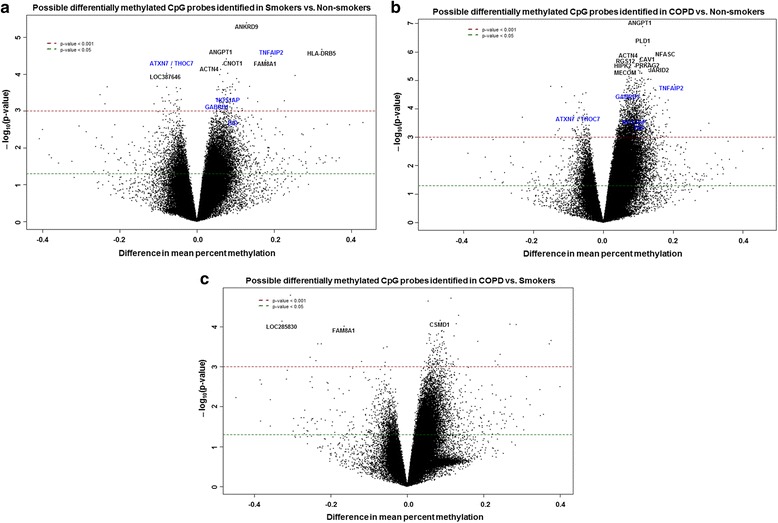
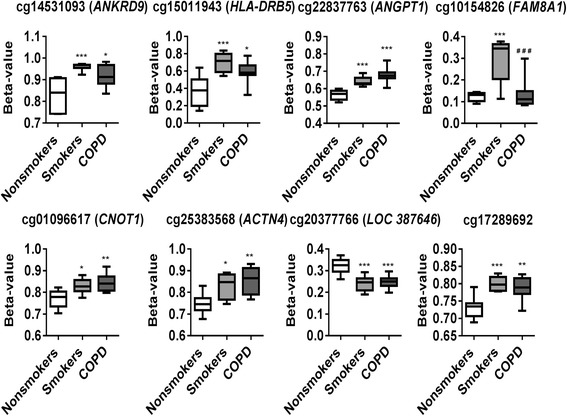
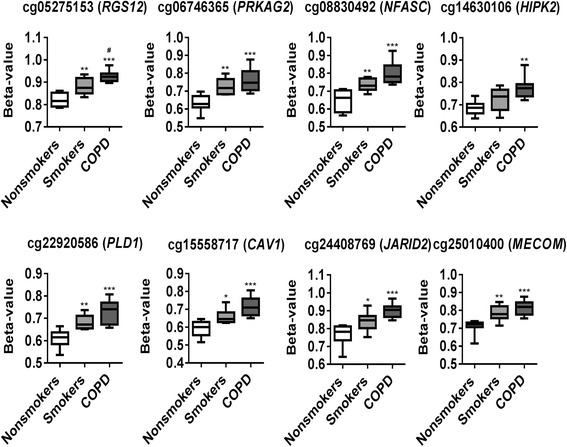
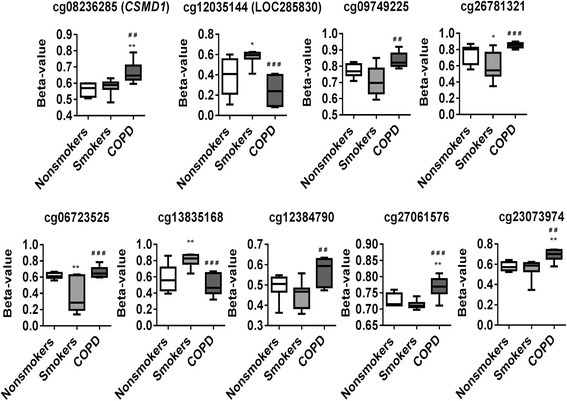
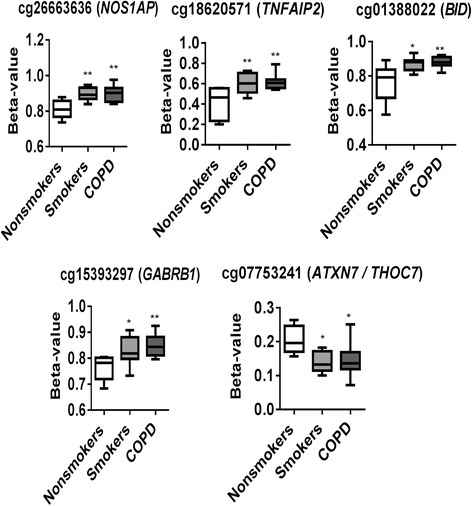
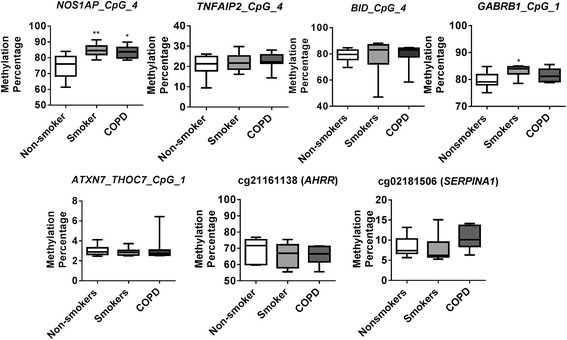
Results: Our data revealed that the differentially methylated genes were related to top canonical pathways (e.g., G beta gamma signaling, mechanisms of cancer, and nNOS signaling in neurons), disease and disorders (organismal injury and abnormalities, cancer, and respiratory disease), and molecular and cellular functions (cell death and survival, cellular assembly and organization, cellular function and maintenance) in patients with COPD. The genome-wide DNA methylation analysis identified suggestive genes, such as NOS1AP, TNFAIP2, BID, GABRB1, ATXN7, and THOC7 with DNA methylation changes in COPD lung tissues that were further validated by pyrosequencing. Pyrosequencing validation confirmed hyper-methylation in smokers and patients with COPD as compared to non-smokers. However, we did not detect significant differences in DNA methylation for TNFAIP2, ATXN7, and THOC7 genes in smokers and COPD groups despite the changes observed in the genome-wide analysis.

Conclusions: Our study suggests that DNA methylation in suggestive genes, such as NOS1AP, BID, and GABRB1 may be used as epigenetic signatures in smokers and patients with COPD if the same is validated in a larger cohort. Future studies are required to correlate DNA methylation status with transcriptomics of selective genes identified in this study and elucidate their role and involvement in the progression of COPD and its exacerbations.

Keywords: COPD; DNA methylation; Epigenetics; Lung; Pyrosequencing; Smokers.


Figures

Fig. 1
Fig. 1
Manhattan plots showing distribution of possible differentially methylated CpG sites identified in this study across chromosomes. a Differential methylation analysis between smokers and non-smokers presented by chromosomal location (x axis). b Differential methylation analysis between COPD and non-smokers presented by chromosomal location (x axis). c Differential methylation analysis between COPD and smokers presented by chromosomal location (x axis). The y axis represents the negative log P value of their association. The genes marked in blue color are the once validated by pyrosequencing analysis. The black dotted horizontal line indicates the genome-wide significance threshold of P < 0.001. The top candidates in each pairwise comparison were selected by test statistics and unadjusted P values for comparisons (P < 0.001 is commonly used as a cutoff for relatively small unadjusted raw P value)
Fig. 2
Fig. 2
Volcano plots showing possible differentially methylated CpG sites identified in this study. a Differential methylation analysis revealed top 10 CpG sites and their genes significantly associated with smokers with P < 0.001. Difference in mean percent methylation represents the difference in mean methylation between smokers vs. non-smokers (control). b Differential methylation analysis revealed top 10 CpG sites and their genes significantly associated with COPD with P < 0.001. Difference in mean percent methylation represents the difference in mean methylation between COPD vs. non-smokers (control). c Differential methylation analysis revealed CpG sites and their genes significantly associated with COPD compared to smokers with P < 0.001. Difference in mean percent methylation represents the difference in mean methylation between COPD vs. smokers (control). The y axis represents the negative log P value of their association. The genes marked in blue color are the once validated by pyrosequencing analysis. The red and green dotted horizontal lines indicate the genome-wide significance threshold of P < 0.001 and P < 0.05, respectively. The top candidates in each pairwise comparison were selected by test statistics and unadjusted P values for comparisons (P < 0.001 is commonly used as a cutoff for relatively small unadjusted raw P value)
Fig. 3
Fig. 3
Hierarchical cluster analysis of differentially methylated CpG sites identified in this study. a Heatmap of top 100 differentially methylated CpG sites in smokers vs. non-smokers group. b Heatmap of top 100 differentially methylated CpG sites in COPD vs. non-smokers group. c Heatmap of top 100 differentially methylated CpG sites in COPD vs. smokers group. Additionally for cluster analysis, we have also included the five genes that were chosen for validation for pyrosequencing along with the top 100 genes. The green color in the heatmap denotes hyper-methylated loci, and the red color in the heatmap denotes the hypo-methylated loci. Target id and gene list for the top 100 differentially methylated probes (ac) are included in the Additional file 11: Table S10, Additional file 12: Table S11 and Additional file 13: Table S12
Fig. 4
Fig. 4
Differentially methylated CpG sites associated with smokers. Differential methylation analysis revealed CpG sites in genes significantly associated with smokers with a P value less than 0.05. Difference in mean beta values represents the difference in mean methylation between smokers and non-smokers (controls). The y axis represents the beta value. The gene symbol associated with CpG probes are provided in parenthesis. Data are represented as a box plot which displays the full range of variation (from min to max), the likely range of variation (the IQR) and a typical value (the median) for n = 8/group, and the significance determined using one-way ANOVA (Tukey’s multiple comparisons test). *P < 0.05, **P < 0.01, ***P < 0.001, vs. non-smokers; ### P < 0.001 vs. smokers
Fig. 5
Fig. 5
Differentially methylated CpG sites associated with COPD. Differential methylation analysis revealed CpG sites in genes significantly associated with COPD with a P value less than 0.05. Difference in mean beta values represents the difference in mean methylation between COPD and non-smokers (controls). The y axis represents the beta value. The gene symbol associated with CpG probes are provided in parenthesis. Data are represented as a box plot which displays the full range of variation (from min to max), the likely range of variation (the IQR) and a typical value (the median) for n = 8/group, and the significance determined using one-way ANOVA (Tukey’s multiple comparisons test). *P < 0.05, **P < 0.01, ***P < 0.001, vs. non-smokers; # P < 0.05 vs. smokers
Fig. 6
Fig. 6
Differentially methylated CpG sites associated with COPD vs. smokers. Differential methylation analysis revealed CpG sites in genes significantly associated with smokers vs. COPD with a P value less than 0.05. Difference in mean beta values represents the difference in mean methylation between smokers and COPD. The y axis represents the beta value. The gene symbol associated with CpG probes are provided in parenthesis. Data are represented as a box plot which displays the full range of variation (from min to max), the likely range of variation (the IQR) and a typical value (the median) for n = 8/group, and the significance determined using one-way ANOVA (Tukey’s multiple comparisons test). *P < 0.05, **P < 0.01, vs. non-smokers; ## P < 0.01, ### P < 0.001 vs. smokers
Fig. 7
Fig. 7
Differentially methylated CpG sites identified from genome-wide methylation profiling for pyrosequencing validation. Differential methylation analysis revealed CpG sites in genes significantly associated with smokers and COPD compared to non-smokers with a P value less than 0.05. Difference in mean beta values represents the difference in mean methylation between smokers and COPD compared to non-smokers (controls). The y axis represents the beta value. The gene symbol associated with CpG probes are provided in parenthesis. Data are represented as a box plot which displays the full range of variation (from min to max), the likely range of variation (the IQR) and a typical value (the median) for n = 8/group, and the significance determined using one-way ANOVA (Tukey’s multiple comparisons test). *P < 0.05, **P < 0.01, vs. non-smokers
Fig. 8
Fig. 8
Pyrosequencing validation of CpG sites identified in genome-wide DNA methylation analysis. NOS1AP locus cg2663636, TNFAIP2 locus cg18620571, BID locus cg01388022, GABRB1 locus cg15393297, and ATXN7 and THOC7 locus cg07753241 were validated along with AHRR locus cg21161138 and SERPINA1 locus cg02181506. Boxplots represent pyrosequencing methylation percentages between smokers and COPD compared to non-smokers control. Data are represented as box plot which displays the full range of variation (from min to max), the likely range of variation (the IQR) and a typical value (the median) for n = 8/group, and the significance determined using one-way ANOVA (Tukey’s multiple comparisons test). *P < 0.05, **P < 0.01, vs. non-smokers

Similar articles

Cited by

References

    1. Yao H, Rahman I. Current concepts on oxidative/carbonyl stress, inflammation and epigenetics in pathogenesis of chronic obstructive pulmonary disease. Toxicol Appl Pharmacol. 2011;254:72–85. doi: 10.1016/j.taap.2009.10.022. - DOI - PMC - PubMed
    1. Sundar IK, Mullapudi N, Yao H, Spivack SD, Rahman I. Lung cancer and its association with chronic obstructive pulmonary disease: update on nexus of epigenetics. Curr Opin Pulm Med. 2011;17:279–285. doi: 10.1097/MCP.0b013e3283477533. - DOI - PMC - PubMed
    1. Sundar IK, Yao H, Rahman I. Oxidative stress and chromatin remodeling in chronic obstructive pulmonary disease and smoking-related diseases. Antioxid Redox Signal. 2013;18:1956–1971. doi: 10.1089/ars.2012.4863. - DOI - PMC - PubMed
    1. Morrow JD, Cho MH, Hersh CP, Pinto-Plata V, Celli B, Marchetti N, Criner G, Bueno R, Washko G, Glass K, et al. DNA methylation profiling in human lung tissue identifies genes associated with COPD. Epigenetics. 2016;11:730-39. - PMC - PubMed
    1. Cheng L, Liu J, Li B, Liu S, Li X, Tu H. Cigarette smoke-induced hypermethylation of the GCLC gene is associated with COPD. Chest. 2016;149:474–482. doi: 10.1378/chest.14-2309. - DOI - PubMed

Publication types

Substances