. 2016 Aug;1(2):aaf8943.
doi: 10.1126/sciimmunol.aaf8943. Epub 2016 Aug 5.

Lectin-type oxidized LDL receptor-1 distinguishes population of human polymorphonuclear myeloid-derived suppressor cells in cancer patients

Affiliations

Lectin-type oxidized LDL receptor-1 distinguishes population of human polymorphonuclear myeloid-derived suppressor cells in cancer patients

Thomas Condamine et al. Sci Immunol. 2016 Aug.

Abstract

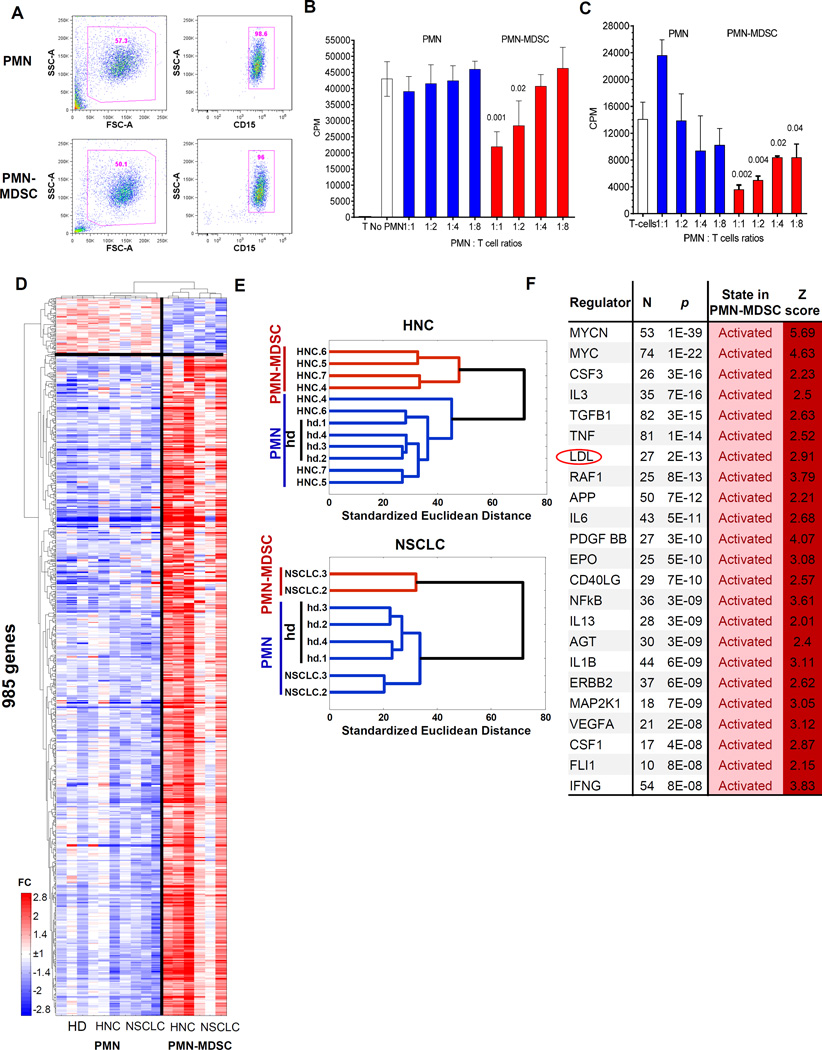
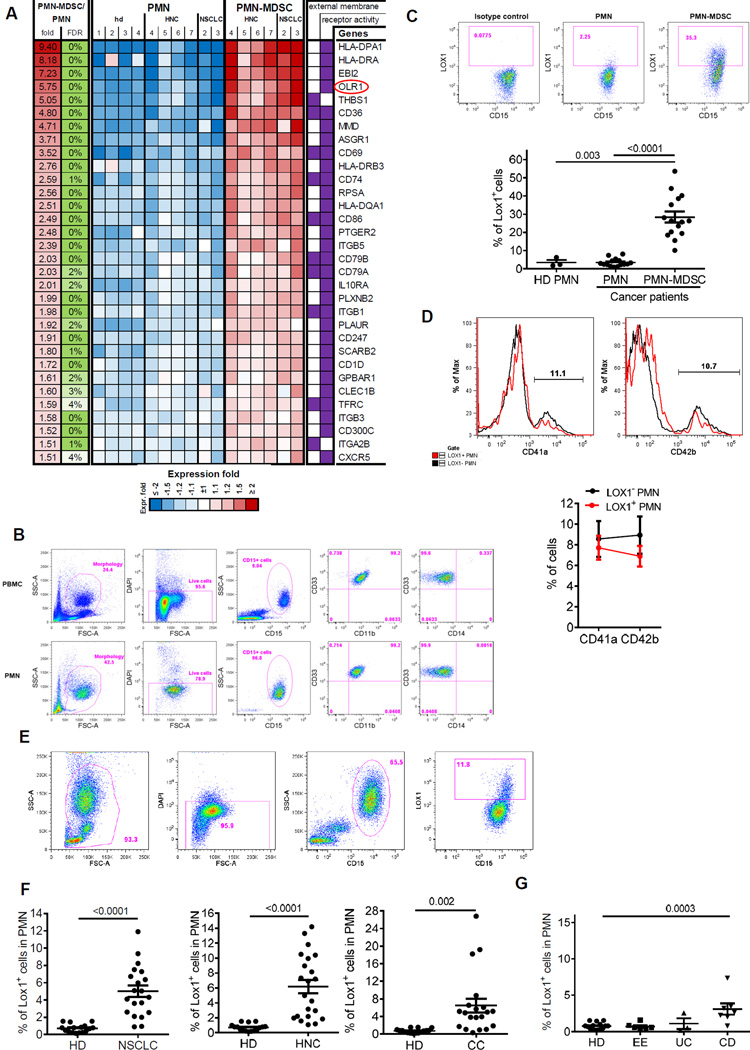
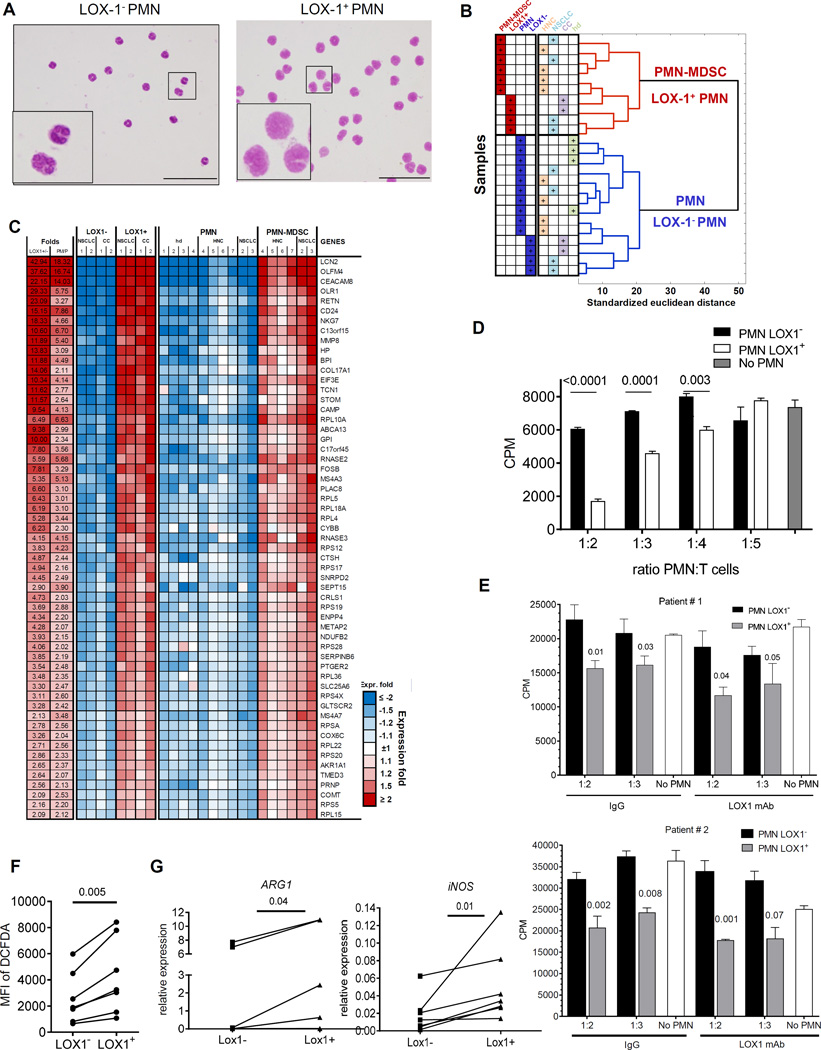
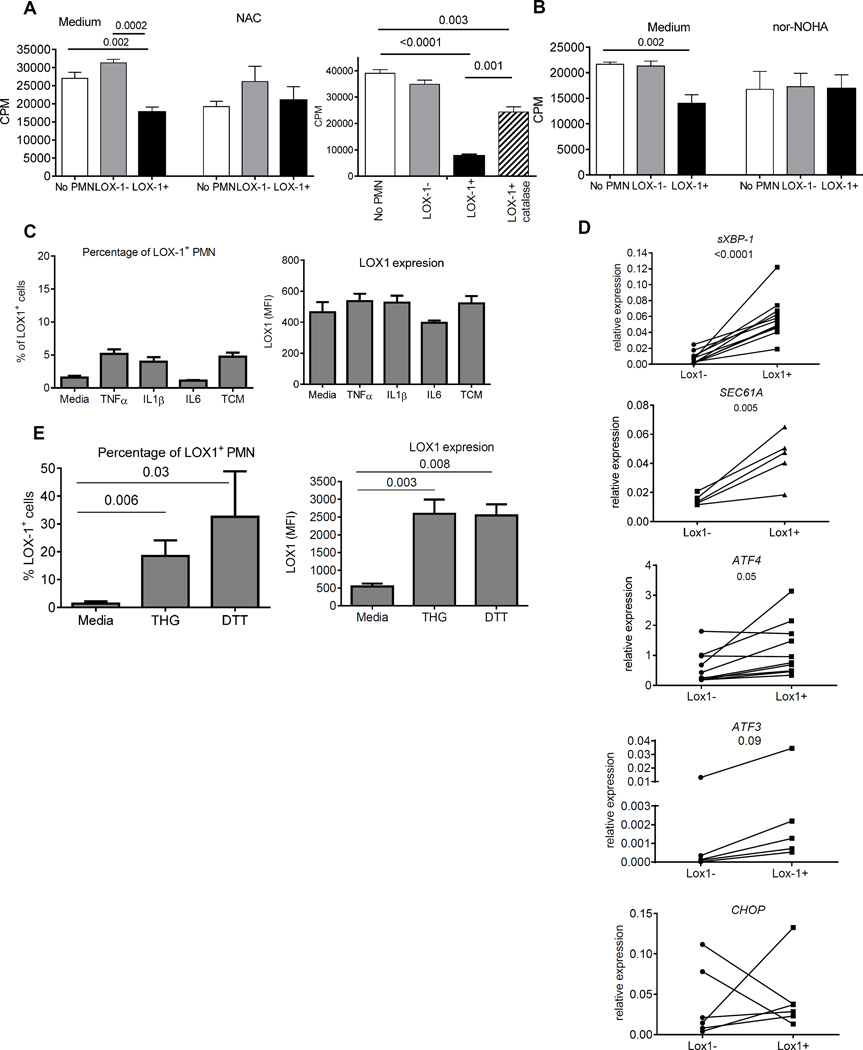
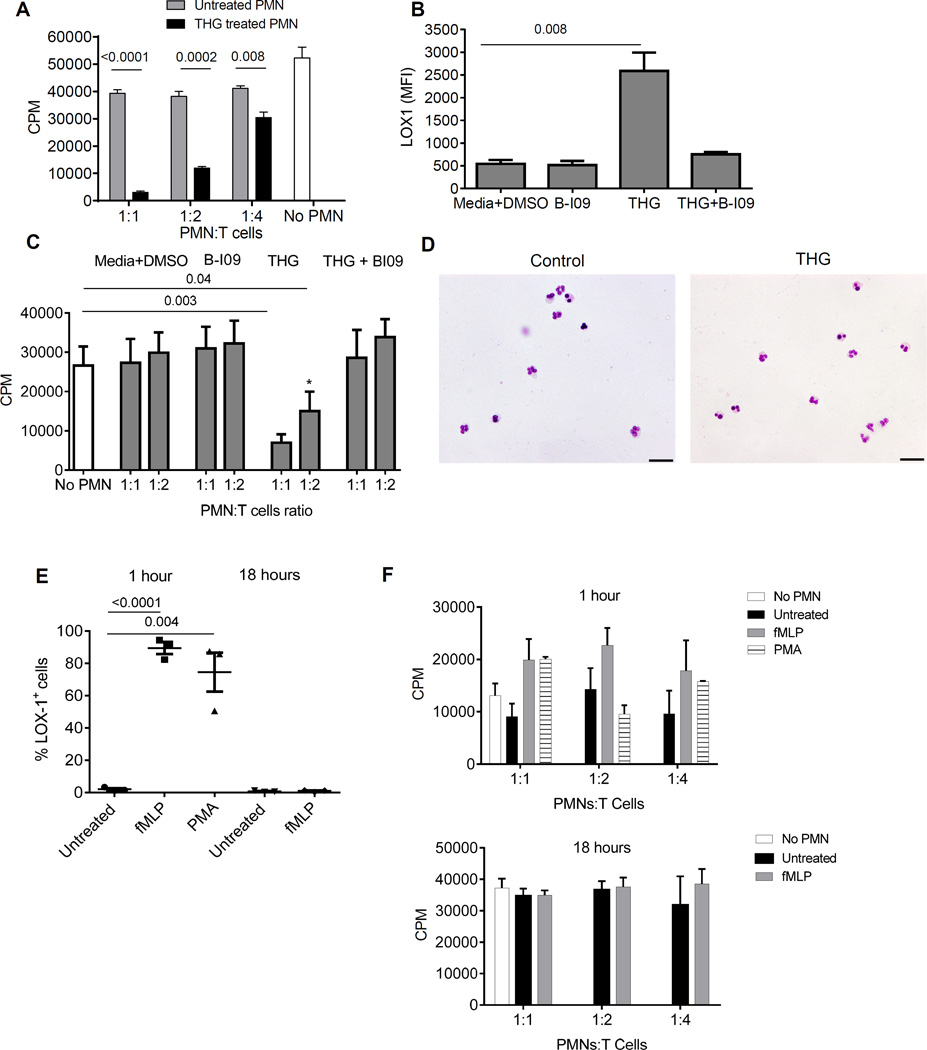
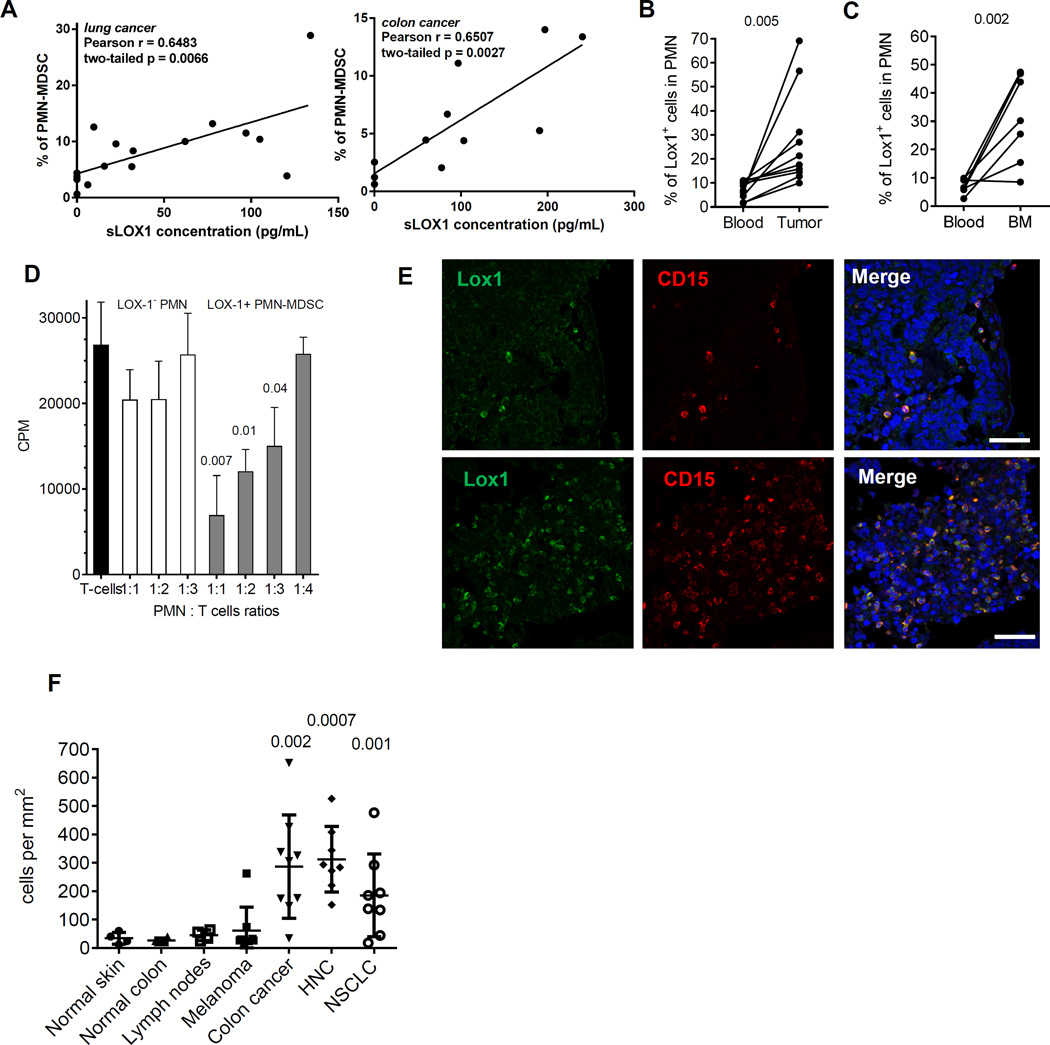
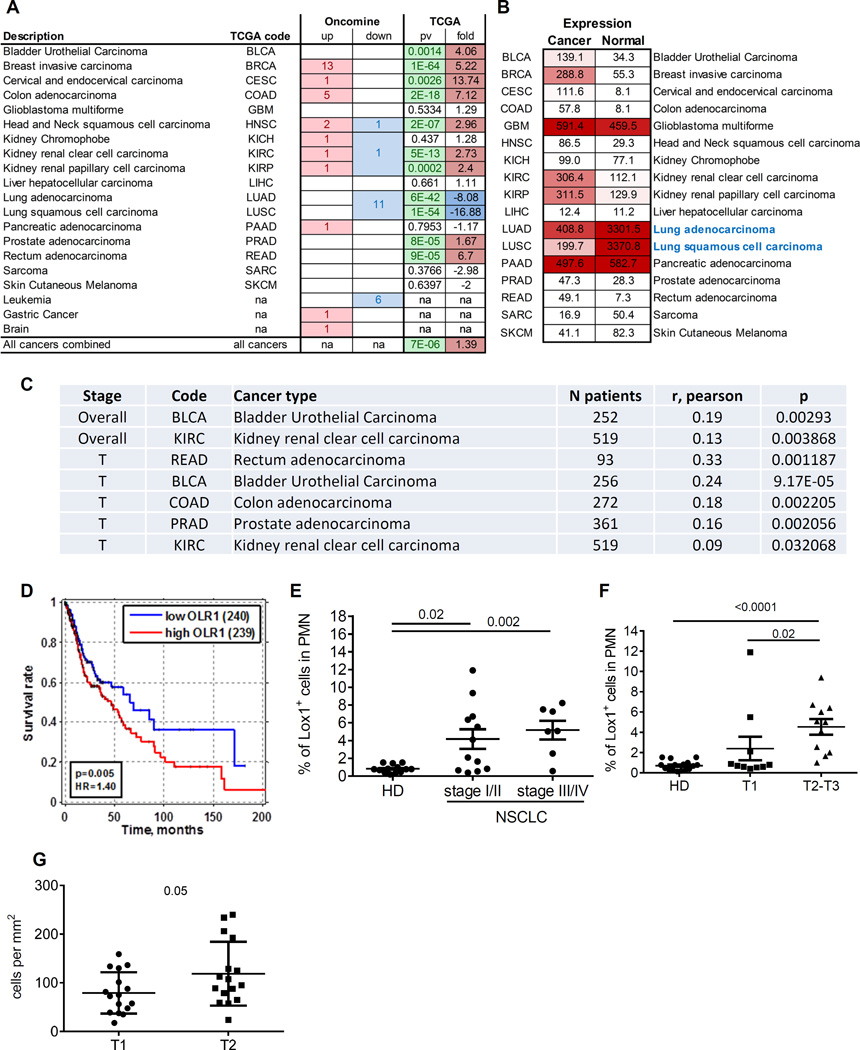
Polymorphonuclear myeloid-derived suppressor cells (PMN-MDSC) are important regulators of immune responses in cancer and have been directly implicated in promotion of tumor progression. However, the heterogeneity of these cells and lack of distinct markers hampers the progress in understanding of the biology and clinical importance of these cells. Using partial enrichment of PMN-MDSC with gradient centrifugation we determined that low density PMN-MDSC and high density neutrophils from the same cancer patients had a distinct gene profile. Most prominent changes were observed in the expression of genes associated with endoplasmic reticulum (ER) stress. Surprisingly, low-density lipoprotein (LDL) was one of the most increased regulators and its receptor oxidized LDL receptor 1 OLR1 was one of the most overexpressed genes in PMN-MDSC. Lectin-type oxidized LDL receptor 1 (LOX-1) encoded by OLR1 was practically undetectable in neutrophils in peripheral blood of healthy donors, whereas 5-15% of total neutrophils in cancer patients and 15-50% of neutrophils in tumor tissues were LOX-1+. In contrast to their LOX-1- counterparts, LOX-1+ neutrophils had gene signature, potent immune suppressive activity, up-regulation of ER stress, and other biochemical characteristics of PMN-MDSC. Moreover, induction of ER stress in neutrophils from healthy donors up-regulated LOX-1 expression and converted these cells to suppressive PMN-MDSC. Thus, we identified a specific marker of human PMN-MDSC associated with ER stress and lipid metabolism, which provides new insight to the biology and potential therapeutic targeting of these cells.


Figures

Figure 1
Figure 1. PMN-MDSC have distinct genomic signature
A. Typical phenotype of PMN-MDSC and PMN isolated from peripheral blood of cancer patients using gradient centrifugation and CD15 beads; B. Suppression assay of PMN and PMN-MDSC isolated from the same patient with HNC. Allogeneic mixed leukocyte reaction was performed as described in Methods. Cell proliferation was evaluated in triplicates using 3H-thymidine uptake. Mean and SD are shown. p values are calculated in t-test from control – T cell proliferation without the presence of PMN or PMN-MDSC and shown on the graph, n=3 different patients. C. Suppression assay of PMN and PMN-MDSC isolated from the same patient with NSCLC. T-cell proliferation in response to CD3/CD28 was performed as described in Methods. Cell proliferation was evaluated in triplicates using 3H-thymidine uptake. Mean and SD are shown. p values are calculated in t-test from control – T cell proliferation without the presence of PMN or PMN-MDSC and shown on the graph, n=3 different patients. D. Relative expression heatmap and gene/sample clustering based on expression of 985 genes significantly differentially expressed (p<0.05, fold>2) between cancer patients’ PMN, PMN-MDSCs and PMN of healthy donors. E. Hierarchical clustering of PMN-MDSCs from HNC and NSCLC cancer patients indicates gene expression signature specific to PMN-MDSCs and similarities of PMN from cancer patients and PMN from healthy donors. F. Upstream Regulators identified by Ingenuity Pathway Analysis (IPA) among genes significantly differentially expressed between PMN-MDSC and PMN cells. N=number of genes from the category, Z=z-score of predicted activation state calculated by IPA.
Figure 2
Figure 2. LOX-1 as a marker of PMN-MDSC
A. List and a heatmap of relative expression of candidate surface markers specific to the PMN-MDSCs. B. Typical phenotype of high density PMN and low density PMN-MDSC in cancer patient. C. Proportion of LOX-1 positive PMN and PMN-MDSC in peripheral blood of 15 cancer patients. Top panel - example of staining of PMN-MDSC and PMN with LOX-1 antibody. Cells were isolated using density gradient as described in Methods and the proportion of LOX-1+ cells was calculated among CD15+ cells. Bottom panel - individual results for each patient are shown as well as Mean and SE. p values (t-test) are shown. D. Example of staining with CD41a and CD42b antibody (top panel). Cumulative results of 7 patients with NSCLC (bottom panel). Mean and SD are shown. E. Typical example of the analysis of PMN in cancer patient. F. Proportion of LOX-1+ cells among PMN in unseparated PB from 16 healthy donors (HD), 20 patients with NSCLC, 21 patients with HNC, and 19 patients with CC. p values in t-test are shown. G. Proportion of LOX-1+ cells among PMN in unseparated PB from 16 healthy donors (HD), 6 patients with eosinophilic colitis (EE), 3 patients with ulcerative colitis (UC), and 7 patients with Crohn’s Disease (CD). p values in t-test are shown.
Figure 3
Figure 3. LOX-1 expression defines bona-fide PMN-MDSC
A. Typical morphology of sorted LOX-1+ and Lox-1 PMN from patient with HNC. Scale bar = 20 µm. B. Hierarchical clustering of samples based on expression levels of genes differentially expressed between LOX-1+ and LOX-1 PMN. C. List and relative expression values of the most changed known genes overlapped between LOX-1+ and PMN-MDSC cells. D. Suppressive activity of LOX-1+ and LOX-1 PMN isolated from peripheral blood of patient with HNC in allogeneic MLR. Cell proliferation was evaluated in triplicates using 3H-thymidine uptake. Mean and SE are shown. p values in t-test from T cell proliferation without the presence of PMN are shown. Experiments with similar results were performed with samples from 9 patients with HNC and NSCLC. E. Effect of neutralizing LOX-1 antibody on suppressive activity of LOX-1+ PMN. PMN were isolated from two patients with NSCLC. LOX-1+ and LOX-1 PMN were isolated as described in Material and Methods and then added to allogeneic MLR in the presence of 10 µg/ml neutralizing mouse anti-human LOX-1 antibody or mouse IgG. Cell proliferation was evaluated in triplicates using 3H-thymidine uptake. Mean and SE are shown. p values in t-test from T cell proliferation without the presence of PMN are shown. F. ROS production in LOX-1+ and LOX-1 PMN from 7 patients with HNC and NSCLC. ROS production was measured by staining with DCFDA. G. Expression of ARG1 and NOS2 in LOX-1+ and LOX-1 PMN from 6 patients with HNC and MM measured by qPCR. P values in t-test are shown.
Figure 4
Figure 4. Mechanism regulating LOX-1 expression on PMN-MDSC
A.B. Effect of 1 µM of N-acetyl L-cysteine (NAC) (left panel), 1000 U/ml of catalase (right panel) (A) and 20 µM Nor-NOHA (B) on immune suppressive activity of LOX-1+ PMN-MDSC. Allogeneic MLR was used in all experiments. Cell proliferation was measured in triplicates by 3H-thymidine incorporation. 1:2 PMN : T cell ratio was used in all experiments. Three experiments with similar results were performed. P values in t-test are shown. C. Percentage of LOX-1+ PMN and expression of LOX-1 in PMN isolated from 4 healthy donors and treated with indicated cytokines. Range of concentrations based on reported data were tested and only one for each cytokine is shown. Conditioned medium from PCI30 tumor cells (TCM) was used at 20% v/v concentration. Mean and SD are shown. D. Expression of genes involved in ER stress response in PMN from 8 patients with HNC and NSCLC. P values in t-test (for ATF3 in Munn-Whitney test) are shown. E. Percentage of LOX-1+ PMN and expression of LOX-1 in PMN isolated from 4 healthy donors and treated with 1µM THG and 1 mM DTT. Mean and SD are shown. P values calculated in t-test.
Figure 5
Figure 5. ER stress induce LOX-1 expression and suppressive activity in PMN
A. ER stress inducer THG converted PMN to PMN-MDSC. PMN isolated from healthy donors were treated overnight with 1µM THG, extensively washed and then used in CD3/CD28 induced T-cell proliferaiton. T cell proliferation was measured in triplicates by 3H-thymidine uptake. Three experiments with similar results were performed. P values in t-test are shown, n=3. B,C. sXBP1 inhibitor B-IO9 abrogated THG inducible up-regulation of LOX-1 and T cells suppression in PMN from healthy donors. PMN were incubated together with 20 µM B-IO9 and THG overnight followed by evaluation of LOX-1 expression (B) or suppression activity (C). PMN from three healthy donors were used in these experiments. P values between treated and untreated PMN (t-test, n=3). D. Morphology of heathy donor’s PMN after 18 hr incubation with 10 ng/ml GM-CSF and THG. Giemsa stain. Scale bar = 20 µm. E. Healthy donor’s PMN were cultured for 1 hr or 18 hrs with 10 nM fMLP or 20 nM PMA in the presence of 10 ng/ml GM-CSF. The proportion of LOX-1+ cells was evaluated. P values were calculated in t-test (n=3). Analysis of PMA effect after 18 hrs was not performed because of undetectable number of viable cells. F. PMN treated with fMLP or PMA as described in Fig. 5E were extensively washed after 1 hr or 18 hr (fMLP only) incubation and tested in T-cell suppression assay. Each experiment was performed in triplicates. Three donors were tested.
Figure 6
Figure 6. LOX-1+ PMN-MDSC in tumor tissues
A. Correlation of soluble LOX1 in plasma of NSCLC and HNC with the presence of PMN-MDSC in PBMC fraction of PB. B. Presence of LOX-1+ PMN in PB and tumor tissues of 10 patients with HNC and NSCLC. P values are calculated in t-test. C. Presence of LOX-1+ PMN in PB and BM of 7 patients with MM. P values are calculated in t-test. D. Suppressive activity of LOX-1+ PMN in BM of patient with MM tested in allogeneic MLR. P (in t-test) from values without the presence of PMN are shown. Three patients were tested with the same results. E. Typical staining of tumor tissues. Scale bar = 100µm. F. LOX-1+ PMN in tissues from 4 normal skin samples, 4 samples of tumor-free lymph nodes, 4 samples of normal colon, as well as tumor tissues from 8 patients with melanoma, 8 patients with HNC patients, 8 patients with NSCLC, and 9 patients with CC. Mean and SD shown. P values calculated in t-test show difference between tumor samples and samples from control tissues.
Figure 7
Figure 7. Clinical association of OLR1 expression and LOX-1+ PMN-MDSC accumulation in cancer patients
A. Number of independent data sets from Oncomine database that showed OLR1 upregulated (up) or downregulated (down) in Cancer vs Normal tissues. P-value and fold change for Cancer/Normal comparison from TCGA database. na=data not available; B. Average expression values (FPKM values) for cancer and normal tissues for different cancers indicates high baseline expression level of OLR1 in normal lung tissues. C. Association of OLR1 expression with clinical stage (overall) or tumor size (T) in patients with different types of cancer. D. Kaplan-Meier survival curves for HNC squamous cell carcinoma patients survival stratified by median OLR1 expression indicates decreased survival for subjects with high OLR1 expression. p=cox-regression p value, HR=hazard ratio, E. Proportion of LOX-1+ PMN-MDSC in PB of 12 patients with stage I-II; 7 patients with stage III-IV of NSCLC, and 16 healthy donors. P values calculated in Mann-Whitney test. F. Proportion of LOX-1+ PMN-MDSC in PB of NSCLC patients segregated based on tumor size. P values calculated in Mann-Whitney test. F. Amount of LOX-1+ CD15+ PMN-MDSC in tumor tissues from NSCLC patients segregated based on tumor size. P values calculated in t-test.

References

    1. Condamine T, Ramachandran I, Youn JI, Gabrilovich DI. Regulation of tumor metastasis by myeloid-derived suppressor cells. Annu Rev Med. 2015;66:97–110. - PMC - PubMed
    1. Messmer MN, Netherby CS, Banik D, Abrams SI. Tumor-induced myeloid dysfunction and its implications for cancer immunotherapy. Cancer Immunol Immunother. 2015;64:1–13. - PMC - PubMed
    1. Finke J, Ko J, Rini B, Rayman P, Ireland J, Cohen P. MDSC as a mechanism of tumor escape from sunitinib mediated anti-angiogenic therapy. Int Immunopharmacol. 2011;11:856–861. - PMC - PubMed
    1. Feng PH, Lee KY, Chang YL, Chan YF, Kuo LW, Lin TY, Chung FT, Kuo CS, Yu CT, Lin SM, Wang CH, Chou CL, Huang CD, Kuo HP. CD14(+)S100A9(+) monocytic myeloid-derived suppressor cells and their clinical relevance in non-small cell lung cancer. American journal of respiratory and critical care medicine. 2012;186:1025–1036. - PMC - PubMed
    1. Vetsika E-K, Koinis F, Gioulbasani M, Aggouraki D, Koutoulaki A, Skalidaki E, Mavroudis D, Georgoulias V, Kotsakis A. A Circulating Subpopulation of Monocytic Myeloid-Derived Suppressor Cells as an Independent Prognostic/Predictive Factor in Untreated Non-Small Lung Cancer Patients. Journal of Immunology Research. 2014;2014:659294. - PMC - PubMed