

Healthy cortical development through adolescence and early adulthood
- PMID: 28417232
- PMCID: PMC5676813
- DOI: 10.1007/s00429-017-1424-0
Healthy cortical development through adolescence and early adulthood
Abstract
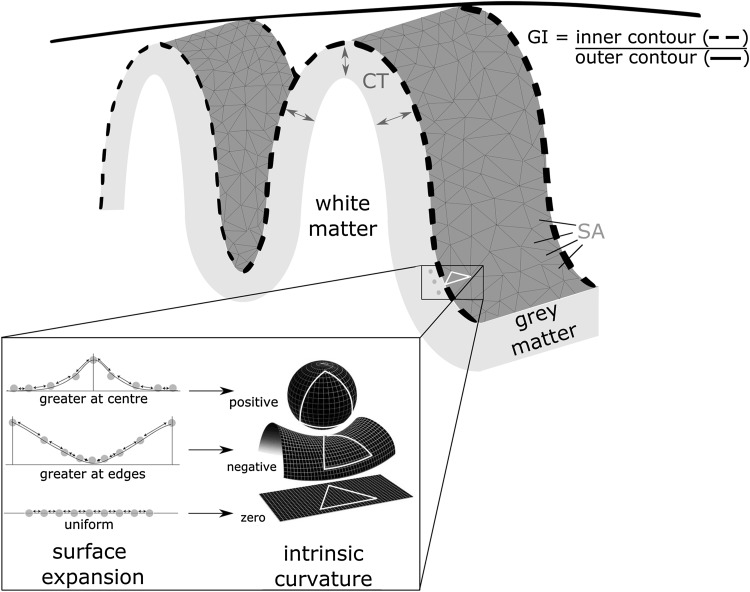
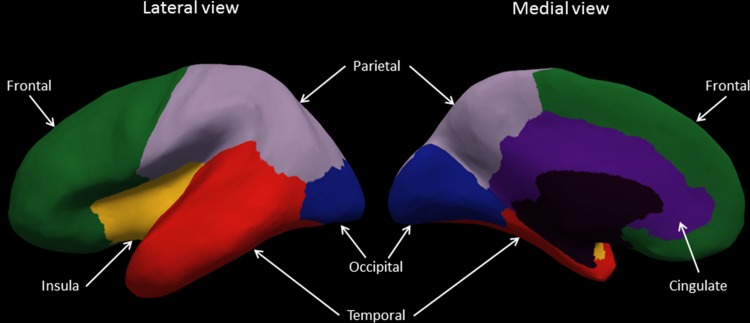
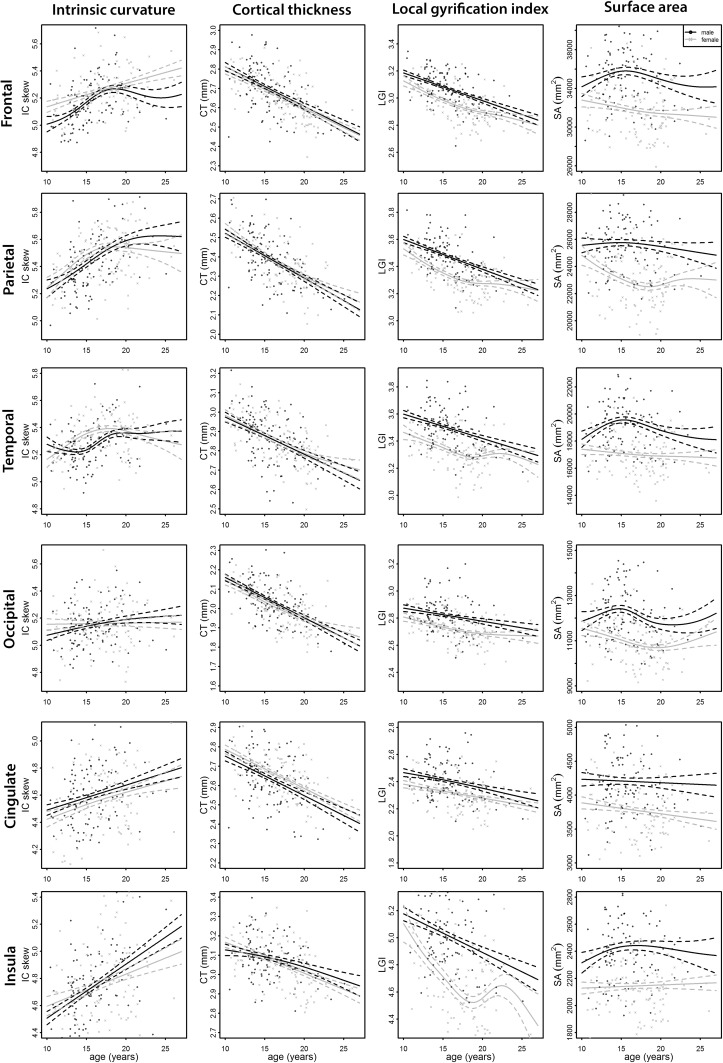
Adolescence is a period of significant brain changes; however, the effects of age and sex on cortical development are yet to be fully characterized. Here, we utilized innovative intrinsic curvature (IC) analysis, along with the traditional cortical measures [cortical thickness (CT), local gyrification index (LGI), and surface area (SA)], to investigate how these indices (1) relate to each other and (2) depend on age and sex in adolescent cortical development. T1-weighted magnetic resonance images from 218 healthy volunteers (age range 8.3-29.2 years, M[SD] = 16.5[3.4]) were collected at two sites and processed with FreeSurfer and Caret software packages. Surface indices were extracted per cortex area (frontal, parietal, occipital, temporal, insula, and cingulate). Correlation analyses between the surface indices were conducted and age curves were modelled using generalized additive mixed-effect models. IC showed region-specific associations with LGI, SA, and CT, as did CT with LGI. SA was positively associated with LGI in all regions and CT in none. CT and LGI, but not SA, were inversely associated with age in all regions. IC was inversely associated with age in all but the occipital region. For all regions, males had larger cortical SA than females. Males also had larger LGI in all regions and larger IC of the frontal area; however, these effects were accounted for by sex differences in SA. There were no age-by-sex interactions. The study of IC adds a semi-independent, sensitive measure of cortical morphology that relates to the underlying cytoarchitecture and may aid understanding of normal brain development and deviations from it.
Keywords: Cortex; Cortical thickness; Intrinsic curvature; Local gyrification index; Neuro-development; Surface area.
Conflict of interest statement
Funding
The NeuroIMAGE project was supported by the National Institute of Health (NIH) Grant R01MH62873 (to S.V. Faraone), Nederlands Wetenschappelijk Organisatie (NWO) Large Investment Grant 1750102007010 and ZonMW Grant 60-60600-97-193, and NWO grants 433-09-242 and 056-13-015 (to JKB) and grants from Radboud University Medical Center Nijmegen, University Medical Center Groningen, Accare and VU University Medical Center Amsterdam. Further funding has been received from the European Union under grant agreements number 316978 (TS-EUROTRAIN) and number 643051 (MiND). BF is supported by a Vici grant from NWO (grant number 016-130-669), and she and JKB received funding from the NIH Consortium grant U54 EB020403, supported by a cross-NIH alliance that funds Big Data to Knowledge Centers of Excellence. None of the funding sources had any influence on study design, data collection, analysis, or interpretation. Nor did they have an influence on writing or decision to publish this manuscript.
Conflict of interest
JKB has been in the past 3 years a consultant to/member of advisory board of/and/or speaker for Janssen Cilag BV, Eli Lilly, Shire, Medice, Lundbeck, Roche, and Servier. He is not an employee of any of these companies, and not a stock shareholder of any of these companies. He has no other financial or material support, including expert testimony, patents, or royalties. BF received an educational speaking fee from Merz.
Figures
References
MeSH terms
LinkOut - more resources
Full Text Sources
Other Literature Sources
Molecular Biology Databases
