. 2018 Jul;68(4):355-367.
doi: 10.1007/s12576-017-0538-8. Epub 2017 Apr 17.

Regulation of the glucose supply from capillary to tissue examined by developing a capillary model

Affiliations

Regulation of the glucose supply from capillary to tissue examined by developing a capillary model

Akitoshi Maeda et al. J Physiol Sci. 2018 Jul.

Abstract

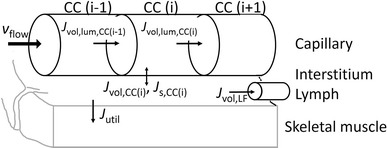
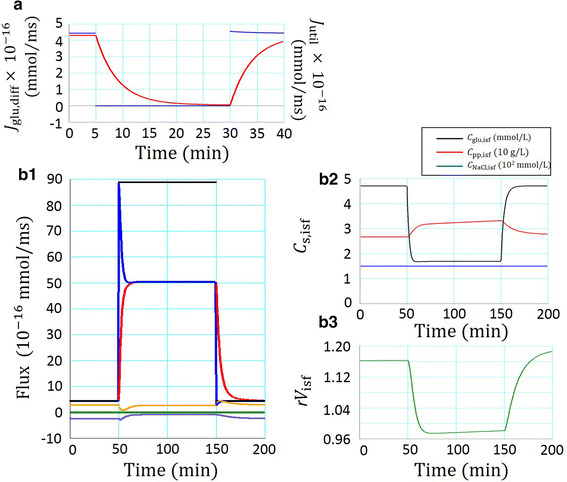
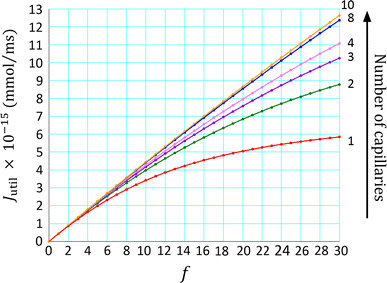
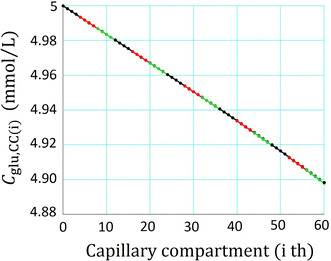
A new glucose transport model relying upon diffusion and convection across the capillary membrane was developed, and supplemented with tissue space and lymph flow. The rate of glucose utilization (J util) in the tissue space was described as a saturation function of glucose concentration in the interstitial fluid (C glu,isf), and was varied by applying a scaling factor f to J max. With f = 0, the glucose diffusion ceased within ~20 min. While, with increasing f, the diffusion was accelerated through a decrease in C glu,isf, but the convective flux remained close to resting level. When the glucose supplying capacity of the capillary was measured with a criterion of J util /J max = 0.5, the capacity increased in proportion to the number of perfused capillaries. A consistent profile of declining C glu,isf along the capillary axis was observed at the criterion of 0.5 irrespective of the capillary number. Increasing blood flow scarcely improved the supplying capacity.

Keywords: Convective glucose flux; Diffusion across the capillary membrane; Glucose supplying capacity; Mathematical capillary model; Reflection coefficient.


Conflict of interest statement

The authors declare that they have no conflict of interest.

Figures

Fig. 1
Fig. 1
Model compartments
Fig. 2
Fig. 2
Model fitting of the experimental volume-pressure relation (a) [32], and the pressure-lymph flow relationships (b) [14]. Dots are experimental measurements in the hindlimb preparation, and the continuous curve is the theoretical relationship of Eq. (5) and Eq. (6)
Fig. 3
Fig. 3
Main factors involved in the glucose flux under the control (resting) condition. a Capillary colloid osmotic pressure π pp,CC(i) (blue), capillary hydrostatic pressure P CC(i) (red), tissue colloid osmotic pressure π pp,isf (green), and tissue hydrostatic pressure P isf (black). b The volume flux across the capillary membrane: the filtration J vol,filt,CC(i) (red) and reabsorption J vol,reab,CC(i) (blue). The lymphatic drainage of interstitial fluid J vol,LF is indicated by a black line, all in a dimension of 10−12 μl/ms. c1, c2, c3 The solute convective flux J s,conv,CC(i) by filtration (red) and reabsorption J s,conv,CC(i) (blue). c1 Glucose flux (10−17 mmol/ms), c2 plasma protein flux (10−18 g/ms), and c3 NaCl flux (10−16 mmol/ms). The diffusion fluxes J s,diff,CC(i) are indicated by a black line in each graph
Fig. 4
Fig. 4
Time course of the glucose transport response evoked by varying the metabolic activity (a f  = 0, b f = 20) in the tissue space. a Cessation of glucose diffusion (J glu,diff) after nullifying J util through equilibration of glucose concentration between capillary and isf. The glucose utilization J util (blue) and the net glucose transport J glu, diff (red) are shown. b1 Glucose flux J glu across the capillary membrane given in 10−16 mmol/ms. The target J util determined by f (=20) and the initial C glu,isf (=4.7 mM) (Eq. 2) (black), the evolution of J util (blue), the net glucose transport J glu,diff (red), glucose filtration transport J glu,filt (yellow), glucose reabsorption transport J glu, reab (purple), and lymphatic glucose drainage of interstitial fluid J glu, LF (green) are shown. b2 Interstitial concentration of C glu,isf (mmol/l, black), C pp,isf (10 g/l, red) and C NaCl,isf (102 mmol/l, blue). b3 Relative tissue volume (rV isf, green). On returning to the control condition, rV isf showed a rebound because of an accumulation of pp during the test period of f = 20
Fig. 5
Fig. 5
The relation between J util and the scaling factor f of J max.r at different numbers of capillaries indicated at the right side
Fig. 6
Fig. 6
The J util-f relations (a) and the profiles of C glu,CC(i) along the capillary axis when the numbers of capillaries were one (b) and three (c), respectively. a v flow was varied by fourfold (green), onefold (control, red), 0.1-fold (blue) and 0.01-fold (black). The J util-f relations were nearly superimposed. b Profiles of C glu,CC(i) along the capillary axis when the capillary number was one. c The same profiles of C glu,CC(i) obtained when the capillary number was three
Fig. 7
Fig. 7
The steady-state relationship between the I s (a) and f (b) as revealed by the horizontal line drawn at the criterion level I s = 0.5
Fig. 8
Fig. 8
The profile of C glu.CC(i) along the capillary axis at I s = 0.5. The values of f were 8.74 at one (black), 17.5 at two (red) and 26.2 at three capillaries (green). For better visibility, the three curves, nearly identical, were plotted in an alternating way with different colors

Similar articles

Cited by

References

    1. Goldstein MS, Mullick V, Huddlestun B, Levine R. Action of muscular work on transfer of sugars across cell barriers; comparison with action of insulin. Am J Physiol. 1953;173:212–216. doi: 10.1152/ajplegacy.1953.173.2.212. - DOI - PubMed
    1. Hansen P, Gulve E, Gao J, Schluter J, Mueckler M, Holloszy J. Kinetics of 2-deoxyglucose transport in skeletal muscle: effects of insulin and contractions. Am J Physiol. 1995;268:C30–C35. doi: 10.1152/ajpcell.1995.268.1.C30. - DOI - PubMed
    1. Desvigne N, Barthelemy JC, Bertholon F, Gay-Montchamp JP, Freyssenet D, Costes F. Validation of a new calibration method for human muscle microdialysis at rest and during exercise. Eur J Appl Physiol. 2004;92:312–320. doi: 10.1007/s00421-004-1099-0. - DOI - PubMed
    1. Rosdahl H, Ungerstedt U, Jorfeldt L, Henriksson J. Interstitial glucose and lactate balance in human skeletal muscle and adipose tissue studied by microdialysis. J Physiol. 1993;471:637–657. doi: 10.1113/jphysiol.1993.sp019920. - DOI - PMC - PubMed
    1. Henriksson J, Knol M. A single bout of exercise is followed by a prolonged decrease in the interstitial glucose concentration in skeletal muscle. Acta Physiol Scand. 2005;185:313–320. doi: 10.1111/j.1365-201X.2005.01498.x. - DOI - PubMed

LinkOut - more resources