

doi: 10.1038/nmeth.4263.
Epub 2017 Apr 17.
SCnorm: robust normalization of single-cell RNA-seq data
Affiliations
- PMID: 28418000
- PMCID: PMC5473255
- DOI: 10.1038/nmeth.4263
Item in Clipboard
SCnorm: robust normalization of single-cell RNA-seq data
Nat Methods.
2017 Jun.
Abstract
The normalization of RNA-seq data is essential for accurate downstream inference, but the assumptions upon which most normalization methods are based are not applicable in the single-cell setting. Consequently, applying existing normalization methods to single-cell RNA-seq data introduces artifacts that bias downstream analyses. To address this, we introduce SCnorm for accurate and efficient normalization of single-cell RNA-seq data.
Conflict of interest statement
None.
Figures
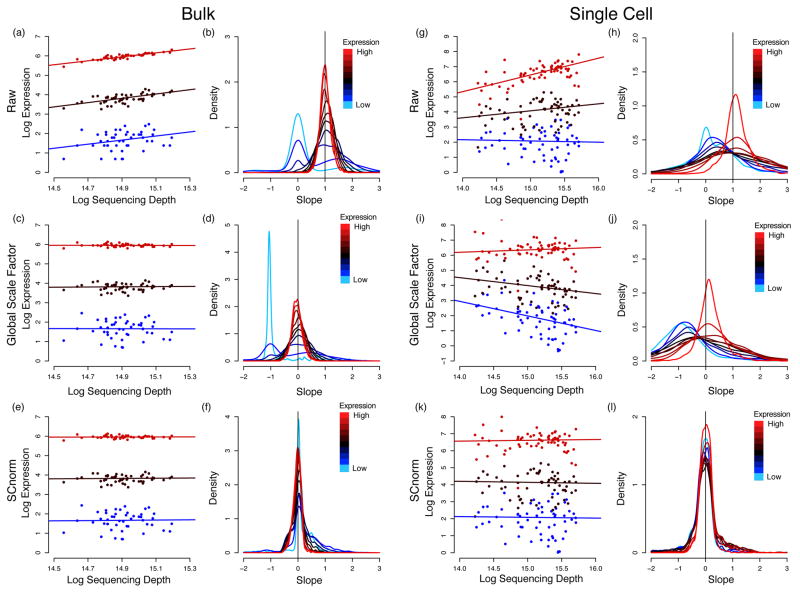
Count-depth relationships in bulk and single-cell datasets before and after normalization. For each gene, median quantile regression was used to estimate the count-depth relationship before normalization and after normalization via MR or SCnorm for the H1 bulk RNA-seq data set (panels (a) – (f)) and the DEC scRNA-seq data set (panels (g)–(l)). Panel (a) shows log-expression vs. log-depth and estimated regression fits for three genes containing no zero measurements and having low, moderate, and high expression defined as median expression among non-zero un-normalized measurements in the 10th–20th quantile, 40th–50th quantile, and 80th–90th quantile, respectively. Panel (b) shows densities of slopes within each of ten equally sized gene groups where a gene’s group membership is determined by its median expression among non-zero un-normalized measurements. Panels (c) and (d) show the data in panels (a) and (b) normalized via MR; (e) and (f) show the data normalized by SCnorm. Panels (g)–(l) are structurally identical to (a)–(f) for the DEC scRNA-seq data set. Qualitatively similar results are observed if slopes are calculated via generalized linear models (Supplementary Note S2 and Supplementary Fig. S1).
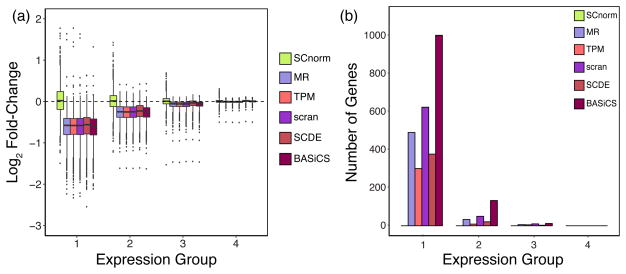
Fold-changes and DE genes calculated from the H1 case study data. For each gene, the fold-change of non-zero counts between the H1-4M and H1-1M groups was computed for data following normalization via SCnorm, MR, TPM, scran, SCDE, and BASiCS. Box-plots of gene-specific fold-changes are shown in panel (a) for data normalized by each method. The number of genes identified as DE using MAST is shown in panel (b). Genes are divided into four equally sized expression groups based on their median among non-zero un-normalized expression measurements and results are shown as a function of expression group. Motivation for considering non-zero counts to calculate fold-change is discussed in Supplementary Note S3.
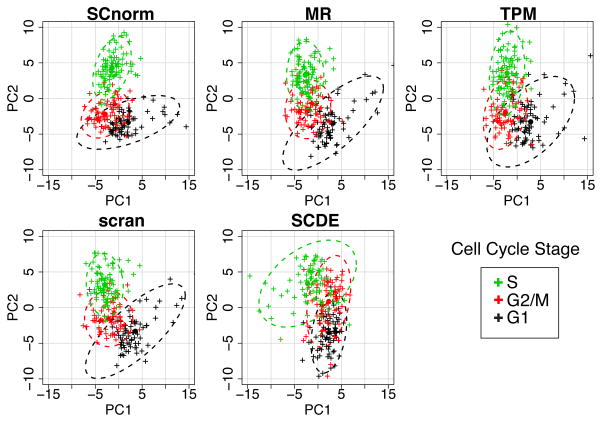
PCA applied to the H1-FUCCI case study. The upper left panel shows the first two principal components (PC1 vs. PC2) from a PCA analysis using 578 cell cycle genes normalized via SCnorm. The other panels show similar results for data normalized using MR, TPM, scran and SCDE. Cells are colored according to cell cycle phase. 95% confidence ellipses are shown for each method. Misclassification rates for SCnorm, MR, TPM, scran, and SCDE averaged across the three cell cycle phases are 0.26, 0.32, 0.38, 0.29, and 0.45, respectively.
References
MeSH terms
Substances
Grants and funding
LinkOut - more resources
Full Text Sources
Other Literature Sources
Molecular Biology Databases
