. 2017 May;27(5):606-625.
doi: 10.1038/cr.2017.55. Epub 2017 Apr 18.

5-methylcytosine promotes mRNA export - NSUN2 as the methyltransferase and ALYREF as an m5C reader

Affiliations

5-methylcytosine promotes mRNA export - NSUN2 as the methyltransferase and ALYREF as an m5C reader

Xin Yang et al. Cell Res. 2017 May.

Abstract

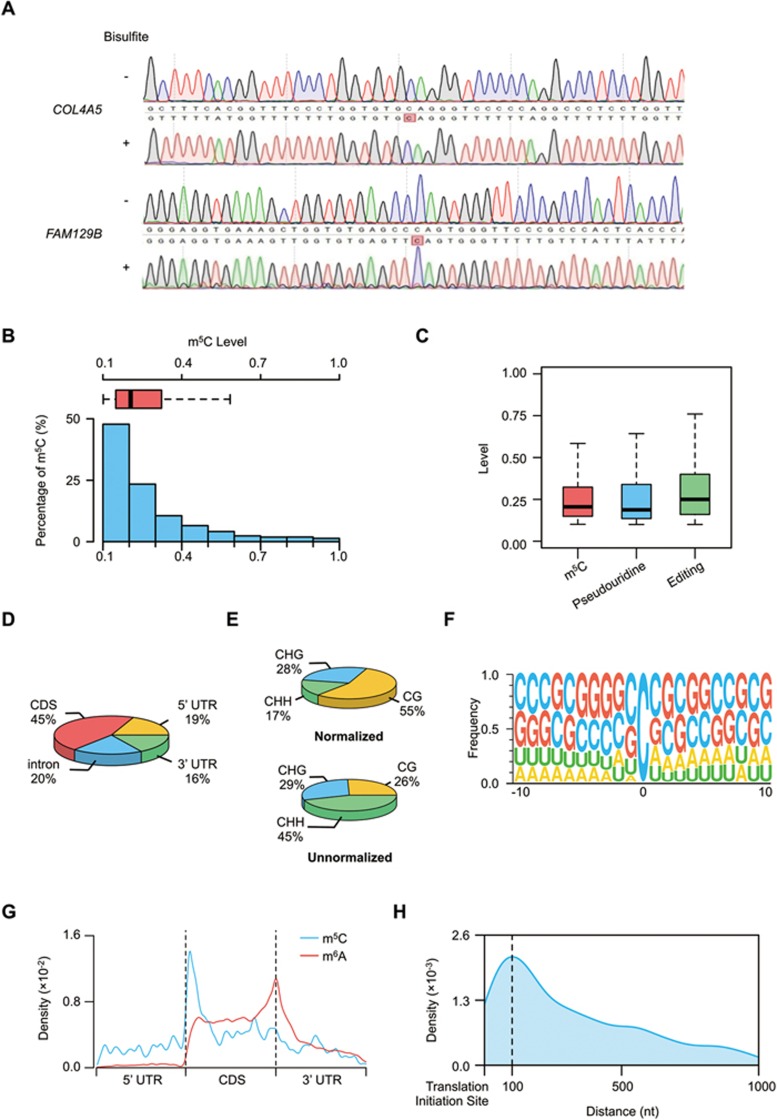
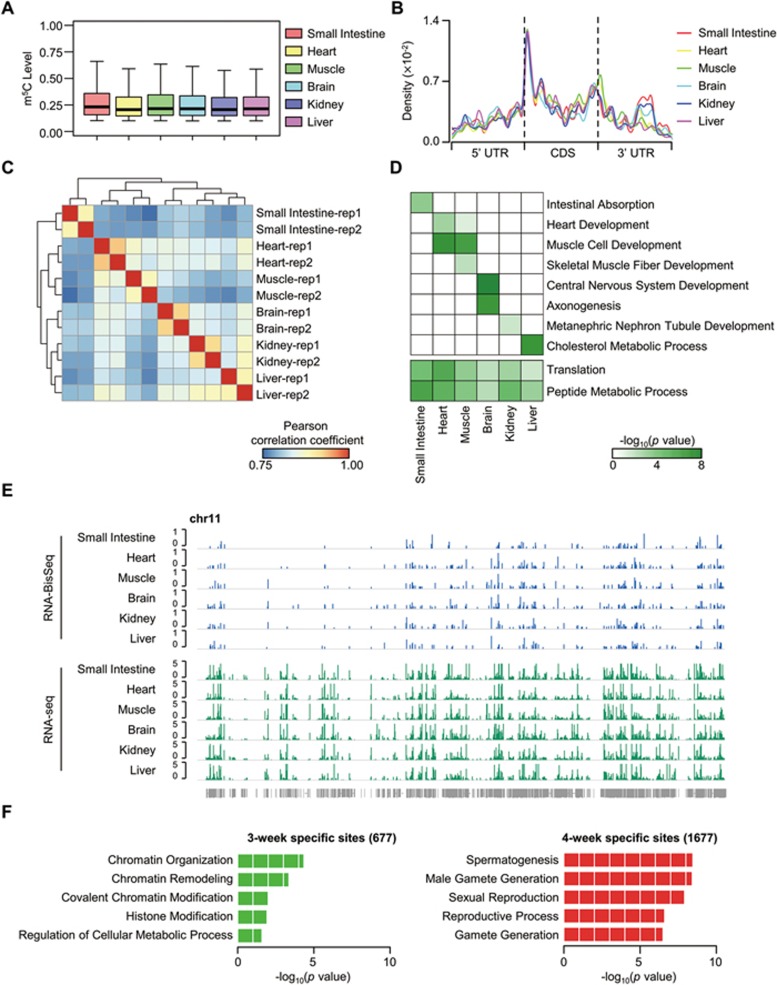
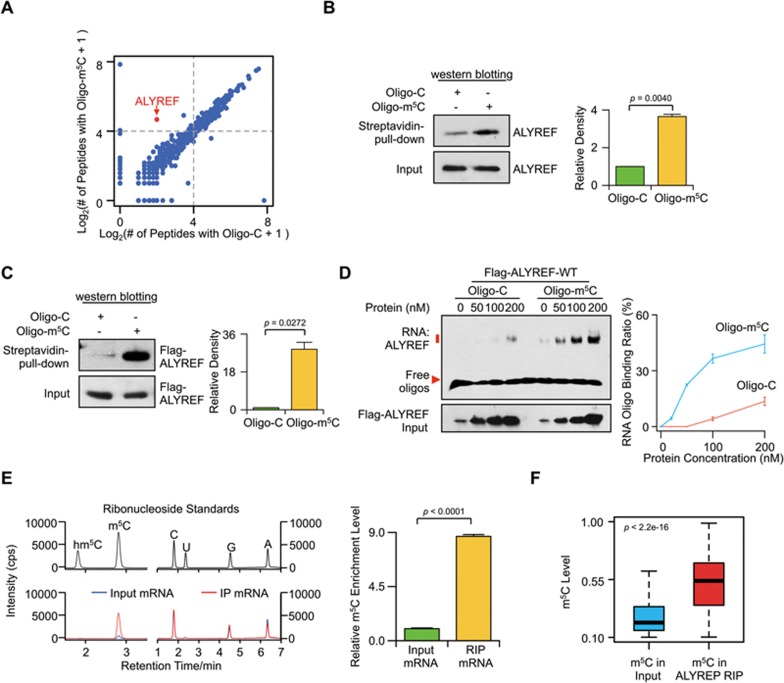
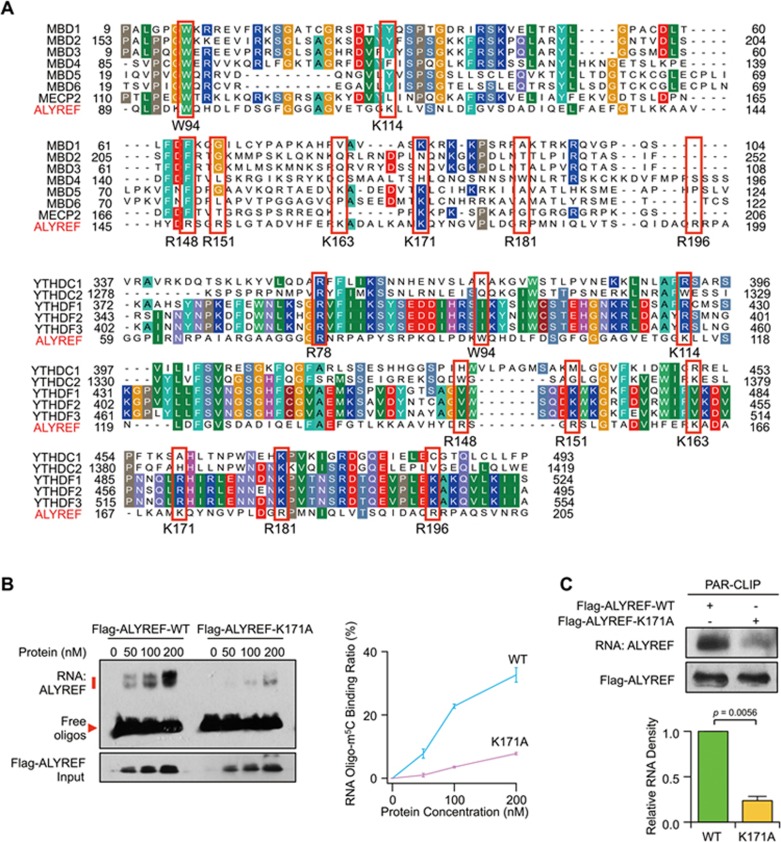
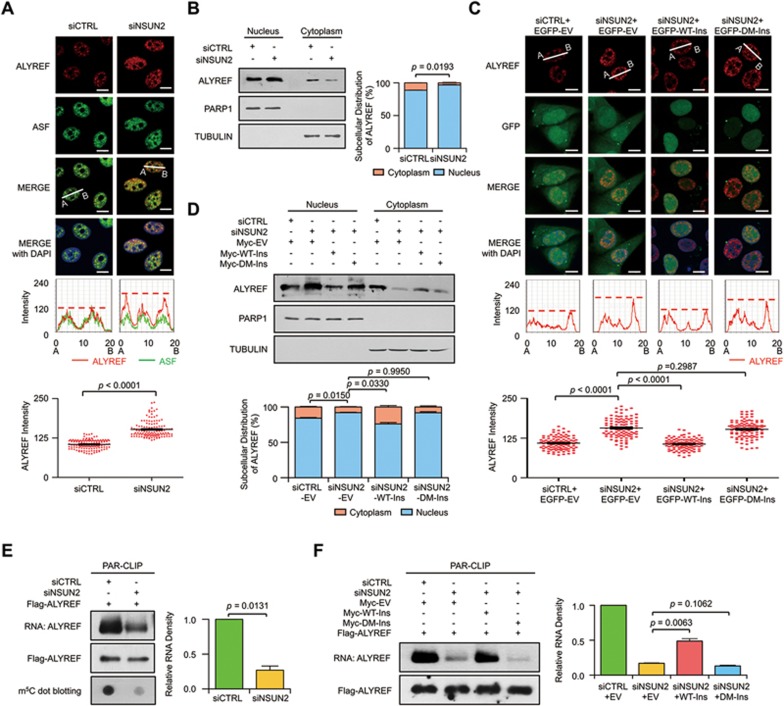
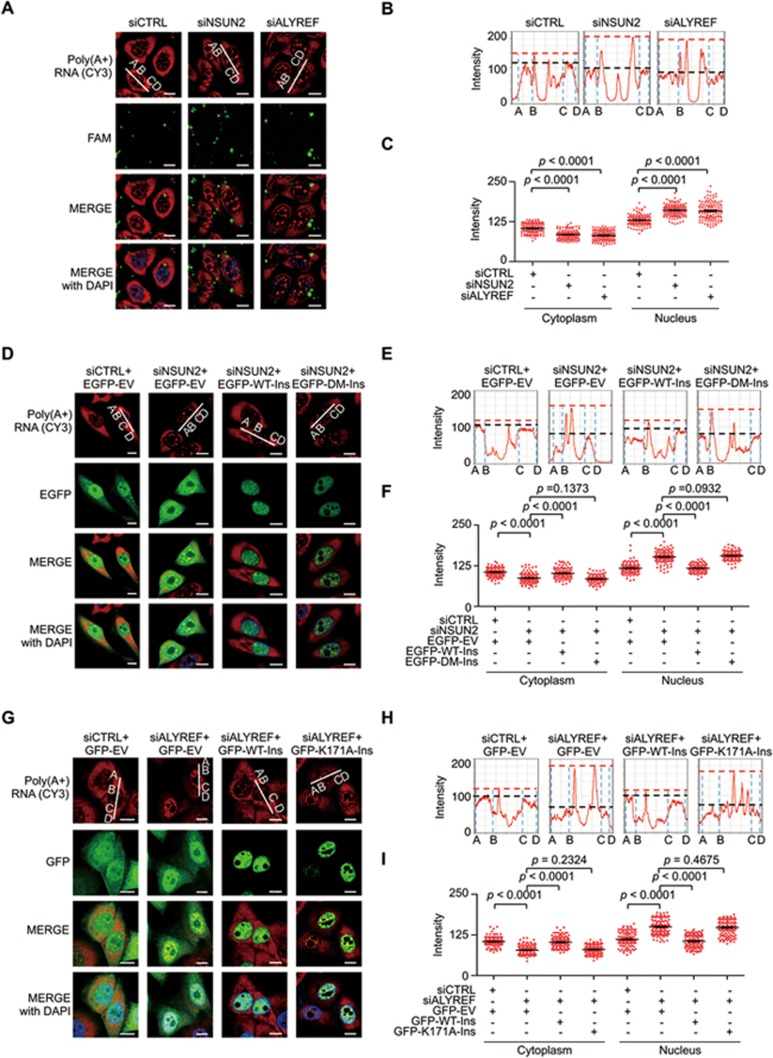
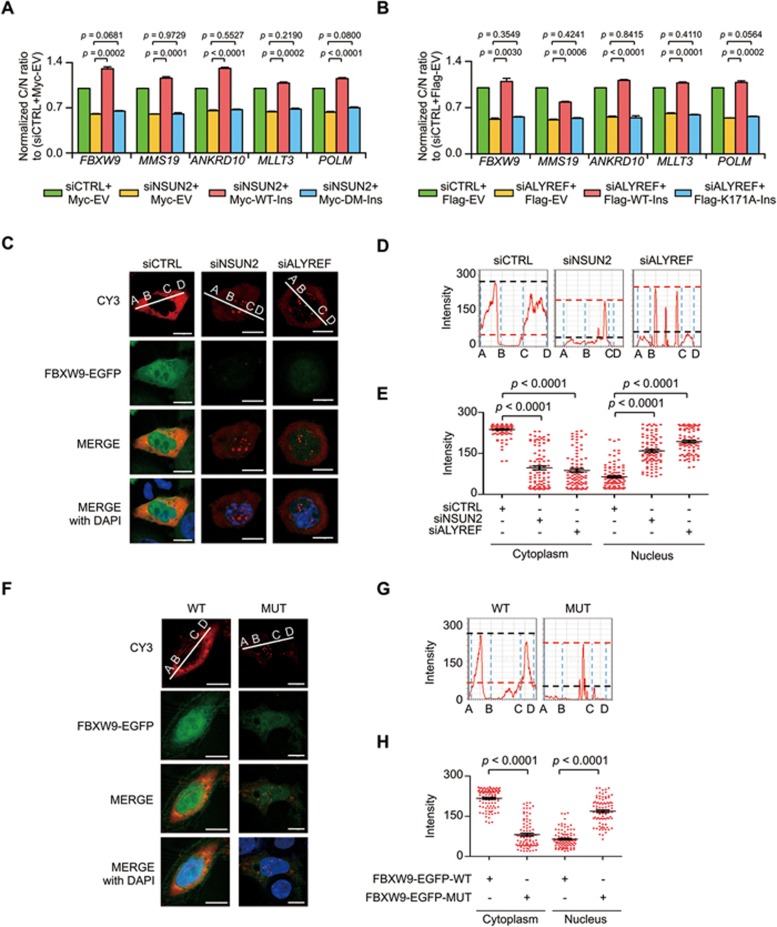
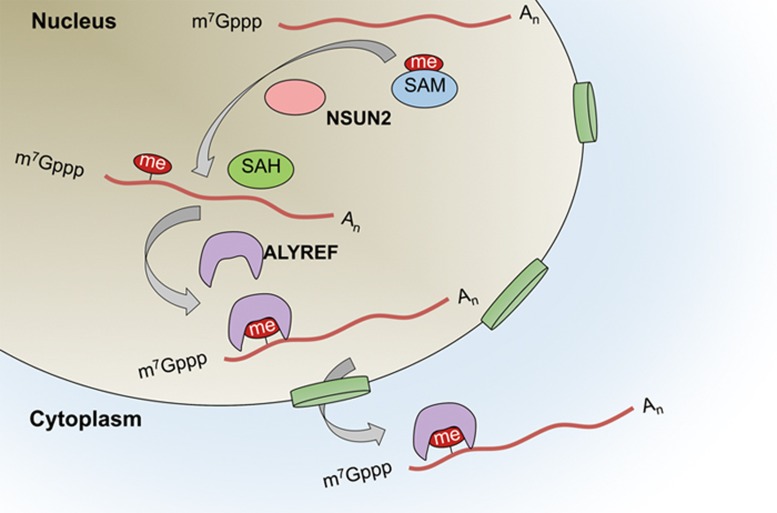
5-methylcytosine (m5C) is a post-transcriptional RNA modification identified in both stable and highly abundant tRNAs and rRNAs, and in mRNAs. However, its regulatory role in mRNA metabolism is still largely unknown. Here, we reveal that m5C modification is enriched in CG-rich regions and in regions immediately downstream of translation initiation sites and has conserved, tissue-specific and dynamic features across mammalian transcriptomes. Moreover, m5C formation in mRNAs is mainly catalyzed by the RNA methyltransferase NSUN2, and m5C is specifically recognized by the mRNA export adaptor ALYREF as shown by in vitro and in vivo studies. NSUN2 modulates ALYREF's nuclear-cytoplasmic shuttling, RNA-binding affinity and associated mRNA export. Dysregulation of ALYREF-mediated mRNA export upon NSUN2 depletion could be restored by reconstitution of wild-type but not methyltransferase-defective NSUN2. Our study provides comprehensive m5C profiles of mammalian transcriptomes and suggests an essential role for m5C modification in mRNA export and post-transcriptional regulation.


Figures

Figure 1
Figure 1
Distribution profiles of m5C in mRNAs. (A) Sanger-based validation of representative m5C sites. m5C sites within COL4A5 (chrX:107911644) and FAM129B (chr9:130268749) (hg19) identified by RNA-BisSeq were validated. cDNA was amplified by PCR using normal primers for untreated mRNAs and specific primers for bisulfite-treated mRNAs. (B) Histogram and box plot showing the mRNA m5C levels. Methylation levels of majority of m5C sites were < 40%. (C) Box plot showing the levels of mRNA m5C, pseudouridine and editing. (D) Transcriptome-wide distribution of mRNA m5C sites. Pie chart presenting the fraction of m5C sites within distinct mRNA regions: CDS, intron, 5′ UTR and 3′ UTR. (E) The normalized and unnormalized proportions of mRNA m5C sites identified in each sequence context: CG, CHG and CHH, where H = A, C, or U. The normalization was done by normalizing m5C numbers in each of three contexts to their individual context proportion within transcriptome. (F) Sequence frequency logo for the sequences proximal to mRNA m5C sites. (G) Distribution of m5C sites and m6A peaks along mRNA transcripts. The moving averages of percentages of mRNA m5C sites and m6A peaks were shown. (H) Distribution of m5C sites across CDS regions of mRNA transcripts.
Figure 2
Figure 2
Tissue-specific mRNA m5C methylomes and dynamic features of mRNA m5C during testis development. (A) Boxplots showing the distributions of mRNA m5C levels across mouse tissues. (B) Distribution of m5C sites along mRNA transcripts in each tissue. The moving averages of mRNA m5C site percentage were shown. (C) Hierarchical clustering of Pearson correlation coefficient across mouse tissues, calculated by pairwise comparison of m5C levels. (D) Heatmap representing the combination of representative GO term enrichment (top: tissue-specific functions; bottom: common functions) in m5C-containing mRNAs in each tissue. Green to white color: high to low levels of GO term enrichment. (E) Browser representation of m5C levels and mRNA abundance within chromosome 11 across mouse tissues. (F) Gene ontology analysis of mRNAs with specific m5C sites in 3- or 4-week stage testis.
Figure 3
Figure 3
ALYREF is a specifi c mRNA m5C-binding protein. (A) Scatter plot of proteins bound to Oligo-m5C versus Oligo-C RNA oligos. The plot was based on the average peptide numbers of proteins detected in both replicates. Enriched ALYREF protein was highlighted. (B) Demonstration of endogenous ALYREF pulled down by biotin-labeled RNA oligonucleotides containing m5C (Oligo-m5C). Left, western blotting; right, quantification level. (C) Demonstration of purified Flag-ALYREF pulled down by biotin-labeled Oligo-m5C. Left, western blotting; right, quantification level. (D) EMSA (left) and line graph quantification (right) showing the binding ability of purified Flag-ALYREF-WT with Oligo-m5C or Oligo-C. 100 nM of RNA Oligo-m5C or Oligo-C was incubated with different concentrations of Flag-ALYREF-WT protein. The RNA binding ratio was calculated by (RNA-protein)/((free RNA) + (RNA-protein)). Error bars indicate SEM (n = 3). P values were calculated using Student's t-test. (E) UHPLC-MRM-MS/MS chromatograms (left) and quantification (right) of m5C in input and in vitro ALYREF-RIP mRNA samples. (F) Boxplot showing m5C level of methylation sites detected in both input and in vivo ALYREF-RIP mRNA samples. P values were calculated using Mann-Whitney U test.
Figure 4
Figure 4
ALYREF specifically binds to mRNA m5C sites via K171. (A) Multiple sequence alignments of ALYREF (GenBank: NP_005773.3), MBD family members MBD1-6 (GenBank: NP_001191065.1, NP_003918.1, NP_001268382.1, NP_001263199.1, NP_060798.2, and NP_443129.3) and MeCP2 (GenBank: NP_001104262.1) (top). Multiple sequence alignments of ALYREF and YTH family members: YTHDC1, YTHDC2, YTHDF1, YTHDF2 and YTHDF3 (GenBank: NP_001026902.1, NP_073739.3, NP_060268.2, NP_001166299.1, and NP_001264742.1) (bottom). The relatively conserved amino acids used for constructing mutants are highlighted in red boxes. (B) EMSA (left) and line graph quantification (right) showing the RNA-binding ability of Flag-ALYREF wild-type (WT) or mutant (K171A) to Oligo-m5C. (C) PAR-CLIP assay (top) and quantification (bottom) of RNAs pulled down by Flag-ALYREF-WT or -K171A in HeLa cells. P values were calculated by Student's t-test. Data shown are mean ± SEM (n = 3).
Figure 5
Figure 5
NSUN2 regulates nuclear-cytoplasmic shuttling and RNA-binding ability of ALYREF. (A) Immunofluorescence staining of ALYREF (red color) and ASF (green color) upon NSUN2 knockdown (top); line scan graphs (middle) and peak density quantification of line scan graphs (bottom) for ALYREF are also shown. Scale bar, 10 μm. Error bars indicate SEM (n = 120). (B) Western blotting (left) and quantification (right) of nuclear and cytoplasmic distribution of ALYREF in control and NSUN2-knockdown HeLa cells. The protein loading for the cytoplasmic fraction is about 2.5-fold higher than that for the nuclear fraction. PARP1 and TUBULIN serve as nuclear and cytoplasmic markers, respectively. Error bars indicate SEM (n = 3). (C) Immunofluorescence staining of ALYREF (red color) in NSUN2-knockdown HeLa cells transfected with control EGFP (EGFP-EV), EGFP-tagged siNSUN2-insensitive wild-type NSUN2 (EGFP-WT-Ins) or mutant (EGFP-DM-Ins) plasmids (top); line scan graphs (middle) and peak density quantification of line scan graphs (bottom) for ALYREF are also shown. Scale bar, 10 μm. Error bars indicate SEM (n = 120). (D) Western blotting (top) and quantification (bottom) of nuclear and cytoplasmic distribution of ALYREF in NSUN2-knockdown HeLa cells transfected with empty Myc expression vector (Myc-EV), Myc-tagged siNSUN2-insensitive wild-type NSUN2 (Myc-WT-Ins), or Mutant (Myc-DM-Ins). The protein loading for the cytoplasmic fraction is about 2.5-fold higher than that for the nuclear fraction. PARP1 and TUBULIN serve as nuclear and cytoplasmic markers, respectively. Error bars indicate SEM (n = 3). (E) PAR-CLIP assay (left) and quantification (right) of RNA pulled down by Flag-ALYREF upon NSUN2 knockdown. RNA labeled with biotin at 3′ end of RNA (End Biotinylation Kit, Thermo) was visualized by the chemiluminescent nucleic acid detection module. m5C-modified RNAs were visualized by dot blotting using m5C antibody. Error bars indicate SEM (n = 3). (F) Rescue PAR-CLIP assay (left) and quantification (right) of RNA pulled down by Flag-ALYREF in NSUN2-knockdown HeLa cells transfected with Myc-EV, Myc-WT-Ins, or Myc-DM-Ins. RNA labeled with biotin at 3′ end of RNA (End Biotinylation Kit, Thermo) was visualized by the Chemiluminescent nucleic acid detection module. Error bars indicate SEM (n = 3). P values were calculated by Student's t-test.
Figure 6
Figure 6
Involvement of m5C in mRNA export regulation. (A-C) Fluorescence in situ hybridization (FISH) analysis of mRNAs (red) in the control, NSUN2- or ALYREF-deficient HeLa cells (A); line scan graphs (B) and peak density quantification of line scan graphs (C) for mRNAs are shown. Green: FAM-labeled siRNAs. The red and black dash lines (B) represent the peak densities of nuclear and cytoplasmic mRNAs, respectively. Scale bar, 10 μm. Error bars indicate SEM (n = 120). (D-I) FISH analysis of mRNAs (red color) in NSUN2 (D-F) or ALYREF (G-I) knockdown HeLa cells reconstituted with control vector, EGFP/GFP-tagged wild-type or mutant forms of NSUN2 (D-F) or ALYREF (G-I); line scan graphs (E, H) and peak density quantification of line scan graphs (F, I) for mRNAs are shown. The red and black dash lines (E, H) represent the peak densities of nuclear and cytoplasmic mRNAs, respectively. Scale bar, 10 μm. Error bars indicate SEM (n = 120). P values were calculated by Student's t-test.
Figure 7
Figure 7
m5C recognition by ALYREF promotes mRNA export. (A, B) qPCR analysis of the relative cytoplasmic to nucleic ratios of NSUN2 target genes with m5C modification in NSUN2 (A) or ALYFEF (B) knockdown HeLa cells reconstituted with control vector, wild-type or mutant forms of NSUN2 (A) or ALYREF (B). Error bars indicate SEM (n = 3). (C-E) FISH analysis of EGFP-tagged FBXW9 Exon 1 minigene mRNAs (red color) in NSUN2 or ALYREF knockdown HeLa cells transfected with m5C site-containing wild-type FBXW9-EGFP minigene construct (FBXW9-EGFP-WT, C); line scan graphs (D) and peak density quantification of line scan graphs (E) for minigene mRNAs are shown. The minigene mRNA export was measured by Cy3-labeled oligonucleotide probes complementary to EGFP mRNAs. Scale bar, 10 μm. Error bars indicate SEM (n = 110). (F) Nuclear export of FBXW9 minigene mRNAs in HeLa cells transfected with m5C site-containing (FBXW9-EGFP-WT) or mutant (FBXW9-EGFP-MUT) minigene plasmids was analyzed by FISH assay using Cy3-labeled oligonucleotide probes complementary to EGFP mRNAs. (G-H) Line scan graphs (G) and peak density quantification of line scan graphs for minigene mRNAs (H) are shown. Scale bar, 10 μm. Error bars indicate SEM (n = 110). P values were calculated by Student's t-test.
Figure 8
Figure 8
Working model showing dynamic regulation of m5C in mRNA. m5C formation is catalyzed by NSUN2. This modification provides a recognition target for ALYREF to mediate mRNA export from the nucleus.

References

    1. Jia G, Fu Y, Zhao X, et al. N6-methyladenosine in nuclear RNA is a major substrate of the obesity-associated FTO. Nat Chem Biol 2011; 7:885–887. - PMC - PubMed
    1. Dominissini D, Moshitch-Moshkovitz S, Schwartz S, et al. Topology of the human and mouse m6A RNA methylomes revealed by m6A-seq. Nature 2012; 485:201–206. - PubMed
    1. Meyer KD, Saletore Y, Zumbo P, Elemento O, Mason CE, Jaffrey SR. Comprehensive analysis of mRNA methylation reveals enrichment in 3′ UTRs and near stop codons. Cell 2012; 149:1635–1646. - PMC - PubMed
    1. Wang X, Lu Z, Gomez A, et al. N6-methyladenosine-dependent regulation of messenger RNA stability. Nature 2014; 505:117–120. - PMC - PubMed
    1. Zhao X, Yang Y, Sun BF, et al. FTO-dependent demethylation of N6-methyladenosine regulates mRNA splicing and is required for adipogenesis. Cell Res 2014; 24:1403–1419. - PMC - PubMed

MeSH terms