

Predicting Protein-protein Association Rates using Coarse-grained Simulation and Machine Learning
- PMID: 28418043
- PMCID: PMC5394550
- DOI: 10.1038/srep46622
Predicting Protein-protein Association Rates using Coarse-grained Simulation and Machine Learning
Abstract
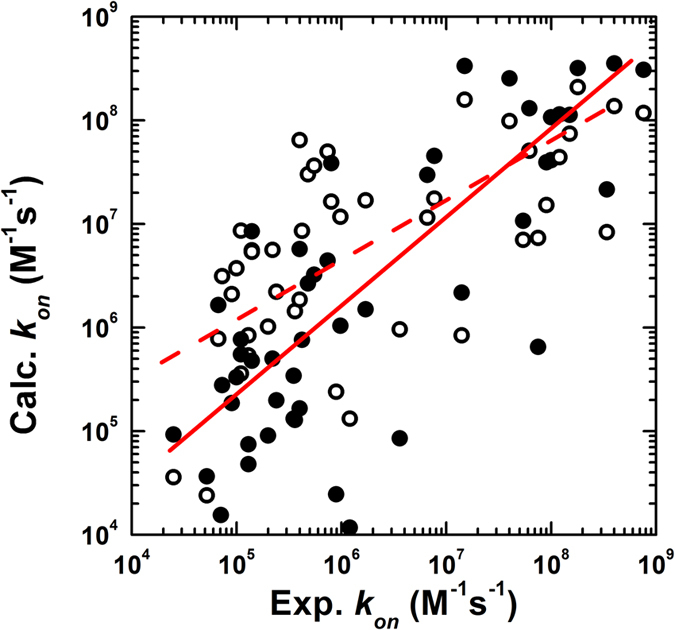
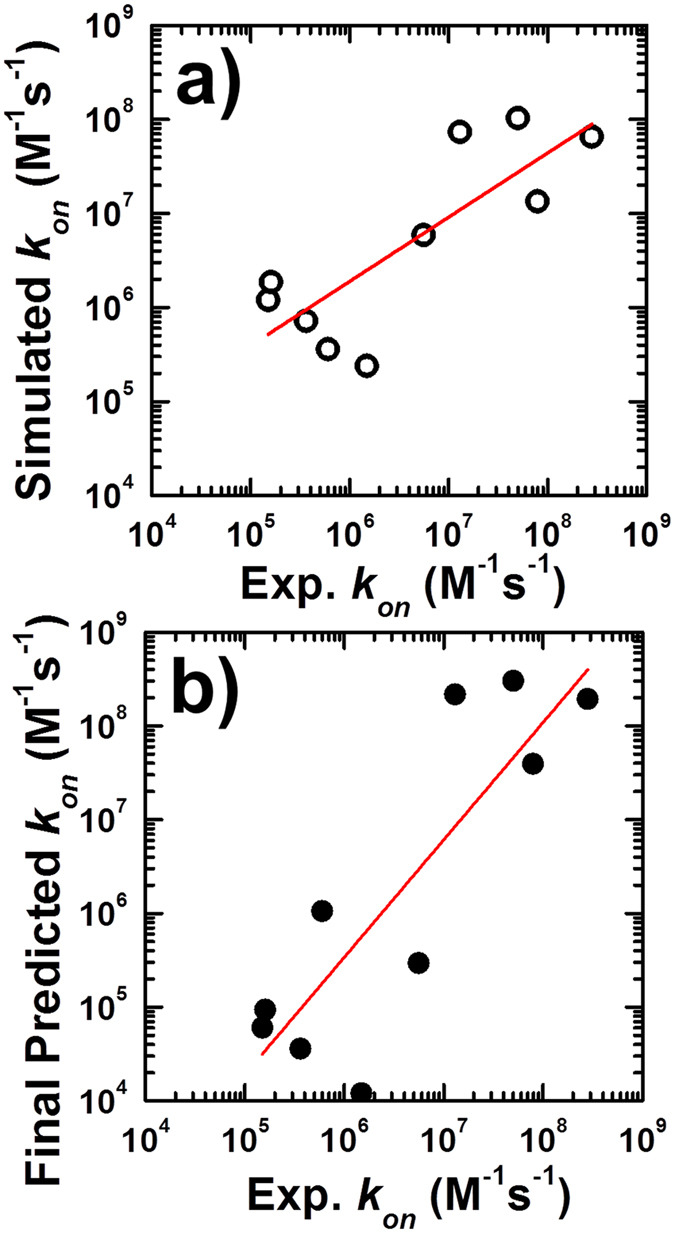
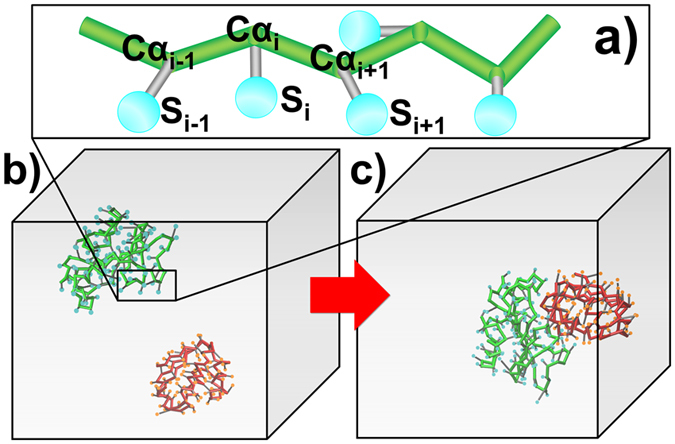
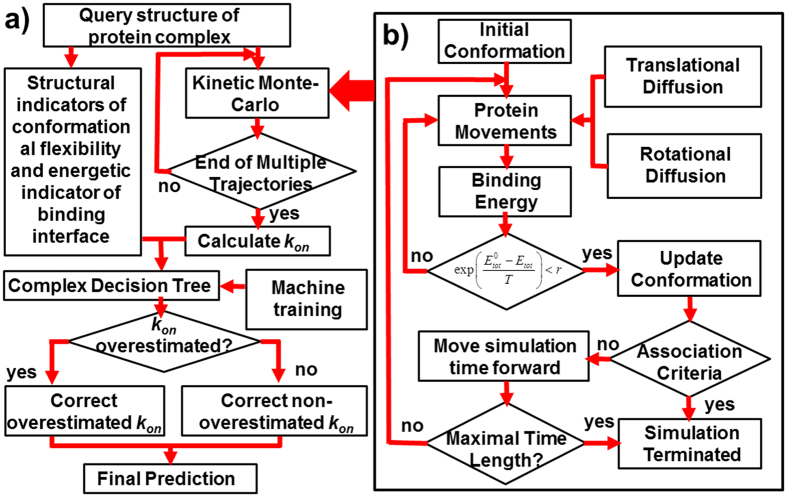
Protein-protein interactions dominate all major biological processes in living cells. We have developed a new Monte Carlo-based simulation algorithm to study the kinetic process of protein association. We tested our method on a previously used large benchmark set of 49 protein complexes. The predicted rate was overestimated in the benchmark test compared to the experimental results for a group of protein complexes. We hypothesized that this resulted from molecular flexibility at the interface regions of the interacting proteins. After applying a machine learning algorithm with input variables that accounted for both the conformational flexibility and the energetic factor of binding, we successfully identified most of the protein complexes with overestimated association rates and improved our final prediction by using a cross-validation test. This method was then applied to a new independent test set and resulted in a similar prediction accuracy to that obtained using the training set. It has been thought that diffusion-limited protein association is dominated by long-range interactions. Our results provide strong evidence that the conformational flexibility also plays an important role in regulating protein association. Our studies provide new insights into the mechanism of protein association and offer a computationally efficient tool for predicting its rate.
Conflict of interest statement
The authors declare no competing financial interests.
Figures
Similar articles
-
A Multiscale Computational Model for Simulating the Kinetics of Protein Complex Assembly.Methods Mol Biol. 2018;1764:401-411. doi: 10.1007/978-1-4939-7759-8_26. Methods Mol Biol. 2018. PMID: 29605930 Free PMC article.
-
pyDockCG: new coarse-grained potential for protein-protein docking.J Phys Chem B. 2011 May 19;115(19):6032-9. doi: 10.1021/jp112292b. Epub 2011 Apr 21. J Phys Chem B. 2011. PMID: 21506617
-
Predicting protein conformational changes for unbound and homology docking: learning from intrinsic and induced flexibility.Proteins. 2017 Mar;85(3):544-556. doi: 10.1002/prot.25212. Epub 2016 Dec 5. Proteins. 2017. PMID: 27862345
-
Modeling of Protein Structural Flexibility and Large-Scale Dynamics: Coarse-Grained Simulations and Elastic Network Models.Int J Mol Sci. 2018 Nov 6;19(11):3496. doi: 10.3390/ijms19113496. Int J Mol Sci. 2018. PMID: 30404229 Free PMC article. Review.
-
Accounting for conformational changes during protein-protein docking.Curr Opin Struct Biol. 2010 Apr;20(2):180-6. doi: 10.1016/j.sbi.2010.02.001. Epub 2010 Mar 1. Curr Opin Struct Biol. 2010. PMID: 20194014 Review.
Cited by
-
Understanding the Impacts of Conformational Dynamics on the Regulation of Protein-Protein Association by a Multiscale Simulation Method.J Chem Theory Comput. 2020 Aug 11;16(8):5323-5333. doi: 10.1021/acs.jctc.0c00439. Epub 2020 Jul 29. J Chem Theory Comput. 2020. PMID: 32667783 Free PMC article.
-
Prediction of Sub-Monomer A2 Domain Dynamics of the von Willebrand Factor by Machine Learning Algorithm and Coarse-Grained Molecular Dynamics Simulation.Sci Rep. 2019 Jun 21;9(1):9037. doi: 10.1038/s41598-019-44044-2. Sci Rep. 2019. PMID: 31227726 Free PMC article.
-
Understand the Functions of Scaffold Proteins in Cell Signaling by a Mesoscopic Simulation Method.Biophys J. 2020 Nov 17;119(10):2116-2126. doi: 10.1016/j.bpj.2020.10.002. Epub 2020 Oct 14. Biophys J. 2020. PMID: 33113350 Free PMC article.
-
Neurocardiac regulation: from cardiac mechanisms to novel therapeutic approaches.J Physiol. 2020 Jul;598(14):2957-2976. doi: 10.1113/JP276962. Epub 2018 Nov 12. J Physiol. 2020. PMID: 30307615 Free PMC article. Review.
-
How does the same ligand activate signaling of different receptors in TNFR superfamily: a computational study.J Cell Commun Signal. 2023 Sep;17(3):657-671. doi: 10.1007/s12079-022-00701-2. Epub 2022 Sep 28. J Cell Commun Signal. 2023. PMID: 36167956 Free PMC article.
References
-
- Janin J. & Chothia C. The structure of protein-protein recognition sites. J Biol Chem 265, 16027–16030 (1990). - PubMed
Publication types
MeSH terms
Substances
Grants and funding
LinkOut - more resources
Full Text Sources
Other Literature Sources
