. 2017 Apr 24:6:e23743.
doi: 10.7554/eLife.23743.

Sequential sensory and decision processing in posterior parietal cortex

Affiliations

Sequential sensory and decision processing in posterior parietal cortex

Guilhem Ibos et al. Elife. .

Abstract

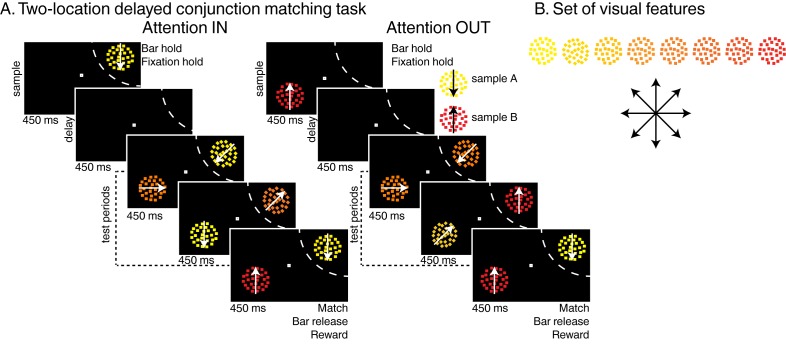
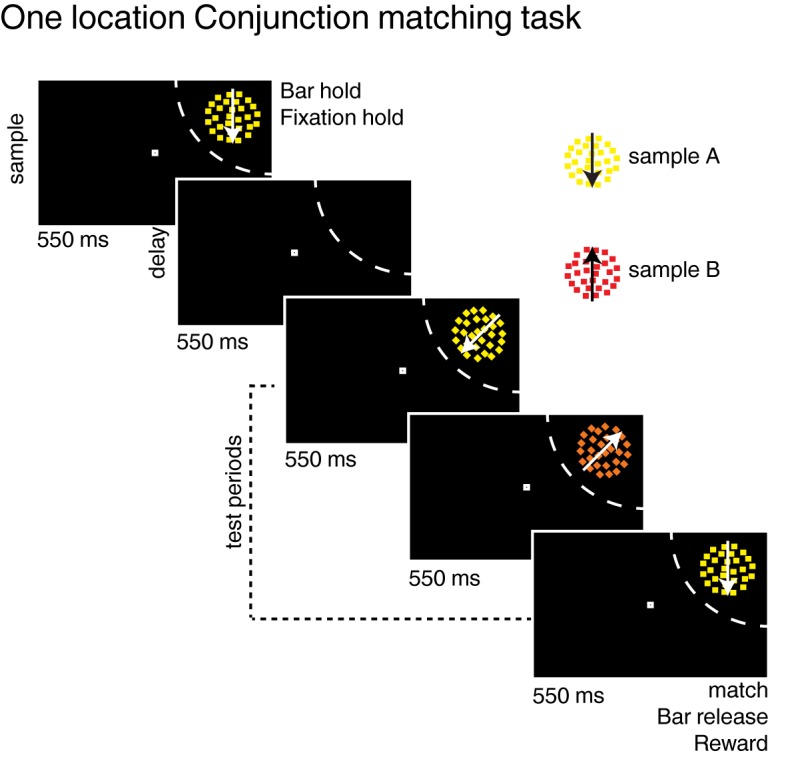
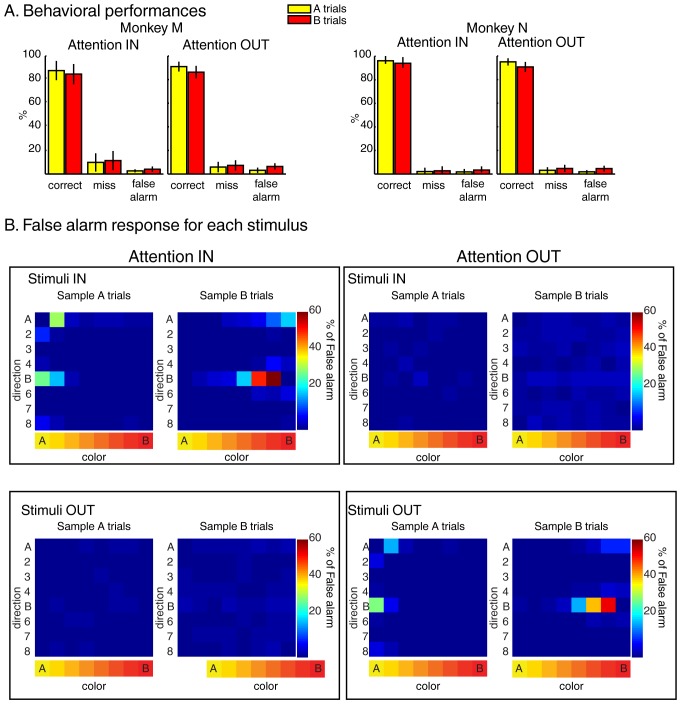
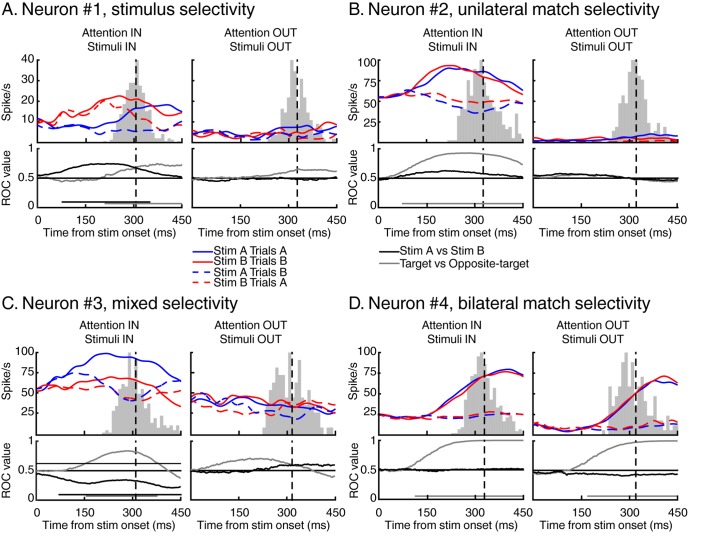
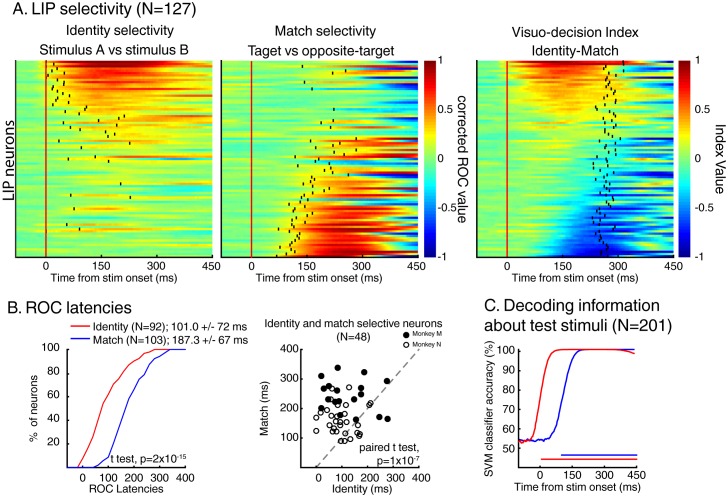
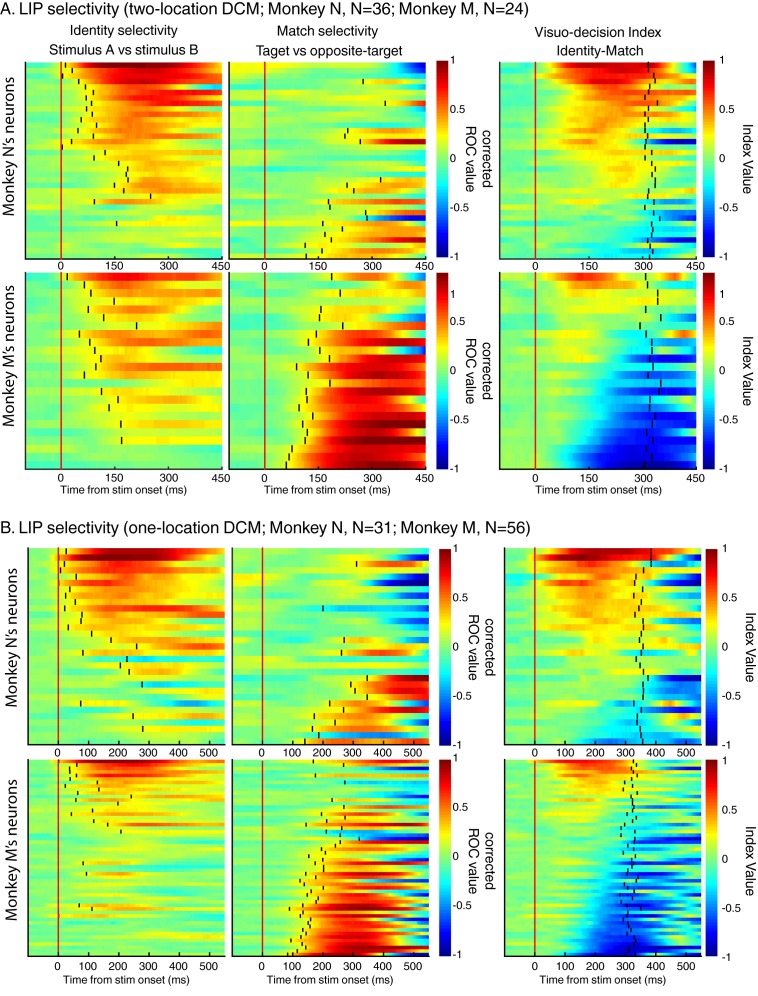
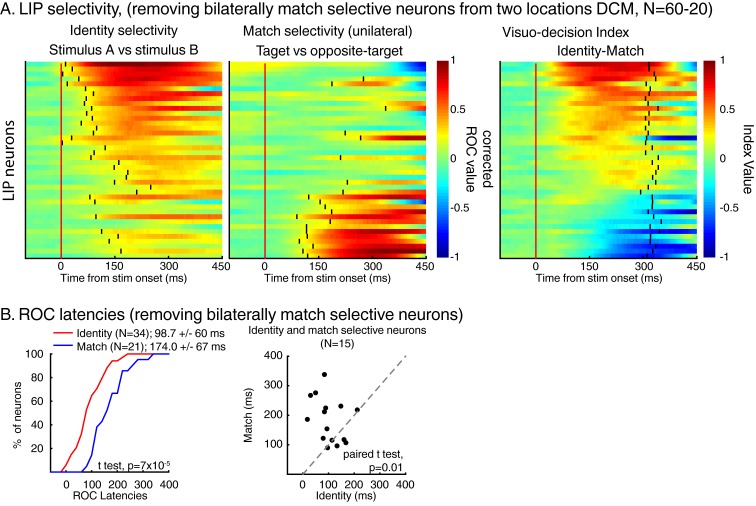
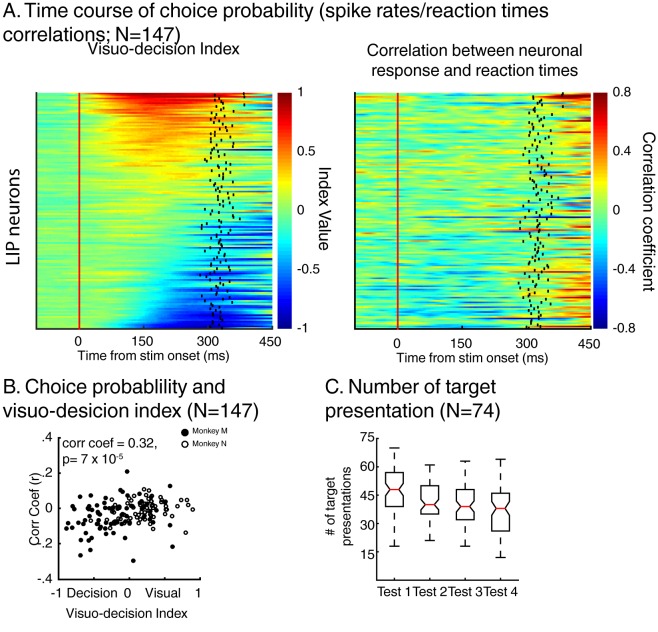
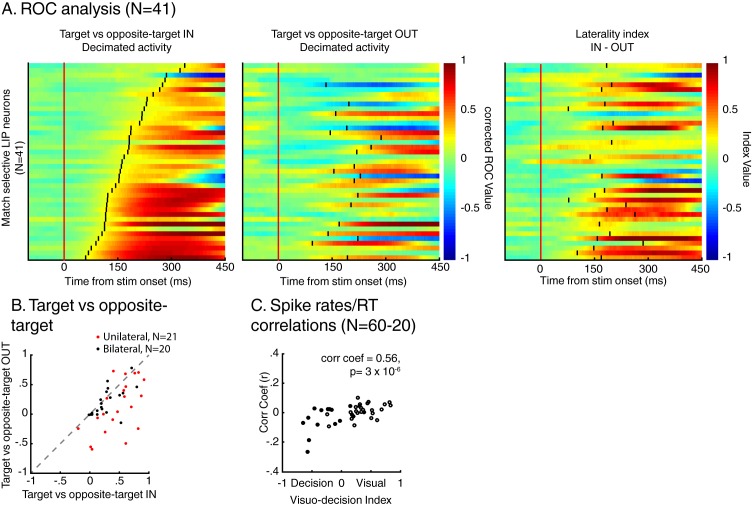
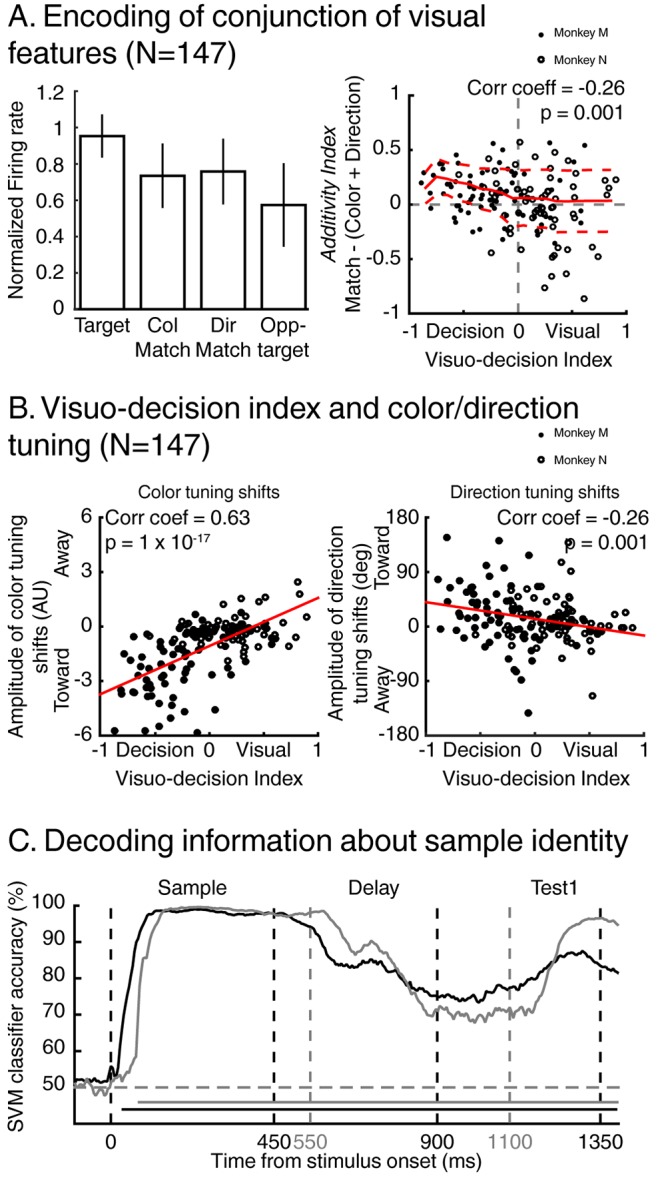
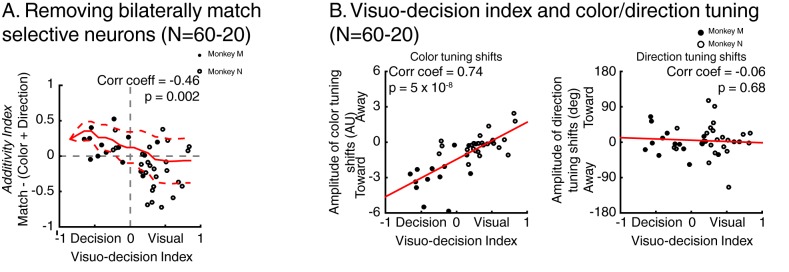
Decisions about the behavioral significance of sensory stimuli often require comparing sensory inference of what we are looking at to internal models of what we are looking for. Here, we test how neuronal selectivity for visual features is transformed into decision-related signals in posterior parietal cortex (area LIP). Monkeys performed a visual matching task that required them to detect target stimuli composed of conjunctions of color and motion-direction. Neuronal recordings from area LIP revealed two main findings. First, the sequential processing of visual features and the selection of target-stimuli suggest that LIP is involved in transforming sensory information into decision-related signals. Second, the patterns of color and motion selectivity and their impact on decision-related encoding suggest that LIP plays a role in detecting target stimuli by comparing bottom-up sensory inputs (what the monkeys were looking at) and top-down cognitive encoding inputs (what the monkeys were looking for).

Keywords: Parietal Cortex; Prefrontal Cortex; attention; decision making; neuroscience; rhesus macaque; vision; visual perception.


Conflict of interest statement

The authors declare that no competing interests exist.

Figures

Figure 1.
Figure 1.. Task: (A) Two-locations delayed conjunction matching task.
One of two sample stimuli was presented for 450 ms. The sample could either be sample A (yellow dots moving downwards) or sample B (red dots moving upwards). After a delay of 450 ms, one to four test stimuli were successively presented at the sample position in succession for 450 ms each while as many distractors were simultaneously presented in the opposite hemifield. In the attention IN condition, sample and test stimuli were presented in the receptive field (RF) of the recorded neuron (dashed arc, not shown to monkeys). In the attention OUT condition, sample and test stimuli were presented outside the RF while distractors were located inside the RF. All stimuli were conjunctions of one color and one direction. To receive a reward, monkeys had to release a manual lever when the test stimulus matched the sample in both color and direction and to ignore the distractors. On 20% of trials, none of the test stimuli matched the sample, and monkeys had to hold fixation and withhold their manual response to receive a reward. (B) Stimulus features: eight colors and eight directions were used to generate 64 different test/distractor stimuli. Colors varied from yellow to red, and directions were evenly spaced across 360 degrees. DOI: http://dx.doi.org/10.7554/eLife.23743.002
Figure 1—figure supplement 1.
Figure 1—figure supplement 1.. Task: (A) One location delayed conjunction matching task (Ibos and Freedman, 2014).
The task is similar to the two locations delayed conjunction matching task except for three points: (1) stimuli are presented on one location, always in each neuron’s receptive field (no distractor); (2) sample stimuli, delay period and test stimuli lasted 550 ms (instead of 450 ms for the two locations DCM); (3) one to three test stimuli can be presented in a row (one to four in the two-location protocol). DOI: http://dx.doi.org/10.7554/eLife.23743.003
Figure 2.
Figure 2.. Behavior during the two-location DCM.
(A) Performances: both monkeys M and N performed the task with high accuracy as ~90% of trials were correct, ~6% were misses and ~4% were false alarms (excluding fixation breaks) in both attention IN and attention OUT conditions. (B) Percent of false alarm responses (averaged across both monkeys) for each of the 64 test stimuli located inside (top) or outside (bottom) the RF of the recorded neuron during attention IN (left) and attention OUT (right) conditions. For each panel, each row represents one direction, and each column represents one color. DOI: http://dx.doi.org/10.7554/eLife.23743.004
Figure 3.
Figure 3.. Examples of individual LIP neurons.
For each example, we show the time course of response to test stimulus A (in blue) and test stimulus B (in red) for both target stimuli (full lines) and opposite-target stimuli (dashed lines). Vertical black dashed lines represent averaged monkey’s reaction times, surrounding grey histograms represent RT’s distributions. We also show the time course of identity selectivity (black lines, ROC comparison stimulus A vs stimulus B) and of match selectivity (grey lines, ROC comparison target vs opposite-target). Each example represents a stereotypical response observed among our recorded population of 74 LIP neurons. DOI: http://dx.doi.org/10.7554/eLife.23743.005
Figure 4.
Figure 4.. Dynamics of identity and match selectivity in LIP.
(A) Each line of each of these panels correspond to the time course of identity selectivity (left panel) and match selectivity (middle panel), defined as corrected ROC values. Each vertical black tick represents the latency at which each signal becomes statistically significant (Wilcoxon test, corrected for multiple comparisons, p<0.01). Right panel shows the time course of a visuo-decision index for each LIP neuron. Vertical black ticks represent averaged RT. Lines on each panel represent similar neurons. (B) Comparisons of discrimination latencies for identity and match selectivity from both two-location and one-location datasets. (C) Time course of performances of an SVM classifier to decode the identity (red line) and the match status of test stimuli (blue line) of both DCM tasks (N = 201). Horizontal blue and red lines represent the statistical significance of the decoder performance (p<0.01). DOI: http://dx.doi.org/10.7554/eLife.23743.006
Figure 4—figure supplement 1.
Figure 4—figure supplement 1.. The same analysis as in Figure 4A and B but for each dataset and for monkey N and M separately.
DOI: http://dx.doi.org/10.7554/eLife.23743.007
Figure 4—figure supplement 2.
Figure 4—figure supplement 2.. The same analysis as in Figure 4 but for the two locations dataset only after removing bilaterally match selective neurons.
DOI: http://dx.doi.org/10.7554/eLife.23743.008
Figure 5.
Figure 5.. Dynamics of neuronal response and monkeys’ reaction times.
(A) Left: time course of visuo-decision index (similar as Figure 4A, N = 147). Right: corresponding time course of choice probability (correlation between neuronal responses (z-scores) and behavioral reaction times). (B) Correlation between choice probability and visuo-decision index. (C) Number of target presentation (two-location DCM only) as a function of target’s position in the sequence of test stimuli. Red lines represent the median of the distribution, superior and inferior limits of the boxes represent the edges of the 25th and 75th percentiles, error bars represent the most extreme values of the distributions. DOI: http://dx.doi.org/10.7554/eLife.23743.009
Figure 6.
Figure 6.. Spatial selectivity of decision-related signals (two-location DCM only).
(A) Each line in both the left and middle panels correspond to the time course, for one LIP neuron, of match selectivity when relevant stimuli were located inside (left panel) or outside its RF (middle panel). Vertical black ticks correspond to each signal latency of significance (Wilcoxon test, corrected for multiple comparisons, p<0.01). Right panel depicts the time course of a laterality index. Vertical black ticks correspond to the latency at which IN and OUT signals significantly differ (permutation test corrected for multiple comparison, p<0.01). (B) Comparisons of match selectivity during attention IN and attention OUT conditions. (C) Similar to B but with baseline activity equated between attention IN and attention OUT. (C) Correlation of neuronal dynamic and monkeys’ reaction times similar as Figure 5B after removing neurons bilaterally match selective. DOI: http://dx.doi.org/10.7554/eLife.23743.010
Figure 7.
Figure 7.. Encoding of visual features along the visuo-decision continuum.
(A) Left panel: averaged normalized response of neurons from the visuo-decision continuum (N = 147) to target, color-match, direction-match and opposite target stimuli. Error bars represent standard deviation of the mean (std). Right panel: Response to relevant conjunction (match) are compared to linear model in which neurons combine color and direction signals linearly (color+direction) as a function of averaged visuo-decision index. Full red line represents sliding averaged additivity index, dotted red lines represent standard deviation to the mean. (B) Effect of feature-based attention as a function of VDI on color selectivity (left, negative and positive values represent shifts toward and away the relevant color respectively), and on direction selectivity (right, positive and negative values represent shifts toward and away the relevant direction, respectively). (C) Time course of decoding accuracy of the identity of the sample by a linear SVM classifier using the activity of the entire population of either 74 LIP neurons (black lines, two-location DCM; chance level = 50%) or 127 LIP neurons (grey lines, one-location DCM; chance level = 50%). DOI: http://dx.doi.org/10.7554/eLife.23743.011
Figure 7—figure supplement 1.
Figure 7—figure supplement 1.. The same analysis as in Figure 7 but applied to the two -location dataset after removing bilaterally match selective neurons.
DOI: http://dx.doi.org/10.7554/eLife.23743.012

References

    1. Andersen RA, Buneo CA. Intentional maps in posterior parietal cortex. Annual Review of Neuroscience. 2002;25:189–220. doi: 10.1146/annurev.neuro.25.112701.142922. - DOI - PubMed
    1. Arcizet F, Mirpour K, Bisley JW. A pure salience response in posterior parietal cortex. Cerebral Cortex. 2011;21:2498–2506. doi: 10.1093/cercor/bhr035. - DOI - PMC - PubMed
    1. Asaad WF, Santhanam N, McClellan S, Freedman DJ. High-performance execution of psychophysical tasks with complex visual stimuli in MATLAB. Journal of Neurophysiology. 2013;109:249–260. doi: 10.1152/jn.00527.2012. - DOI - PMC - PubMed
    1. Barash S, Bracewell RM, Fogassi L, Gnadt JW, Andersen RA. Saccade-related activity in the lateral intraparietal area. I. temporal properties; comparison with area 7a. Journal of Neurophysiology. 1991;66:1095–1108. - PubMed
    1. Bisley JW, Goldberg ME. Neuronal activity in the lateral intraparietal area and spatial attention. Science. 2003;299:81–86. doi: 10.1126/science.1077395. - DOI - PubMed

Publication types

LinkOut - more resources