

Structure of the hexagonal surface layer on Caulobacter crescentus cells
- PMID: 28418382
- PMCID: PMC5699643
- DOI: 10.1038/nmicrobiol.2017.59
Structure of the hexagonal surface layer on Caulobacter crescentus cells
Abstract
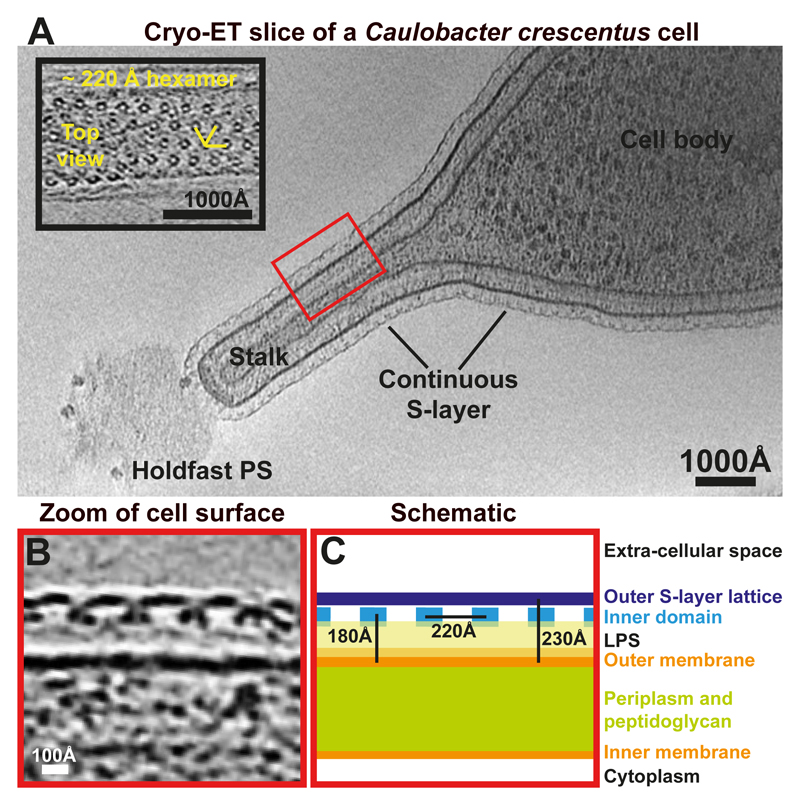
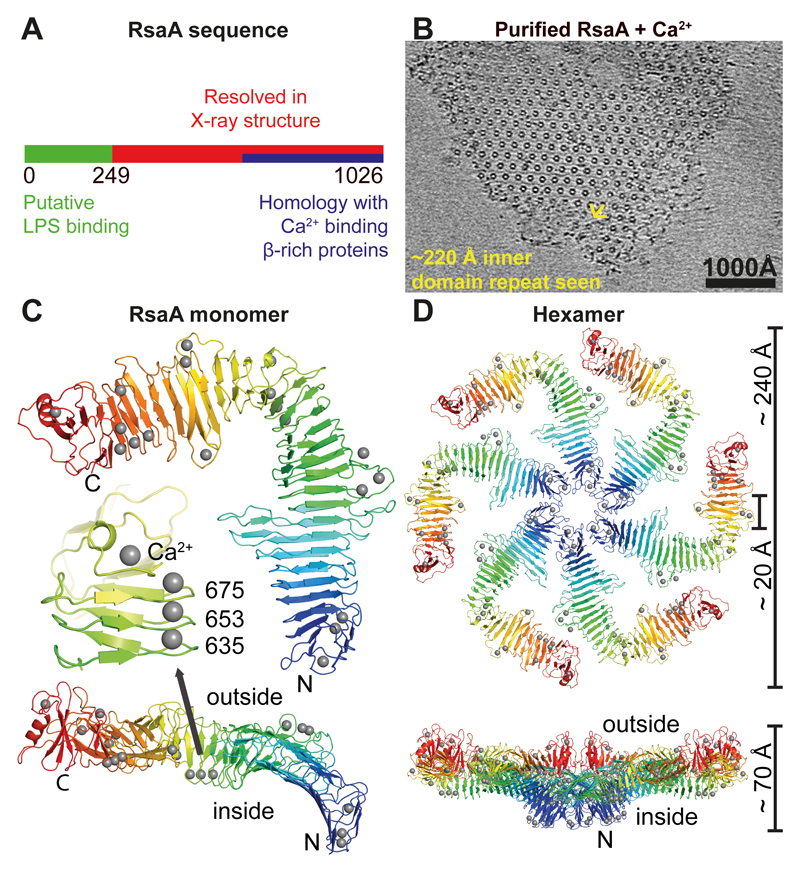
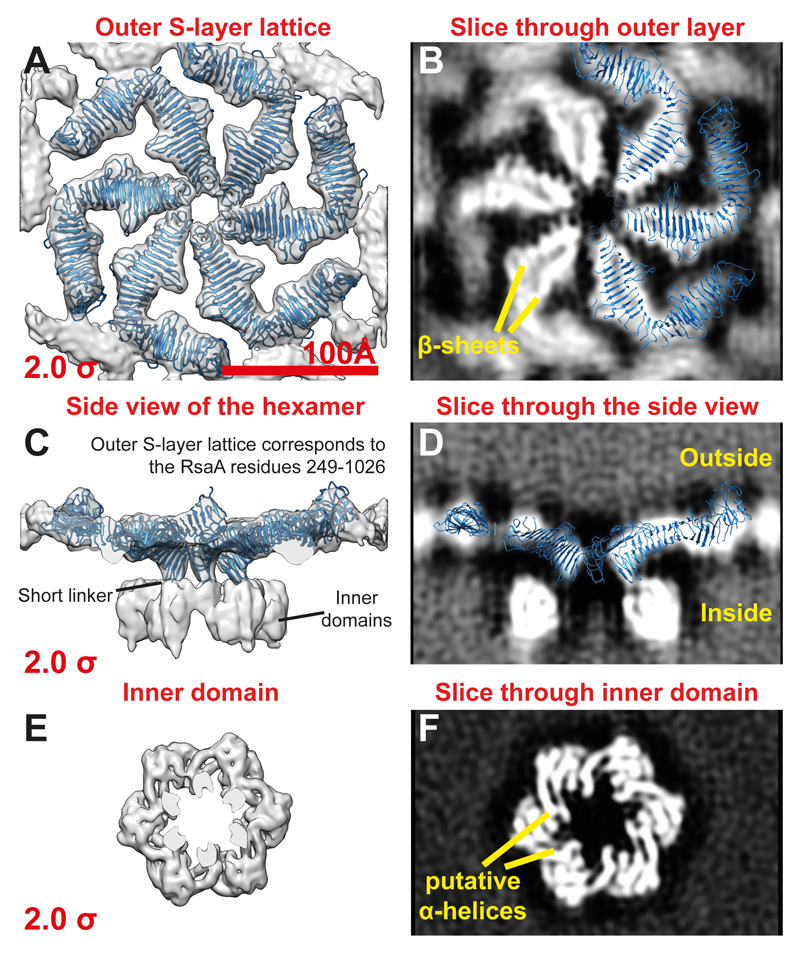
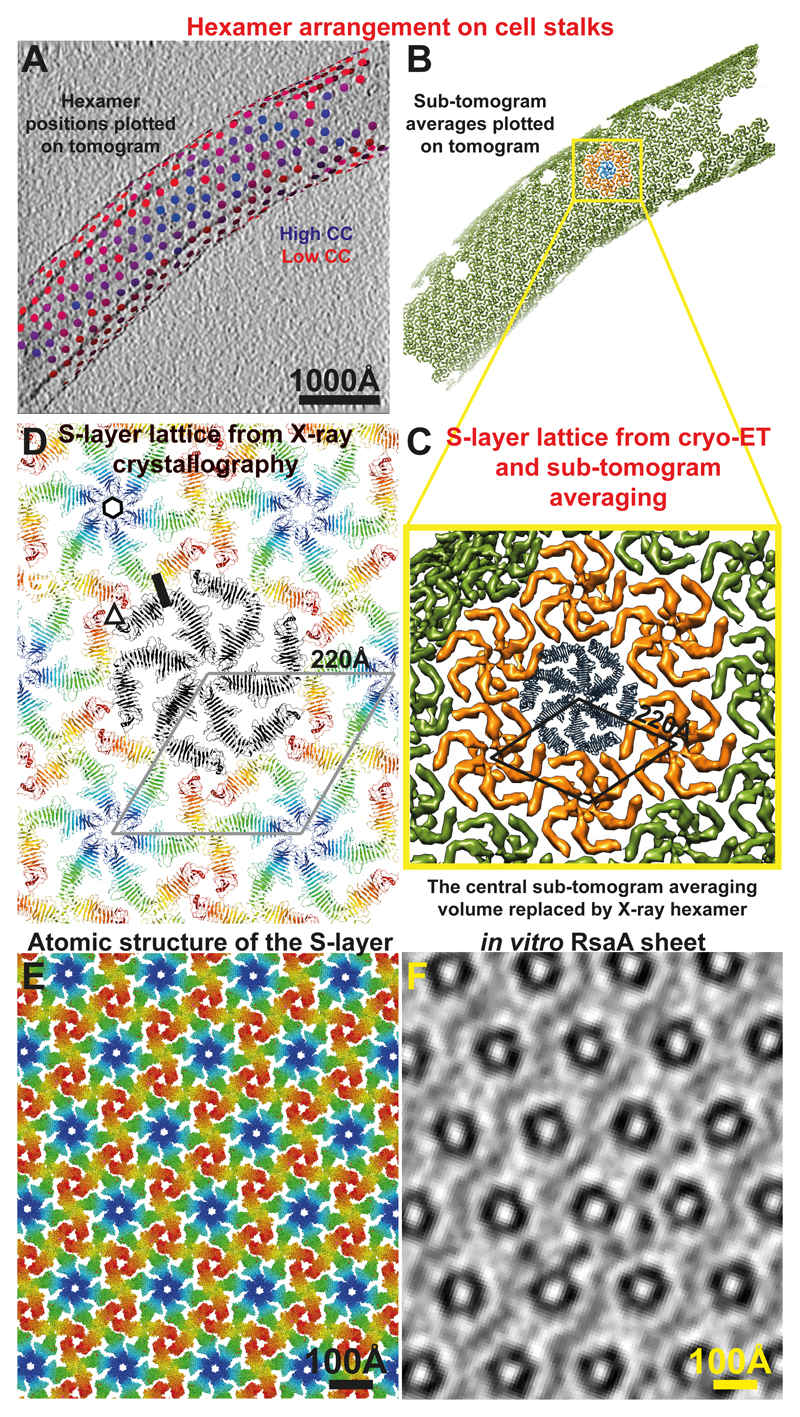
Many prokaryotic cells are encapsulated by a surface layer (S-layer) consisting of repeating units of S-layer proteins. S-layer proteins are a diverse class of molecules found in Gram-positive and Gram-negative bacteria and most archaea1-5. S-layers protect cells from the outside, provide mechanical stability and also play roles in pathogenicity. In situ structural information about this highly abundant class of proteins is scarce, so atomic details of how S-layers are arranged on the surface of cells have remained elusive. Here, using purified Caulobacter crescentus' sole S-layer protein RsaA, we obtained a 2.7 Å X-ray structure that shows the hexameric S-layer lattice. We also solved a 7.4 Å structure of the S-layer through electron cryotomography and sub-tomogram averaging of cell stalks. The X-ray structure was docked unambiguously into the electron cryotomography map, resulting in a pseudo-atomic-level description of the in vivo S-layer, which agrees completely with the atomic X-ray lattice model. The cellular S-layer atomic structure shows that the S-layer is porous, with a largest gap dimension of 27 Å, and is stabilized by multiple Ca2+ ions bound near the interfaces. This study spans different spatial scales from atoms to cells by combining X-ray crystallography with electron cryotomography and sub-nanometre-resolution sub-tomogram averaging.
Conflict of interest statement
The authors declare no competing financial interests.
Figures
Similar articles
-
In Situ Structure of an Intact Lipopolysaccharide-Bound Bacterial Surface Layer.Cell. 2020 Jan 23;180(2):348-358.e15. doi: 10.1016/j.cell.2019.12.006. Epub 2019 Dec 26. Cell. 2020. PMID: 31883796 Free PMC article.
-
Surface-layer protein from Caulobacter crescentus: expression, purification and X-ray crystallographic analysis.Acta Crystallogr F Struct Biol Commun. 2016 Sep;72(Pt 9):677-80. doi: 10.1107/S2053230X16011638. Epub 2016 Aug 9. Acta Crystallogr F Struct Biol Commun. 2016. PMID: 27599857 Free PMC article.
-
Analysis of the intact surface layer of Caulobacter crescentus by cryo-electron tomography.J Bacteriol. 2010 Nov;192(22):5855-65. doi: 10.1128/JB.00747-10. Epub 2010 Sep 10. J Bacteriol. 2010. PMID: 20833802 Free PMC article.
-
Toward Organism-scale Structural Biology: S-layer Reined in by Bacterial LPS.Trends Biochem Sci. 2020 Jul;45(7):549-551. doi: 10.1016/j.tibs.2020.03.006. Epub 2020 Mar 27. Trends Biochem Sci. 2020. PMID: 32531227 Review.
-
Glycobiology of surface layer proteins.Biochimie. 2001 Jul;83(7):591-9. doi: 10.1016/s0300-9084(01)01299-8. Biochimie. 2001. PMID: 11522387 Review.
Cited by
-
Synchronized Swarmers and Sticky Stalks: Caulobacter crescentus as a Model for Bacterial Cell Biology.J Bacteriol. 2023 Feb 22;205(2):e0038422. doi: 10.1128/jb.00384-22. Epub 2023 Jan 30. J Bacteriol. 2023. PMID: 36715542 Free PMC article. Review.
-
Architecture and modular assembly of Sulfolobus S-layers revealed by electron cryotomography.Proc Natl Acad Sci U S A. 2019 Dec 10;116(50):25278-25286. doi: 10.1073/pnas.1911262116. Epub 2019 Nov 25. Proc Natl Acad Sci U S A. 2019. PMID: 31767763 Free PMC article.
-
In situ structure of the Caulobacter crescentus flagellar motor and visualization of binding of a CheY-homolog.Mol Microbiol. 2020 Sep;114(3):443-453. doi: 10.1111/mmi.14525. Epub 2020 May 25. Mol Microbiol. 2020. PMID: 32449846 Free PMC article.
-
Bacterial defences: mechanisms, evolution and antimicrobial resistance.Nat Rev Microbiol. 2023 Aug;21(8):519-534. doi: 10.1038/s41579-023-00877-3. Epub 2023 Apr 24. Nat Rev Microbiol. 2023. PMID: 37095190 Review.
-
Lifecycle of a predatory bacterium vampirizing its prey through the cell envelope and S-layer.Nat Commun. 2024 Apr 27;15(1):3590. doi: 10.1038/s41467-024-48042-5. Nat Commun. 2024. PMID: 38678033 Free PMC article.
References
-
- Glauert AM. The fine structure of bacteria. Br Med Bull. 1962;18:245–250. - PubMed
MeSH terms
Substances
Grants and funding
LinkOut - more resources
Full Text Sources
Other Literature Sources
Miscellaneous
