

Optical-sectioning microscopy of protoporphyrin IX fluorescence in human gliomas: standardization and quantitative comparison with histology
- PMID: 28418534
- PMCID: PMC5390779
- DOI: 10.1117/1.JBO.22.4.046005
Optical-sectioning microscopy of protoporphyrin IX fluorescence in human gliomas: standardization and quantitative comparison with histology
Abstract
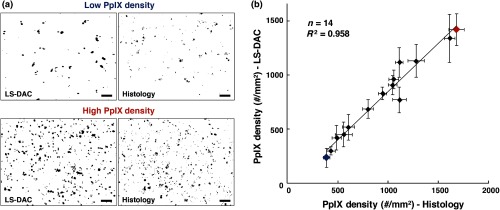
Systemic delivery of 5-aminolevulinic acid leads to enhanced fluorescence image contrast in many tumors due to the increased accumulation of protoporphyrin IX (PpIX), a fluorescent porphyrin that is associated with tumor burden and proliferation. The value of PpIX-guided resection of malignant gliomas has been demonstrated in prospective randomized clinical studies in which a twofold greater extent of resection and improved progression-free survival have been observed. In low-grade gliomas and at the diffuse infiltrative margins of all gliomas, PpIX fluorescence is often too weak to be detected with current low-resolution surgical microscopes that are used in operating rooms. However, it has been demonstrated that high-resolution optical-sectioning microscopes are capable of detecting the sparse and punctate accumulations of PpIX that are undetectable via conventional low-power surgical fluorescence microscopes. To standardize the performance of high-resolution optical-sectioning devices for future clinical use, we have developed an imaging phantom and methods to ensure that the imaging of PpIX-expressing brain tissues can be performed reproducibly. Ex vivo imaging studies with a dual-axis confocal microscope demonstrate that these methods enable the acquisition of images from unsectioned human brain tissues that quantitatively and consistently correlate with images of histologically processed tissue sections.
Figures
Similar articles
-
Scanning Fiber Endoscope Improves Detection of 5-Aminolevulinic Acid-Induced Protoporphyrin IX Fluorescence at the Boundary of Infiltrative Glioma.World Neurosurg. 2018 May;113:e51-e69. doi: 10.1016/j.wneu.2018.01.151. Epub 2018 Feb 2. World Neurosurg. 2018. PMID: 29408716 Free PMC article.
-
Comparing high-resolution microscopy techniques for potential intraoperative use in guiding low-grade glioma resections.Lasers Surg Med. 2015 Apr;47(4):289-95. doi: 10.1002/lsm.22347. Epub 2015 Apr 14. Lasers Surg Med. 2015. PMID: 25872487 Free PMC article.
-
Quantitative fluorescence using 5-aminolevulinic acid-induced protoporphyrin IX biomarker as a surgical adjunct in low-grade glioma surgery.J Neurosurg. 2015 Sep;123(3):771-80. doi: 10.3171/2014.12.JNS14391. Epub 2015 Jul 3. J Neurosurg. 2015. PMID: 26140489 Free PMC article.
-
Selective 5-aminolevulinic acid-induced protoporphyrin IX fluorescence in Gliomas.Acta Neurochir (Wien). 2016 Oct;158(10):1935-41. doi: 10.1007/s00701-016-2897-y. Epub 2016 Aug 6. Acta Neurochir (Wien). 2016. PMID: 27496021 Review.
-
Aminolevulinic acid (ALA)-protoporphyrin IX fluorescence guided tumour resection. Part 1: Clinical, radiological and pathological studies.J Clin Neurosci. 2012 Nov;19(11):1471-4. doi: 10.1016/j.jocn.2012.03.009. Epub 2012 Sep 5. J Clin Neurosci. 2012. PMID: 22959448 Review.
Cited by
-
Survival Outcomes Among Patients With High-Grade Glioma Treated With 5-Aminolevulinic Acid-Guided Surgery: A Systematic Review and Meta-Analysis.Front Oncol. 2019 Jul 17;9:620. doi: 10.3389/fonc.2019.00620. eCollection 2019. Front Oncol. 2019. PMID: 31380272 Free PMC article.
-
The Neurosurgeon's Armamentarium for Gliomas: An Update on Intraoperative Technologies to Improve Extent of Resection.J Clin Med. 2021 Jan 11;10(2):236. doi: 10.3390/jcm10020236. J Clin Med. 2021. PMID: 33440712 Free PMC article. Review.
-
Preliminary Report: Rapid Intraoperative Detection of Residual Glioma Cell in Resection Cavity Walls Using a Compact Fluorescence Microscope.J Clin Med. 2021 Nov 18;10(22):5375. doi: 10.3390/jcm10225375. J Clin Med. 2021. PMID: 34830662 Free PMC article.
-
Progress in Confocal Laser Endomicroscopy for Neurosurgery and Technical Nuances for Brain Tumor Imaging With Fluorescein.Front Oncol. 2019 Jul 3;9:554. doi: 10.3389/fonc.2019.00554. eCollection 2019. Front Oncol. 2019. PMID: 31334106 Free PMC article.
-
Confocal Laser Microscopy in Neurosurgery: State of the Art of Actual Clinical Applications.J Clin Med. 2021 May 10;10(9):2035. doi: 10.3390/jcm10092035. J Clin Med. 2021. PMID: 34068592 Free PMC article. Review.
References
Publication types
MeSH terms
Substances
Grants and funding
LinkOut - more resources
Full Text Sources
Other Literature Sources
Medical
