. 2017 May 10;17(5):2913-2920.
doi: 10.1021/acs.nanolett.7b00132. Epub 2017 Apr 21.

A Liposome Encapsulated Ruthenium Polypyridine Complex as a Theranostic Platform for Triple-Negative Breast Cancer

Affiliations

A Liposome Encapsulated Ruthenium Polypyridine Complex as a Theranostic Platform for Triple-Negative Breast Cancer

Jianliang Shen et al. Nano Lett. .

Abstract

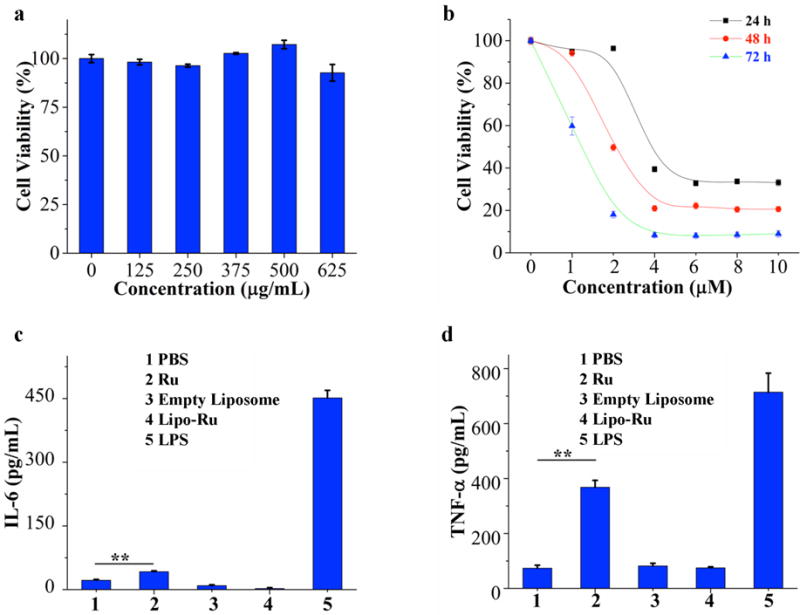
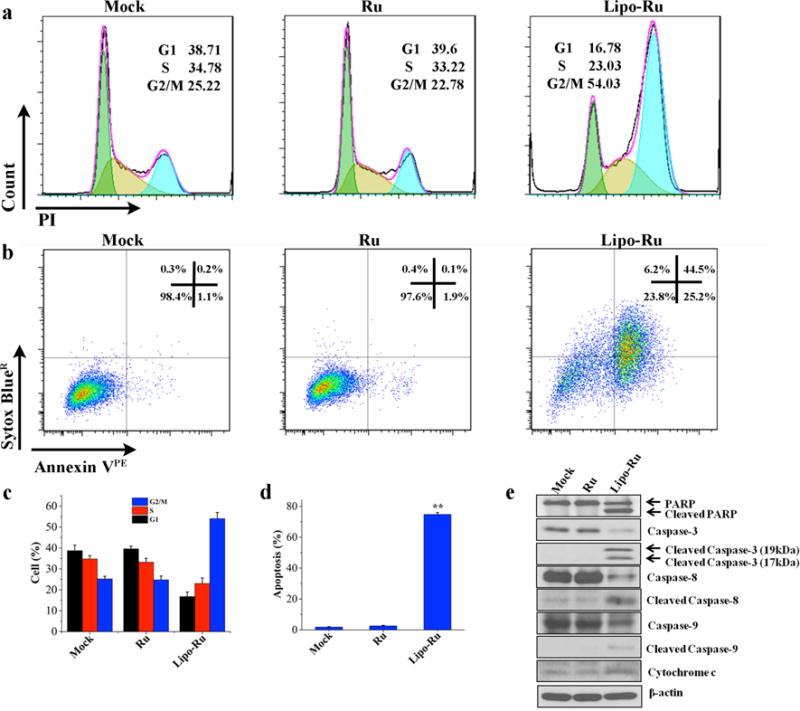
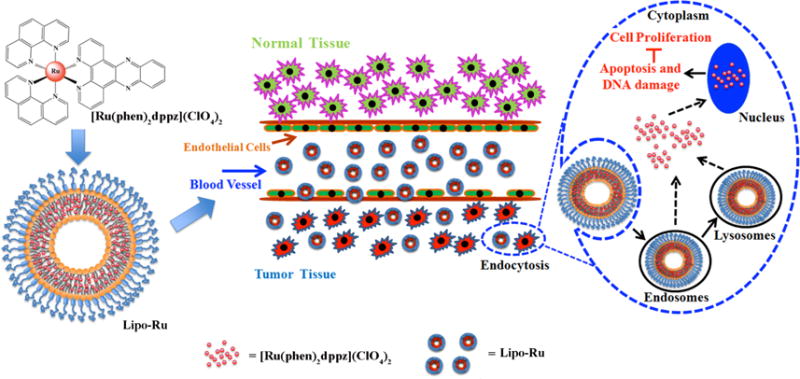
Ruthenium coordination complexes have the potential to serve as novel theranostic agents for cancer. However, a major limitation in their clinical implementation is effective tumor accumulation. In this study, we have developed a liposome-based theranostic nanodelivery system for [Ru(phen)2dppz](ClO4)2 (Lipo-Ru). This ruthenium polypyridine complex emits a strong fluorescent signal when incorporated in the hydrophobic lipid bilayer of the delivery vehicle or in the DNA helix, enabling visualization of the therapeutic agent in tumor tissues. Incubation of MDA-MB-231 breast cancer cells with Lipo-Ru induced double-strand DNA breaks and triggers apoptosis. In a mouse model of triple-negative breast cancer, treatment with Lipo-Ru dramatically reduced tumor growth. Biodistribution studies of Lipo-Ru revealed that more than 20% of the injected dose accumulated in the tumor. These results suggest that Lipo-Ru could serve as a promising theranostic platform for cancer.

Keywords: Liposome; nanoplatform; ruthenium polypyridine complex; theranostic; triple-negative breast cancer.


Conflict of interest statement

Notes

The authors declare no competing financial interest.

Figures

Figure 1
Figure 1
Characterization of Ru and Lipo-Ru. a) Fluorescence spectra of Ru (2 × 10⁻⁴ M) in Tris-HCl buffer at 298 K in the absence and presence of a DNA plasmid (0–3.2 μg). Inset I) Plot showing the change in fluorescence intensity with increasing concentrations of DNA. I0, absence of DNA; I, presence of DNA. Inset II) Image of the Ru/DNA plasmid mixture obtained with an in vivo preclinical imaging system (IVIS-200). Increasing DNA concentration from left to right. b) Fluorescence quenching induced by DNase (10 μg) at various times points. Inset I) Plot showing the change in fluorescence intensity over time. I0, 0 min; I, 0–60 min. Inset II) Image of the Ru/DNA plasmid mixture with DNase obtained with IVIS-200. Increasing time periods from left to right. c) Transmission electron microscopy (TEM) image of Lipo-Ru. d) Size distribution of Lipo-Ru measured with dynamic light scattering. e) Ultraviolet-visible (UV-Vis) spectra of Ru and Lipo-Ru in Tris-HCl buffer. f) Fluorescence emission spectra of Ru (5 μM) and Lipo-Ru (5 μM Ru) in Tris-HCl buffer (Ex 488 nm/Em 600–620 nm). Inset I) Plot showing the difference in fluorescence intensity between Ru (I0) and Lipo-Ru (I). Inset II) Image of Ru (left) and Lipo-Ru (right) obtained with IVIS-200. g) Fluorescent quenching of Lipo-Ru by Triton X-100 (3%) at various times points. Inset I) Plot showing the change in fluorescence intensity over time. I0, 0 min; I, 0–25 min. Inset II) Image of the Ru/DNA plasmid mixture with Triton X-100 obtained with IVIS-200. Increasing time periods from left to right. h) Confocal microscopy images of Lipo-Ru (5 μM Ru). The red fluorescence originates from Ru in the lipid bilayer (Ex 488 nm/Em 600–620 nm). i) Size of Lipo-Ru in 50% fetal bovine serum (FBS) at various time points. Results are presented as the mean ± s.d. of three measurements.
Figure 2
Figure 2
Cellular uptake and internalization of Ru and Lipo-Ru. The Ru dose used in these studies was 5 μM. a) Confocal microscopy images of MDA-MB-231 breast cancer cells incubated with Ru or Lipo-Ru for 6 h. Nuclei were stained in blue with DAPI. b) Quantitative evaluation of cellular uptake based on confocal microscopy imaging. Fluorescent intensity was normalized to the total number of nuclei in each image. Results are representative of twenty randomly selected images from each well, and are presented as the mean ± standard deviation. c) Quantitative flow cytometry analysis of cells incubated with Ru and Lipo-Ru for 6 h. d) Inductively coupled plasma atomic emission spectrometer (ICP-AES) elemental analysis of MDA-MB-231 breast cancer cells incubated with Ru or Lipo-Ru for 0.5 h or 6 h.
Figure 3
Figure 3
Evaluation of cell viability (MTT) and subacute immunotoxicity in vitro. a) Viability of MDA-MB-231 breast cancer cells incubated with various concentrations of empty liposomes for 72 h. b) Viability of MDA-MB-231 breast cancer cells incubated with various concentrations of Lipo-Ru for 24 h, 48 h, or 72 h. c) and d) Enzyme-linked immunosorbent assay (ELISA) measurements of interleukin 6 (IL-6) and tumor necrosis factor alpha (TNF-α) in cell culture media from Raw-264.7 mouse macrophages exposed to phosphate buffered saline (PBS, negative control), empty liposomes (625 μg/ml), Ru (2 μM), Lipo-Ru (2 μM Ru), or lipopolysaccharide (LPS, 0.5 μg/mL, positive control) for 24 h. Results are presented as the mean ± s.d. of triplicates. **, P < 0.01.
Figure 4
Figure 4
Evaluation of DNA damage in response to Lipo-Ru treatment. a) Western blot analysis of ataxia telangiectasia mutated (ATM) and γ-H2AX protein levels in MDA-MB-231 cells exposed to PBS (mock), Ru (3 μM), or Lipo-Ru (3 μM Ru) for 12 h. β-actin was used as a loading control. b) Western blot analysis of ATM and γ-H2AX protein levels in orthotopic MDA-MB-231 breast cancer tumors from mice treated with PBS (mock), Ru, or Lipo-Ru (Ru: 5 mg/kg/week i.v. for four weeks). c) Confocal microscopy images of MDA-MB-231 cells exposed to PBS (mock), Ru (3 μM), or Lipo-Ru (3 μM Ru) for 12 h. DNA double-strand breaks and nuclei were stained with γ-H2AX (in red) and DAPI (in blue), respectively. d) Quantitative evaluation of DNA-double strand breaks in confocal microscopy images. The γ-H2AX staining index was determined by calculating the percentage of γ-H2AX-positive cells in each image. Results are representative of twenty randomly selected images from each tumor.
Figure 5
Figure 5
Cell cycle and cellular apoptosis analysis in MDA-MB-231 cells in response to PBS (mock), Ru, and Lipo-Ru. The Ru dose used in these studies was 5 μM. a) Flow cytometry of PI-labeled cells incubated with PBS, Ru, or Lipo-Ru for 12 h. b) Flow cytometry of annexin VPE and Sytox BlueR labeled cells exposed to PBS, Ru, or Lipo-Ru for 12 h. c) and d) Quantitative flow cytometry analysis of cell cycle ratios and apoptotic cells. Results are presented as mean + s.d. of triplicates. **, P < 0.01. e) Western blot analysis of cells exposed to PBS, Ru, or Lipo-Ru for 12 h. The levels of various proteins involved in apoptosis were measured. β-actin was used as a loading control.
Figure 6
Figure 6
Evaluation of Lipo-Ru tumor accumulation and biodistribution in athymic nude mice bearing orthotopic MDA-MB-231 breast cancer tumors. Lipo-Ru was administered intravenously at a Ru-equivalent dose of 5 mg/kg (n = 3). a) Intravital microscopy images were captured 0.5 h post-injection of Lipo-Ru. Lipo-Ru particles are shown in red and tumor blood vessels in green (FITC-dextran). White arrows point to select particles that have left the tumor vasculature. b) Confocal microscopy images of tumors 2 h post-injection of Lipo-Ru. Lipo-Ru particles are shown in red and highlighted with white arrows. Nuclei are stained in blue with DAPI. (c-e) Biodistribution of Lipo-Ru in tumor tissue and major organs (c) Images of organs obtained with IVIS-200. (d) Quantitative analysis of fluorescent images obtained with IVIS-200. Values are presented as the percentage of total fluorescence intensity/organ and e) the percentage of total fluorescent intensity/g tissue.
Figure 7
Figure 7
Evaluation of Lipo-Ru anticancer activity in athymic nude mice bearing orthotopic MDA-MB-231 breast tumors. Mice were intravenously injected once a week for four weeks with PBS, Ru (5 mg/kg/week), or Lipo-Ru (Ru: 5 mg/kg/week) (n = 5). a) Tumor images at the end of the treatment period. b) Tumor weight measurements at the end of the treatment period. c) Confocal microscopy images of tumor sections stained with Ki-67. d) The Ki-67 staining index was obtained from confocal microscopy images. The index was determined by calculating the percentage of Ki-67-positive cells in each image. Results are representative of twenty randomly selected images from each tumor. e) Confocal microscopy images of tumor sections stained with TUNEL. Apoptotic nuclei are shown in green and normal nuclei in blue (DAPI). f) The apoptotic ratio was obtained from confocal microscopy images. The ratio was determined by calculating the percentage of apoptotic cells in each image. Results are representative of twenty randomly selected images from each tumor. g) Western blot analysis of tumor cells. The levels of various proteins involved in apoptosis were assessed. β-actin was used as a loading control. **, P < 0.01 versus PBS or Ru.
Scheme 1
Scheme 1
Schematic representation of [Ru(phen)2dppz](ClO4)2 (Ru) polypyridyl-containing liposomes (Lipo-Ru). Ru was encapsulated in the bilayer of liposomes. The Lipo-Ru system is designed as a theranostic platform for triple-negative breast cancer (TNBC).

References

    1. Bruijnincx PC, Sadler PJ. Curr Opin Chem Biol. 2008;12:197–206. - PMC - PubMed
    1. Tan CP, Lu YY, Ji LN, Mao ZW. Metallomics. 2014;6:978–995. - PubMed
    1. Arnesano F, Natile G. Coord Chem Rev. 2009;253:2070–2081.
    1. Florea A-M, Büsselberg D. Cancers. 2011;3:1351–1371. - PMC - PubMed
    1. Rajeswaran A, Trojan A, Burnand B, Giannelli M. Lung Cancer. 2008;59:1–11. - PubMed

Publication types

MeSH terms

LinkOut - more resources