. 2017 May 2;8(18):29558-29573.
doi: 10.18632/oncotarget.16365.

BH3-mimetics and BET-inhibitors elicit enhanced lethality in malignant glioma

Affiliations

BH3-mimetics and BET-inhibitors elicit enhanced lethality in malignant glioma

Chiaki Tsuge Ishida et al. Oncotarget. .

Abstract

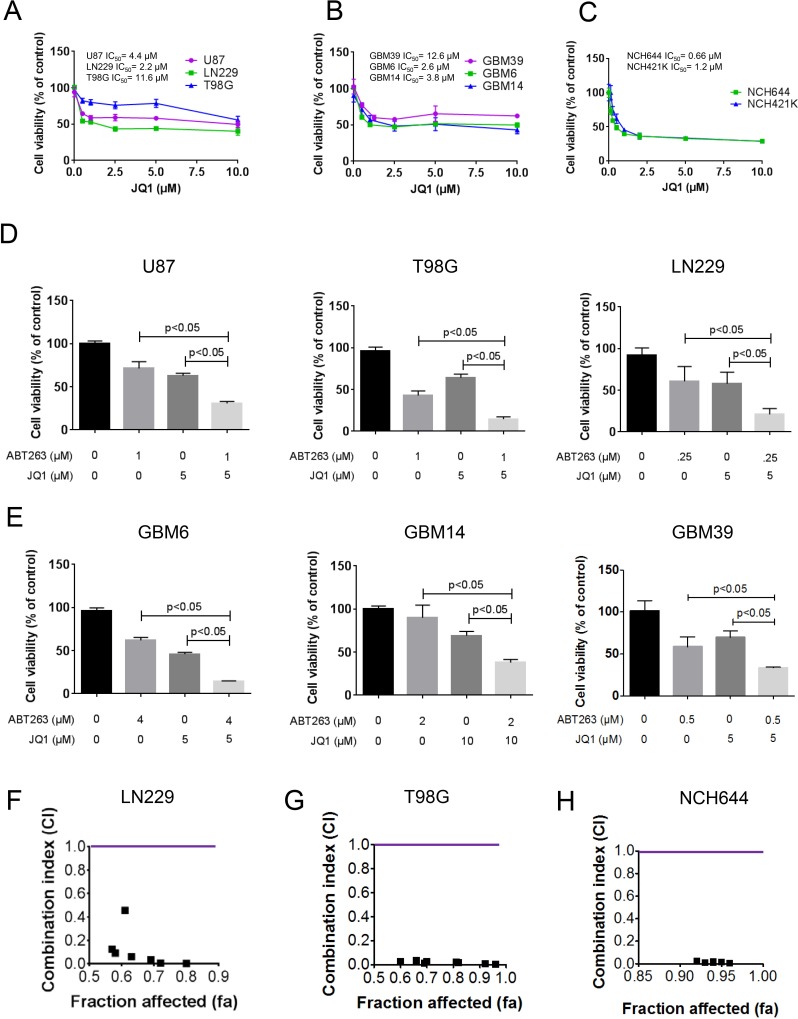
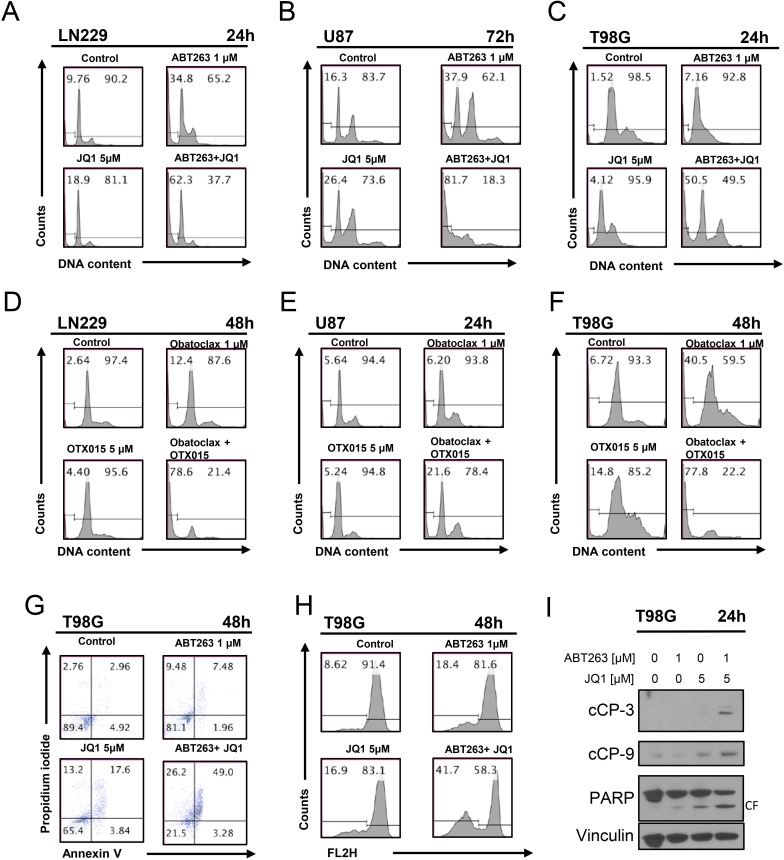
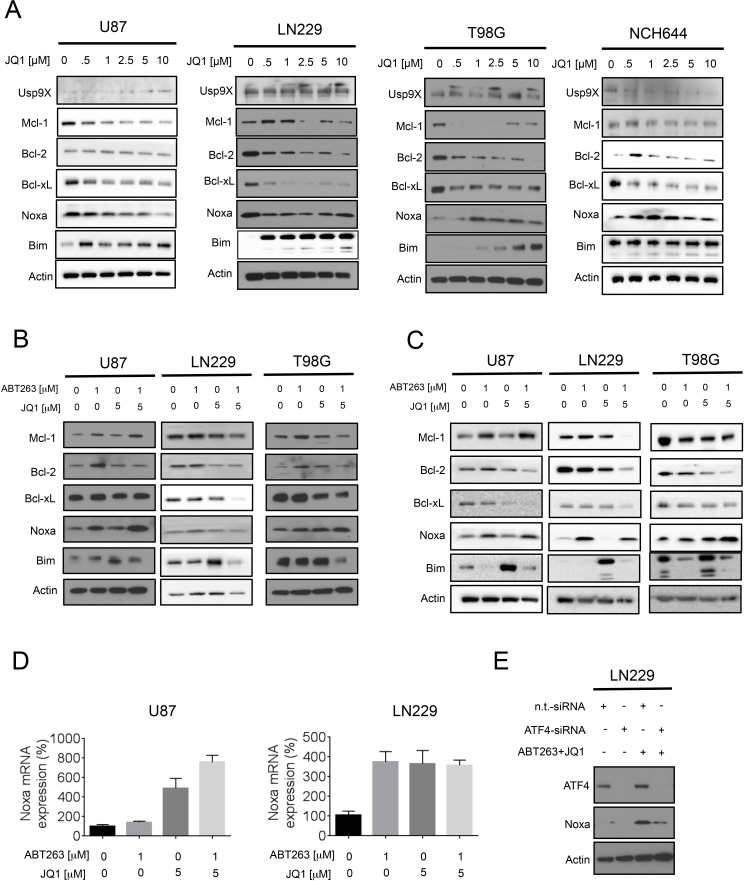
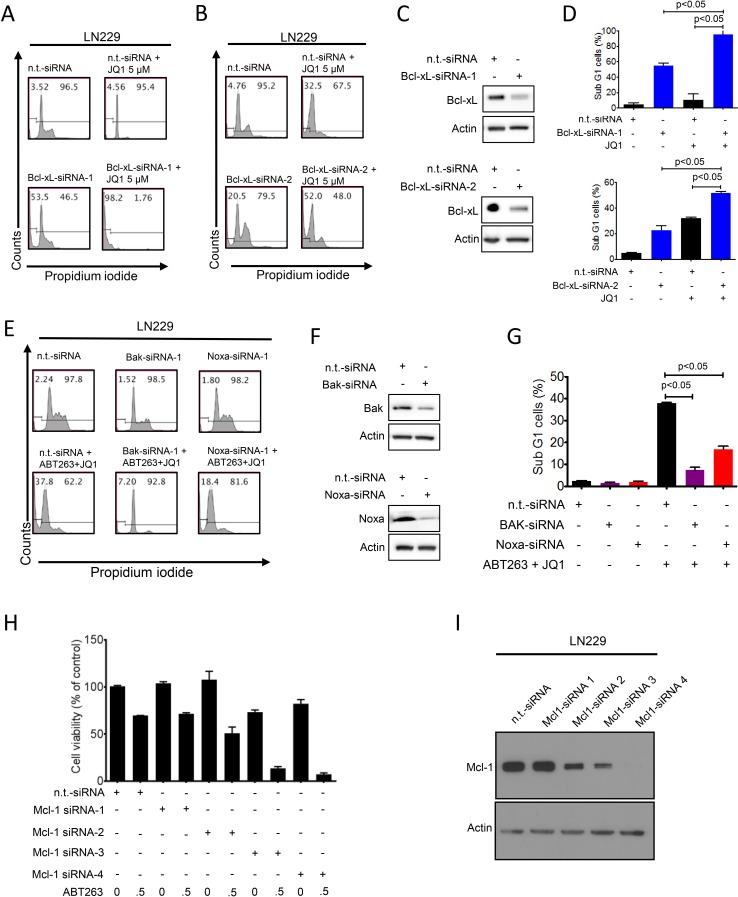
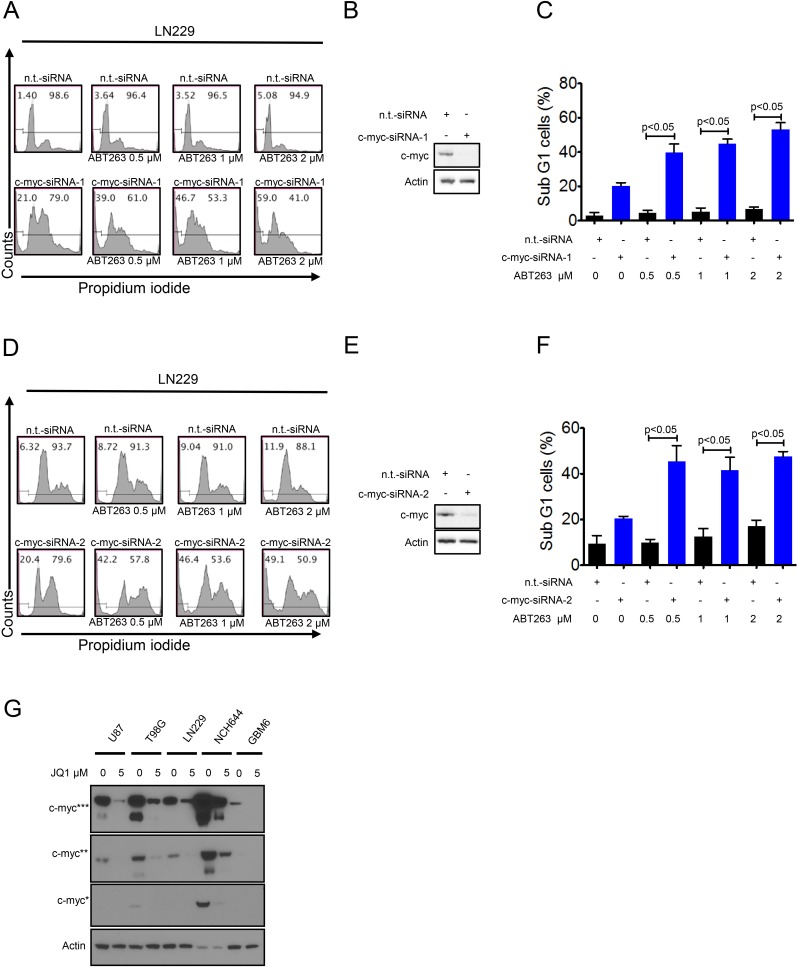
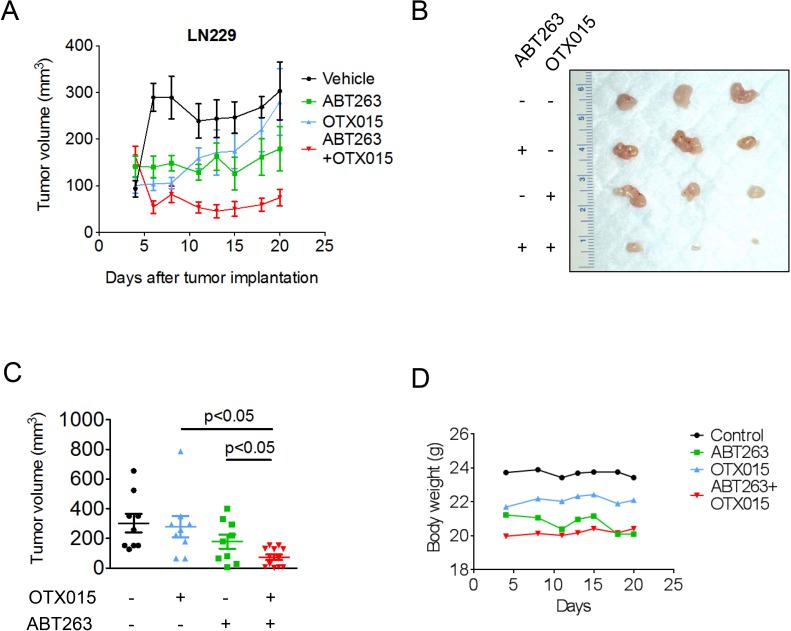
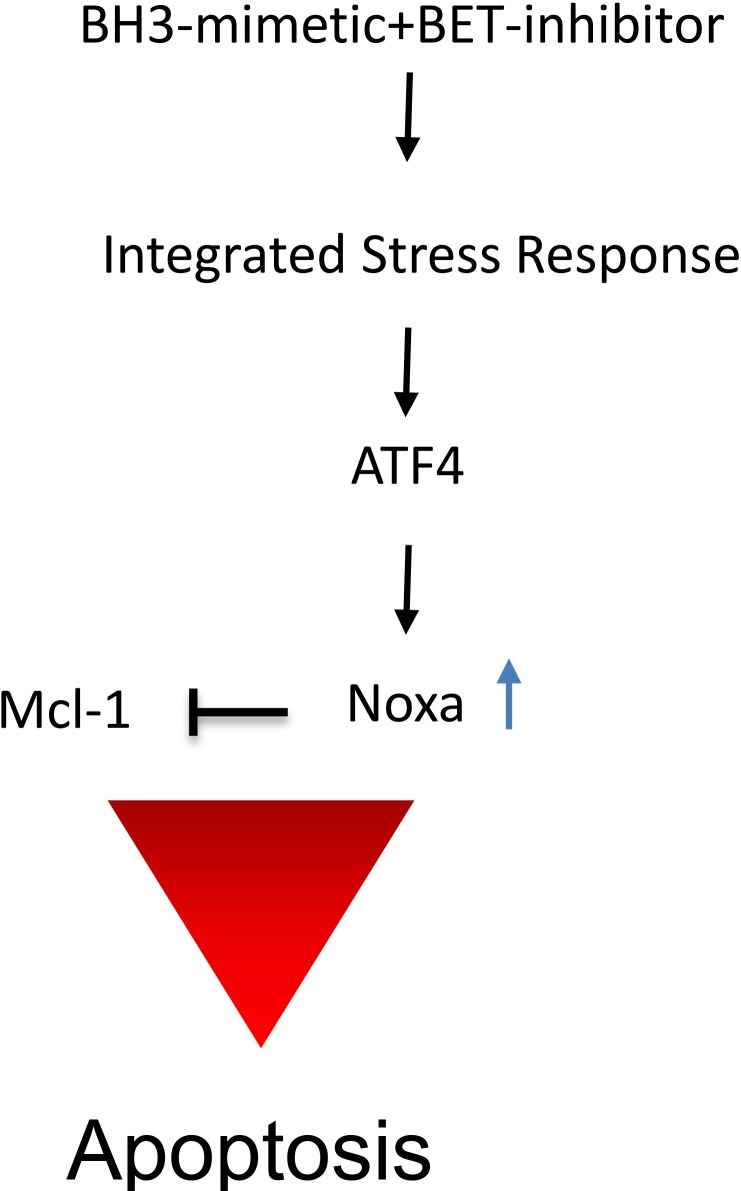
Drug combination therapies remain pivotal for the treatment of heterogeneous malignancies, such as glioblastomas. Here, we show a novel lethal interaction between Bcl-xL and c-myc inhibition accomplished by bromodomain protein inhibitors. Established, patient-derived xenograft and stem cell-like glioma cells were treated with the novel bromodomain protein inhibitors, JQ1 and OTX015, along with BH3-mimetics, ABT263 or Obatoclax. Synergy was assessed by calculation of CI values. Small interfering RNAs (siRNAs) were used for gene silencing and mechanistic studies. In vivo experiments were performed in a glioblastoma xenograft model. Single treatments with JQ1 and OTX015 had only moderate effects on the reduction of cellular viability. However, the combination treatment of BH3-mimetics along with JQ1 or OTX015 resulted in a highly synergistic reduction of cellular viability in a broad range of different model systems of malignant glioma. Similarly, knockdown of c-myc sensitized glioma cells for ABT263 mediated cell death. The enhanced loss of cellular viability in the combination treatment was mediated by activation of apoptosis with dissipation of mitochondrial membrane potential and caspase cleavage. The combination treatment led to a modulation of anti- and pro-apoptotic Bcl-2 family members with an increase in pro-apoptotic Noxa mediated by ATF4. Small interfering RNA mediated knockdown of Bak and Noxa protected glioma cells from ABT263/JQ1 mediated apoptosis. Finally, the combination treatment of ABT263 and OTX015 resulted in a regression of tumors and a significantly smaller tumor size as compared to single or vehicle treated tumors. Thus, these results warrant clinical testing for the drug combination of BH3-mimetics along with bromodain protein inhibitors.

Keywords: BH3-mimetics; Bcl-xL; apoptosis; brain cancer; c-myc.


Conflict of interest statement

CONFLICTS OF INTEREST

The authors declare that no conflicts of interest exist.

Figures

Figure 1
Figure 1. Combined treatment with ABT263 and the BET-inhibitor (JQ1) results in a synergistic antiproliferative effect across a wide spectrum of human glioma cells
A.-C. U87MG, LN229, T98G established glioblastoma cell lines, GBM39, GBM6 and GBM14 patient-derived xenograft cultures and NCH644 and NCH421k stem cell-like glioma cultures were treated as indicated with JQ1. After 72h of treatment, CellTiter-Glo assays were performed. IC50 values were calculated. Column: mean. Error bar: standard deviation (SD). n = 3. D., E., U87MG, LN229, T98G established glioblastoma cell lines, GBM39, GBM6 and GBM14 patient-derived xenograft cultures were treated with ABT263, JQ1 or the combination of both. After 72h of treatment, CellTiter-Glo assays were performed. Column: mean. Error bar: standard deviation (SD). n = 3. Statistical analysis was performed and p values were calculated. A p-value of less than 0.05 was considered statistically significant. F.-H., LN229, T98G and NCH644 glioblastoma cells were treated for 72 hours with ABT263, JQ1 or the combination and analyzed by CellTiter-Glo assay. CI values and fraction affected were calculated using the CompuSyn software (ComboSyn, Inc., Paramus, NJ, U.S.A.). Data points located below 1 (CI value less than 1) indicate a synergistic drug-drug interaction and data points larger than 1 indicate an antagonistic drug-drug interaction. Some data points overlap and are therefore not represented on the graphical chart. A colored line highlights CI value 1. For individual values, please refer to Table 1.
Figure 2
Figure 2. Combined treatment with JQ1 and ABT263 yields enhanced induction of apoptosis
A., B., C. representative histograms of LN229, U87 and T98G glioblastoma cells that were treated for the indicated time points as indicated with JQ1, ABT263 or both prior to staining with propidium iodide and flow cytometric analysis. D.-F., LN229, U87 and T98G glioblastoma cells were treated for the indicated time points as indicated with OTX015, Obatoclax or the combination. G., representative histograms of T98G glioblastoma cells treated with ABT263, JQ1 or the combination as indicated for 48h prior to staining for annexin V and propidium iodide and flow cytometric analysis. H., representative histograms of T98G glioblastoma cells that were treated with JQ1, ABT263, or both prior to staining with TMRE and flow cytometric analysis. I., T98G glioblastoma cells were treated for 24 h with JQ1, ABT263 or the combination. Whole-cell extracts were examined by Western blot analysis for PARP, cleaved caspase 9 (C9) and cleaved caspase 3. Vinculin Western blot analysis was performed to confirm equal protein loading.
Figure 3
Figure 3. Treatment with JQ1 and the combination treatment (ABT263+JQ1) modulates protein expression of the Bcl-2 family of proteins
A., Established glioblastoma cells, U87,LN229, T98G and stem cell-like glioma cells, NCH644 were treated with increasing concentrations of JQ1 as indicated for 72h. Whole cell extracts were collected and Western blot analysis was performed for Usp9X, Mcl-1, Bcl-2, Bcl-xL, Noxa and Bim. Actin served as loading control. B., C. U87, LN229 and T98G cells were treated with ABT263, JQ1 or the combination of both for 24h (B) and 48h (C). Whole cell extracts were collected and Western blot analysis was performed for Mcl-1, Bcl-2, Bcl-xL, Noxa and Bim. Actin served as loading control. D., U87 and LN229 cells were treated with ABT263, JQ1 or the combination of both. After 7h cells were harvested and RNA was isolated. Real-time PCR for Noxa was conducted and the results were normalized to 18S. Column: mean. Error bar: standard error of measurement (SEM). G, LN229 cells were transfected with non-targeting (n.t.) siRNA or an ATF4 specific siRNA. 72h after transfection cells were treated with ABT263 and JQ1 for 7h. Cells were harvested and analyzed by western blotting for ATF4 and Noxa. Actin serves as loading control.
Figure 4
Figure 4. Functional implications of Bcl-2 family members in the combined treatment of ABT263 and JQ1
A.-D., Representative flow plots of LN229 cells that were treated with n.t.-siRNA or 2 different Bcl-xL siRNAs prior to additional treatment with either solvent or JQ1. Staining for propidium iodide and flowcytometric analysis was performed to determine the fraction of subG1 cells. The results were quantified (D). Knockdown of Bcl-xL was confirmed by Western Blot analysis (C). Actin served as loading control (C). E.-G. LN229 cells were treated with n.t.-siRNA or Noxa-siRNA or Bak-siRNA prior to treatment with solvent or the combination of 1μM ABT263 and 5μM JQ1 as indicated for 24 h. Staining for propidium iodide and flow cytometric analysis was performed to determine the fraction of subG1 cells. Representative flow plots are shown (E). The quantifications are shown in (G). Noxa and Bak knockdowns were confirmed by Western blot analysis (F). H., LN229 cells were transfected with n.t.-siRNA or four individual Mcl-1 siRNAs for 48h. Subsequently, cells were treated with ABT263 and analyzed by CellTiter-Glo assay. The concentrations for ABT263 are in μM. Column: mean. Error bar: standard deviation (SD). I., LN229 cells were transfected as in G and analyzed for protein expression of Mcl-1. Actin served as a loading control.
Figure 5
Figure 5. Silencing of c-myc sensitizes for Bcl-xL inhibition
A., LN229 cells were transfected with n.t.-siRNA or c-myc-siRNA-1 prior to treatment with solvent or ABT263 as indicated for 24 h. Staining for propidium iodide and flow cytometric analysis were performed to determine the fraction of subG1 cells. Representative flow plots are shown. The quantifications are shown in C. c-myc knockdown was confirmed by Western blot analysis B. D., LN229 cells were transfected with n.t.-siRNA or c-myc-siRNA-2 prior to treatment with solvent or ABT263 as indicated for 24 h. Staining for propidium iodide and flow cytometric analysis were performed to determine the fraction of subG1 cells. Representative flow plots are shown. The quantifications are shown in F. c-myc knockdown was confirmed by Western blot analysis E. G. U87, T98G, LN229 (established glioblastoma cells), NCH644 (stem cell-like glioma cells) and GBM6 (patient-derived xenograft) cells were treated with JQ1 for 72 hours. Protein extracts were prepared and samples were analyzed by conventional western blot analysis for the expression of c-myc. Actin serves as a loading control. Multiple exposures are presented due to the fact that cells express different baseline levels of c-myc. * indicate different exposure times for c-myc protein.
Figure 6
Figure 6. Combined treatment with ABT263 and OTX015 leads to a regression of glioblastoma xenograft tumors
A.-D., 1×10⁶ LN229 glioblastoma cells were implanted subcutaneously. After tumor formation, groups were formed. Treatment was started on day 4 and suspended on day 20. Animals were treated intraperitoneally with vehicle (n = 9), OTX015 (37.5 mg/kg) (n = 9), ABT263 (37.5 mg/kg) (n = 9) or both agents n = 12) (5 days on, 2 days off). Tumor growth curves show the development of tumor size for each treatment group. Data are presented as mean and SEM. B, Photograph of representative tumors is shown. C, Scatter plots display the quantitative representation of the tumor size among the different treatments toward the end of the experiment. Data are presented as mean and SEM D, Body weights of the animals are provided throughout of the treatment (B). Days are meant as “Days after tumor implantation”. Shown are means. Control group is the same as in A (Vehicle = Control).
Figure 7
Figure 7. Summary of the proposed mechanism of action by the drug combination
The combination treatment of BET-inhibitors and BH3-mimetics causes a stress response with an increase of ATF4 and subsequent up regulation of pro-apoptotic Noxa, interfering with Mcl-1 function, leading to induction of apoptosis.

Comment in

  • BET-inhibitors as sensitizers for BH3-mimetics.
    Ishida CT, Karpel-Massler G, Siegelin MD. Ishida CT, et al. Aging (Albany NY). 2017 Jun 26;9(6):1475-1476. doi: 10.18632/aging.101259. Aging (Albany NY). 2017. PMID: 28657545 Free PMC article. No abstract available.

References

    1. Hegi ME, Diserens AC, Gorlia T, Hamou MF, de Tribolet N, Weller M, Kros JM, Hainfellner JA, Mason W, Mariani L, Bromberg JE, Hau P, Mirimanoff RO, et al. MGMT gene silencing and benefit from temozolomide in glioblastoma. N Engl J Med. 2005;352:997–1003. doi: 10.1056/NEJMoa043331. - DOI - PubMed
    1. Wei W, Shin YS, Xue M, Matsutani T, Masui K, Yang H, Ikegami S, Gu Y, Herrmann K, Johnson D, Ding X, Hwang K, Kim J, et al. Single-Cell Phosphoproteomics Resolves Adaptive Signaling Dynamics and Informs Targeted Combination Therapy in Glioblastoma. Cancer Cell. 2016;29:563–73. doi: 10.1016/j.ccell.2016.03.012. - DOI - PMC - PubMed
    1. Toyoshima M, Howie HL, Imakura M, Walsh RM, Annis JE, Chang AN, Frazier J, Chau BN, Loboda A, Linsley PS, Cleary MA, Park JR, Grandori C. Functional genomics identifies therapeutic targets for MYC-driven cancer. Proc Natl Acad Sci U S A. 2012;109:9545–50. doi: 10.1073/pnas.1121119109. - DOI - PMC - PubMed
    1. Zuber J, Shi J, Wang E, Rappaport AR, Herrmann H, Sison EA, Magoon D, Qi J, Blatt K, Wunderlich M, Taylor MJ, Johns C, Chicas A, et al. RNAi screen identifies Brd4 as a therapeutic target in acute myeloid leukaemia. Nature. 2011;478:524–8. doi: 10.1038/nature10334. - DOI - PMC - PubMed
    1. Cheng Z, Gong Y, Ma Y, Lu K, Lu X, Pierce LA, Thompson RC, Muller S, Knapp S, Wang J. Inhibition of BET bromodomain targets genetically diverse glioblastoma. Clin Cancer Res. 2013;19:1748–59. doi: 10.1158/1078-0432.CCR-12-3066. - DOI - PMC - PubMed

MeSH terms