. 2017 Apr 18;12(4):e0175599.
doi: 10.1371/journal.pone.0175599. eCollection 2017.

Cytoskeletal stability and metabolic alterations in primary human macrophages in long-term microgravity

Affiliations

Cytoskeletal stability and metabolic alterations in primary human macrophages in long-term microgravity

Svantje Tauber et al. PLoS One. .

Abstract

The immune system is one of the most affected systems of the human body during space flight. The cells of the immune system are exceptionally sensitive to microgravity. Thus, serious concerns arise, whether space flight associated weakening of the immune system ultimately precludes the expansion of human presence beyond the Earth's orbit. For human space flight, it is an urgent need to understand the cellular and molecular mechanisms by which altered gravity influences and changes the functions of immune cells. The CELLBOX-PRIME (= CellBox-Primary Human Macrophages in Microgravity Environment) experiment investigated for the first time microgravity-associated long-term alterations in primary human macrophages, one of the most important effector cells of the immune system. The experiment was conducted in the U.S. National Laboratory on board of the International Space Station ISS using the NanoRacks laboratory and Biorack type I standard CELLBOX EUE type IV containers. Upload and download were performed with the SpaceX CRS-3 and the Dragon spaceship on April 18th, 2014 / May 18th, 2014. Surprisingly, primary human macrophages exhibited neither quantitative nor structural changes of the actin and vimentin cytoskeleton after 11 days in microgravity when compared to 1g controls. Neither CD18 or CD14 surface expression were altered in microgravity, however ICAM-1 expression was reduced. The analysis of 74 metabolites in the cell culture supernatant by GC-TOF-MS, revealed eight metabolites with significantly different quantities when compared to 1g controls. In particular, the significant increase of free fucose in the cell culture supernatant was associated with a significant decrease of cell surface-bound fucose. The reduced ICAM-1 expression and the loss of cell surface-bound fucose may contribute to functional impairments, e.g. the activation of T cells, migration and activation of the innate immune response. We assume that the surprisingly small and non-significant cytoskeletal alterations represent a stable "steady state" after adaptive processes are initiated in the new microgravity environment. Due to the utmost importance of the human macrophage system for the elimination of pathogens and the clearance of apoptotic cells, its apparent robustness to a low gravity environment is crucial for human health and performance during long-term space missions.


Conflict of interest statement

Competing Interests: JS is an employee of Airbus Defense and Space GmbH. This does not alter our adherence to PLOS ONE policies on sharing data and materials.

Figures

Fig 1
Fig 1. Mission profile of CRS-3 and experimental concept.
(a) Mission timeline of the SpaceX CRS-3 mission and experimental concept. The experiment comprised two sample groups which were transported to the ISS. These were exposed to microgravity. Cells of first group were fixed after 11 days of microgravity. The cells of the second group were fixed after retrieval of the cells after 30 days of microgravity. Additionally, two groups were incubated at 1g on ground, one group with cells “facing up” and one group with cells “facing down". (b) Launch of the SpaceX CRS-3 mission on April 18th, 2014, Falcon 9 rocket with Dragon spaceship from Cape Canaveral SLC-40. c. The Dragon spaceship before berthing on April 20th, 2014.
Fig 2
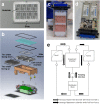
Fig 2. In-flight hardware: Biorack type I standard CELLBOX EUE type IV container.
(a) Polycarbonate slide serving as cultivation surface for primary human macrophages. The slides are segmented into 16 subslides. (b) Individual parts of the experiment core. (c) Assembled experiment core. View through the transparent lid on the cell culture chamber with the polycarbonate slides. (d) Assembled experiment insert, view on tanks. (e) Scheme of fluid exchanges. Pump can operate in both directions; check-valves determine from which of the two tanks liquid is transported into the cell culture chamber.
Fig 3
Fig 3. “NanoRacks Astrium Centrifuge” (U.S. National Laboratory) containing Biorack type I standard CELLBOX EUE type IV (Photos: Jesper Rais).
(a) Biorack type I container with inserted CELLBOX EUE type IV. (b) “NanoRacks Astrium Centrifuge” with static and centrifuge slots. (c) “NanoRacks Astrium Centrifuge” with integrated EUE inserts.
Fig 4
Fig 4. Quantification of cell area and cell number of primary human macrophages exposed to different gravity conditions.
(a) The cell area was measured by immunofluorescent staining of the cell membrane and subsequent half-automated assessment of the stained area. Data points represent the mean area of all cells on one picture. 45 microscopic pictures (464–607 cells) were analyzed per gravity condition. Sample groups 1g facing down (1293 +/- 52.48 μm2, n = 45), 1g facing up (1391 +/- 59.93 μm2, n = 45), 30d-μg (1437 +/- 60.04 μm2, n = 45) and 11d-μg (1643 +/- 59.6 μm2, n = 45) are demonstrated. Single data points and means are shown for each experimental group (*p<0.1, **p<0.05, ***p<0.005). (b) The cell number was measured by fluorescent staining of the cell membrane and subsequent half-automated cell-counting. Data points represent the number of all cells on one picture. 45 microscopic pictures were analyzed per gravity condition. Sample groups 1g facing down (11.44 +/- 0.84, n = 45), 1g facing up (13.49 +/- 0.721, n = 45), 30d-μg (10.31 +/- 0.9265, n = 45) and 11d-μg (15.48 +/- 1.184, n = 44) are demonstrated. Single data points and means are shown for each experimental group (*p<0.1, **p<0.05, ***p<0.005).
Fig 5
Fig 5. Quantification of surface-bound CD18 and ICAM-1 of primary human macrophages exposed to different gravity conditions.
Surface-bound CD18 and ICAM-1 were visualized by immunofluorescent staining and subsequently analyzed quantitatively. Data are expressed as relative fluorescent intensity (RFI) and represent the mean RFI of all cells on one picture. (a) CD18: 16–24 pictures (187–390 cells) were analyzed per gravity condition. (b) ICAM-1: 24–48 pictures (240–838 cells) were analyzed per gravity condition. Sample groups 1g facing up (26.84 +/- 2.87, n = 24), 1g facing down (14.22 +/- 1.276, n = 24), 30d-μg (8.533 +/- 0.3942, n = 24) and 11d-μg (14.67 +/- 1.28, n = 48) are demonstrated. Single data points and means are shown for each experimental group (*p<0.1, **p<0.05, ***p<0.005). (c) Microscopic images of primary human macrophages exposed to different gravity conditions. CD18 was stained (red) and the cytoplasm was stained with CellMask (yellow). Controls without anti-CD18 antibody and an overlay of CD18 and CellMask are shown. Scale-bar = 25 μm. (d) Microscopic images of primary human macrophages exposed to different gravity conditions. ICAM-1 was stained (red) and the cytoplasm was stained with CellMask (yellow). Controls without anti-ICAM antibody and an overlay of ICAM-1 and CellMask are shown. Scale-bar = 25 μm.
Fig 6
Fig 6. Quantification of surface-bound CD14 of primary human macrophages exposed to different gravity conditions.
Surface-bound CD14 was measured by immunofluorescence staining and subsequent quantitative analysis. (a) Data were expressed as relative fluorescent intensity (RFI). Data points represent the mean RFI of all cells on one picture. 8–24 pictures (431–2776 cells) were analyzed per gravity condition. Samples groups 1g facing up (260.8 +/- 48.3, n = 16), 1g facing down (64.48 +/- 7.715, n = 24), 30d-μg (84.54 +/- 7.435, n = 8) and 11d-μg (139 +/- 15.11, n = 24) are demonstrated. Single data points and means are shown for each experimental group (*p<0.1, **p<0.05, ***p<0.005). (b) Microscopic images of primary human macrophages exposed to different gravity conditions. CD14 was stained (red) and the cytoplasm was stained with CellMask (yellow). Controls without anti-CD14 antibody and an overlay of CD14 and CellMask are shown. Scale-bar = 100 μm.
Fig 7
Fig 7. Quantification of actin and vimentin of primary human macrophages exposed to different gravity conditions.
Cytoskeletal actin and vimentin was measured by immunofluorescence staining and subsequent quantitative analysis. Data are expressed as relative fluorescent intensity (RFI). Data points represent the mean RFI of all cells on one picture. (a) F-actin: 24–48 pictures (491–1096 cells) were analyzed per gravity condition. Sample groups 1g facing up (278.5 +/- 28.31, n = 32), 1g facing down (421.9 +/- 24.56, n = 32), 30d-μg (121.3 +/- 10.67, n = 24) and 11d-μg (355 +/- 24.73, n = 48) are demonstrated. Single data points and means are shown for each experimental group (*p<0.1, **p<0.05, ***p<0.005). (b) Vimentin: 24–48 pictures (1944–4316 cells) were analyzed per gravity condition. Sample groups 1g facing up (419.2 +/- 30.85, n = 24) 1g facing down (396.5 +/- 26.6, n = 32), 30d-μg (45.88 +/- 2.00, n = 32) and 11d-μg (307.6 +/- 14.14, n = 48) are demonstrated. Single data points and means are shown for each experimental group (*p<0.1, **p<0.05, ***p<0.005). (c) Microscopic images of primary human macrophages exposed to different gravity conditions. F-actin was stained with phalloidin (red) and the cytoplasm was stained with CellMask (yellow). Controls without phalloidin and an overlay of actin and CellMask are shown. Scale-bar = 25μm. (d) Microscopic images of primary human macrophages exposed to different gravity conditions. Vimentin was stained (red) and the cytoplasm was stained with CellMask (yellow). Controls without anti-vimentin antibody and an overlay of vimentin and CellMask are shown. Scale-bar = 100 μm.
Fig 8
Fig 8. Confocal microscopy analysis of the cytoskeletal structure.
(a) Qualitative analysis of cytoskeletal F-actin: 130–146 cells were analyzed per experimental group. Bars represent the percentage of the cells in which the indicated micromorphology of F-actin was visible (strings, small clusters, big clusters, clouds, or no F-actin-staining). The percentage of cells containing filamentous actin is much higher in the 1g-facing down control group than in the 30d-μg group. There is a smaller number of cells with actin clusters in the 11d-μg group compared to the 30d-μg group. Means and standard errors are shown for each experimental group (*p<0.1, **p<0.05, ***p<0.01). (b) Qualitative analysis of cytoskeletal vimentin: 46–245 cells were analyzed per experimental group. Bars represent the percentage of the cells in which the indicated micromorphology of F-actin was visible (strings, clusters, clusters, clouds, or no vimentin-staining). Means and standard errors are shown for each experimental group (*p<0.1, **p<0.05, ***p<0.01). (c) Representative pictures of cytoskeletal actin staining: The experimental groups "1g-facing down" (I-II), "1g-facing up" (III-IV), "11 days-μg" (V-VI), and "30 days-μg" (VII-VIII) are shown. Only HCS CellMask Blue-positive and TUNEL staining-negative cells were analyzed. Single stain of actin (I, III, V, VII) and overlay of all stainings (II, IV, VI, VIII) (green: TUNEL staining, yellow: HCS CellMask, blue: DRAQ5, red: filamentous actin staining with phalloidin-Alexa Fluor 568). (d) Representative pictures of cytoskeletal vimentin staining: Confocal microscopy analysis of the cytoskeletal protein vimentin. The experimental groups "1g-facing down" (I-II), "1g-facing up" (III-IV), "11 days-μg" (V-VI), and "30 days-μg" (VII-VIII) are shown. Only HCS CellMask Blue-positive and TUNEL staining-negative cells were analyzed. Single stain of cytoskeletal vimentin (I, III, V, VII) and overlay of all stainings (II, IV, VI, VIII) (green: TUNEL staining, yellow: HCS CellMask Blue, blue: DRAQ5, red: cytoskeletal vimentin stained with mouse anti-vimentin and anti-mouse Alexa Fluor 568). (e) Representative pictures of the different micromorphological appearances of the vimentin an actin which were used for the quantification shown in fig 8a and b. (blue: DRAQ5, red: cytoskeletal vimentin stained with mouse anti-vimentin and anti-mouse Alexa Fluor 568 / filamentous actin stained with phalloidin-Alexa Fluor 568).
Fig 9
Fig 9. GC–TOF–MS metabolite analysis in cell culture supernatants of primary human macrophages after 11d in microgravity compared to 1g ground controls.
Metabolite abundance of 8 significantly changed metabolites are shown, 68 out of 74 analyzed metabolites were not significantly altered. Single data points and means are shown for each experimental group (*p<0.05) and represent values from 3 (1g) or 5 (μg) independent experimental units.
Fig 10
Fig 10. Quantification of fucose in the cell culture supernatant and on the cell surface of primary human macrophages exposed to different gravity conditions.
(a) Fucose in the cell culture supernatant was measured by GC–TOF–MS. (b) Surface-bound fucose on cells was measured by fluorescence staining and subsequent quantitative analysis. Data are expressed as relative fluorescent intensity (RFI). Data points represent the mean RFI of all cells on one picture. 32–64 pictures (502–1121 cells) were analyzed per gravity condition. Sample groups 1g facing up (583.7 +/- 33.0, n = 32), 1g facing down (522.3 +/- 33.6, n = 32), 30d-μg (351.9 +/- 24.0, n = 32) and 11d-μg samples (434.0 +/- 17.3, n = 64) are demonstrated. Single data points and means are shown for each experimental group (*p<0.1, **p<0.05, ***p<0.005). c. Microscopic images of primary human macrophages exposed to different gravity conditions. Cells stained against fucose (red), differential interference contrast (DIC) pictures, controls (without lectin) and overlay of DIC and fucose are shown. Scale-bar = 25 μm.

Similar articles

Cited by

References

    1. Comet B. Limiting factors for human health and performance: microgravity and re-duced gravity. In: Study on the survivability and adaptation of humans to long-duration interplanetary and planetary environments; Technical Note 2: Critical assessments of the limiting factors for human health and performance and recommendation of countermeasures. HUMEX-TN-002, 2001.
    1. Guéguinou N, Huin-Schohn C, Bascove M, Bueb JL, Tschirhart E, Legrand-Frossi C, et al. Could spaceflight-associated immune system weakening pre-clude the expansion of human presence beyond Earth's orbit?, J Leukoc Biol. 2009; 86: 1027–1038 doi: 10.1189/jlb.0309167 - DOI - PubMed
    1. Horneck G, Facius R, Reichert M, Rettberg P, Seboldt W, Manzey D, et al. HUMEX, a study on the survivability and adaptation of humans to long-duration exploratory missions, part II: Missions to Mars. In: Advances in Space Research, Mercury, Mars and Saturn, vol. 38; 2006. pp. 752–759 - PubMed
    1. Frippiat JP, Crucian BE, de Quervain DJF, Grimm D, Montano N, Praun S, et al. Towards human exploration of space: The THESEUS review series on immunology research priorities. npj Microgravity 2016; 2: 16040 - PMC - PubMed
    1. Cogoli A, Bechler B, Müller O, Hunzinger E. Effect of microgravity on lymphocyte activation. In: Biorack on Spacelab D1. European Space Agency, Ed. Paris; 1988, pp. 89–100.