Estrogen Deficiency Exacerbates Type 1 Diabetes-Induced Bone TNF-α Expression and Osteoporosis in Female Mice
- PMID: 28419209
- PMCID: PMC5505215
- DOI: 10.1210/en.2016-1821
Estrogen Deficiency Exacerbates Type 1 Diabetes-Induced Bone TNF-α Expression and Osteoporosis in Female Mice
Abstract
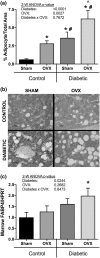
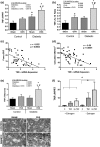
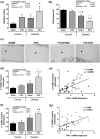
Estrogen deficiency after menopause is associated with rapid bone loss, osteoporosis, and increased fracture risk. Type 1 diabetes (T1D), characterized by hypoinsulinemia and hyperglycemia, is also associated with bone loss and increased fracture risk. With better treatment options, T1D patients are living longer; therefore, the number of patients having both T1D and estrogen deficiency is increasing. Little is known about the mechanistic impact of T1D in conjunction with estrogen deficiency on bone physiology and density. To investigate this, 11-week-old mice were ovariectomized (OVX), and T1D was induced by multiple low-dose streptozotocin injection. Microcomputed tomographic analysis indicated a marked reduction in trabecular bone volume fraction (BVF) in T1D-OVX mice (~82%) that was far greater than the reductions (~50%) in BVF in either the OVX and T1D groups. Osteoblast markers, number, and activity were significantly decreased in T1D-OVX mice, to a greater extent than either T1D or OVX mice. Correspondingly, marrow adiposity was significantly increased in T1D-OVX mouse bone. Bone expression analyses revealed that tumor necrosis factor (TNF)-α levels were highest in T1D-OVX mice and correlated with bone loss, and osteoblast and osteocyte death. In vitro studies indicate that estrogen deficiency and high glucose enhance TNF-α expression in response to inflammatory signals. Taken together, T1D combined with estrogen deficiency has a major effect on bone inflammation, which contributes to suppressed bone formation and osteoporosis. Understanding the mechanisms/effects of estrogen deficiency in the presence of T1D on bone health is essential for fracture prevention in this patient population.
Copyright © 2017 Endocrine Society.
Figures


Similar articles
-
Glutamic acid ameliorates estrogen deficiency-induced menopausal-like symptoms in ovariectomized mice.Nutr Res. 2015 Sep;35(9):774-83. doi: 10.1016/j.nutres.2015.06.006. Epub 2015 Jun 16. Nutr Res. 2015. PMID: 26144993
-
Ovariectomy-induced bone loss varies among inbred strains of mice.J Bone Miner Res. 2005 Jul;20(7):1085-92. doi: 10.1359/JBMR.050307. Epub 2005 Mar 7. J Bone Miner Res. 2005. PMID: 15940361
-
Effect of the combinatory mixture of Rubus coreanus Miquel and Astragalus membranaceus Bunge extracts on ovariectomy-induced osteoporosis in mice and anti-RANK signaling effect.J Ethnopharmacol. 2014 Feb 3;151(2):951-9. doi: 10.1016/j.jep.2013.12.008. Epub 2013 Dec 12. J Ethnopharmacol. 2014. PMID: 24333364
-
Cellular and molecular effects of growth hormone and estrogen on human bone cells.APMIS Suppl. 1997;71:1-30. APMIS Suppl. 1997. PMID: 9357492 Review.
-
Role of nitric oxide in type 1 diabetes-induced osteoporosis.Biochem Pharmacol. 2022 Mar;197:114888. doi: 10.1016/j.bcp.2021.114888. Epub 2021 Dec 28. Biochem Pharmacol. 2022. PMID: 34968494 Review.
Cited by
-
Efficacy and Safety of Duhuo Jisheng Decoction for Postmenopausal Osteoporosis: A Systematic Review and Meta-Analysis.Evid Based Complement Alternat Med. 2020 Sep 15;2020:6957825. doi: 10.1155/2020/6957825. eCollection 2020. Evid Based Complement Alternat Med. 2020. PMID: 33014108 Free PMC article. Review.
-
Postmenopausal osteoporosis: Effect of moderate-intensity treadmill exercise on bone proteomics in ovariectomized rats.Front Surg. 2023 Jan 6;9:1000464. doi: 10.3389/fsurg.2022.1000464. eCollection 2022. Front Surg. 2023. PMID: 36684175 Free PMC article.
-
Study on Omentin-1 and miR-502-3p in osteoporotic fracture.J Musculoskelet Neuronal Interact. 2021 Jun 1;21(2):308-316. J Musculoskelet Neuronal Interact. 2021. PMID: 34059576 Free PMC article.
-
Insights and implications of sexual dimorphism in osteoporosis.Bone Res. 2024 Feb 18;12(1):8. doi: 10.1038/s41413-023-00306-4. Bone Res. 2024. PMID: 38368422 Free PMC article. Review.
-
Integrated Strategy of Network Pharmacological Prediction and Experimental Validation Elucidate Possible Mechanism of Bu-Yang Herbs in Treating Postmenopausal Osteoporosis via ESR1.Front Pharmacol. 2021 May 11;12:654714. doi: 10.3389/fphar.2021.654714. eCollection 2021. Front Pharmacol. 2021. PMID: 34045964 Free PMC article.
References
-
- Armas LAG, Recker RR. Pathophysiology of osteoporosis: new mechanistic insights. Endocrinol Metab Clin North Am. 2012;41(3):475–486. - PubMed
-
- What is osteoporosis and what causes it?. National Osteoporosis Foundation. https://www.nof.org/patients/what-is-osteoporosis/. Accessed April 27, 2017.
-
- Polymeris A, Michalakis K, Sarantopoulou V. Secondary osteoporosis - an endocrinological approach focusing on underlying mechanisms. Endocr Regul. 2013;47(3):137–148. - PubMed
-
- Drever A. Bone health and osteoporosis. Pract Nurs. 2009;38(6):13–22.
Publication types
MeSH terms
Substances
Grants and funding
LinkOut - more resources
Full Text Sources
Other Literature Sources
Medical
Molecular Biology Databases

