

Extremely thick cell walls and low mesophyll conductance: welcome to the world of ancient living!
- PMID: 28419340
- PMCID: PMC5441924
- DOI: 10.1093/jxb/erx045
Extremely thick cell walls and low mesophyll conductance: welcome to the world of ancient living!
Abstract
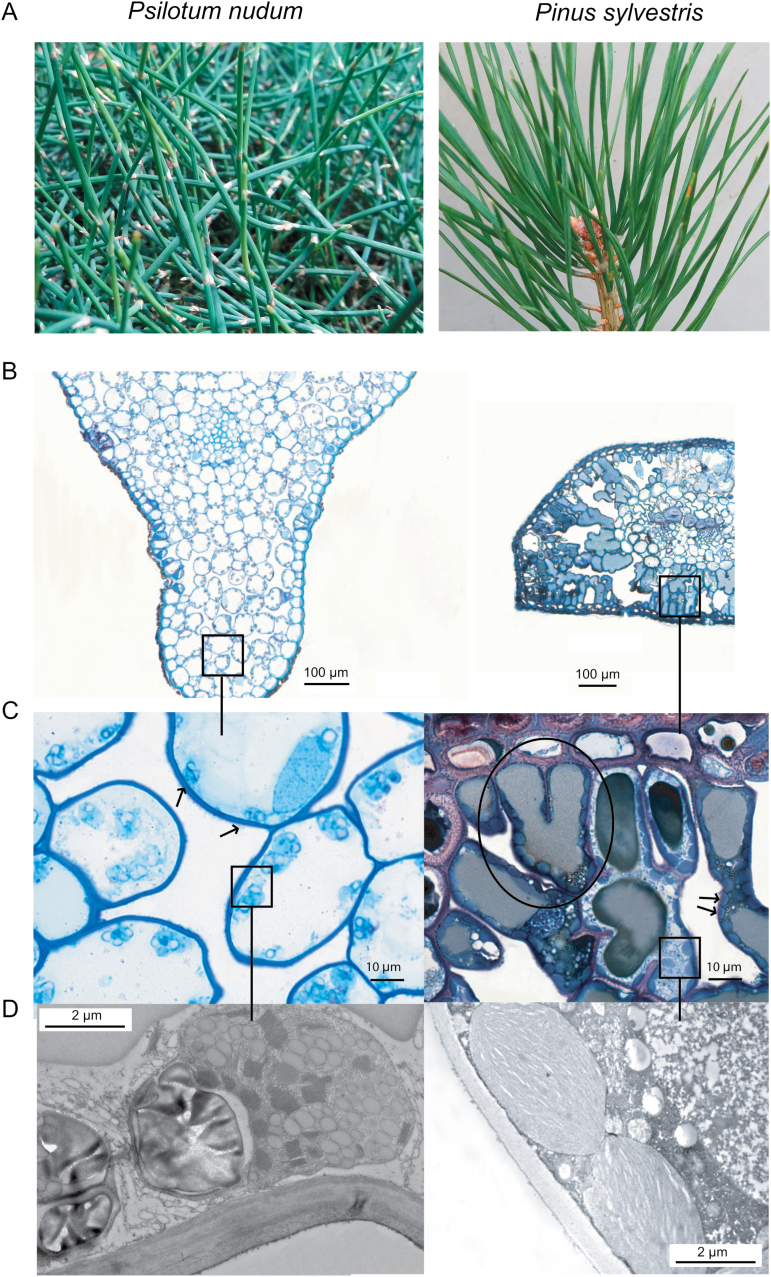
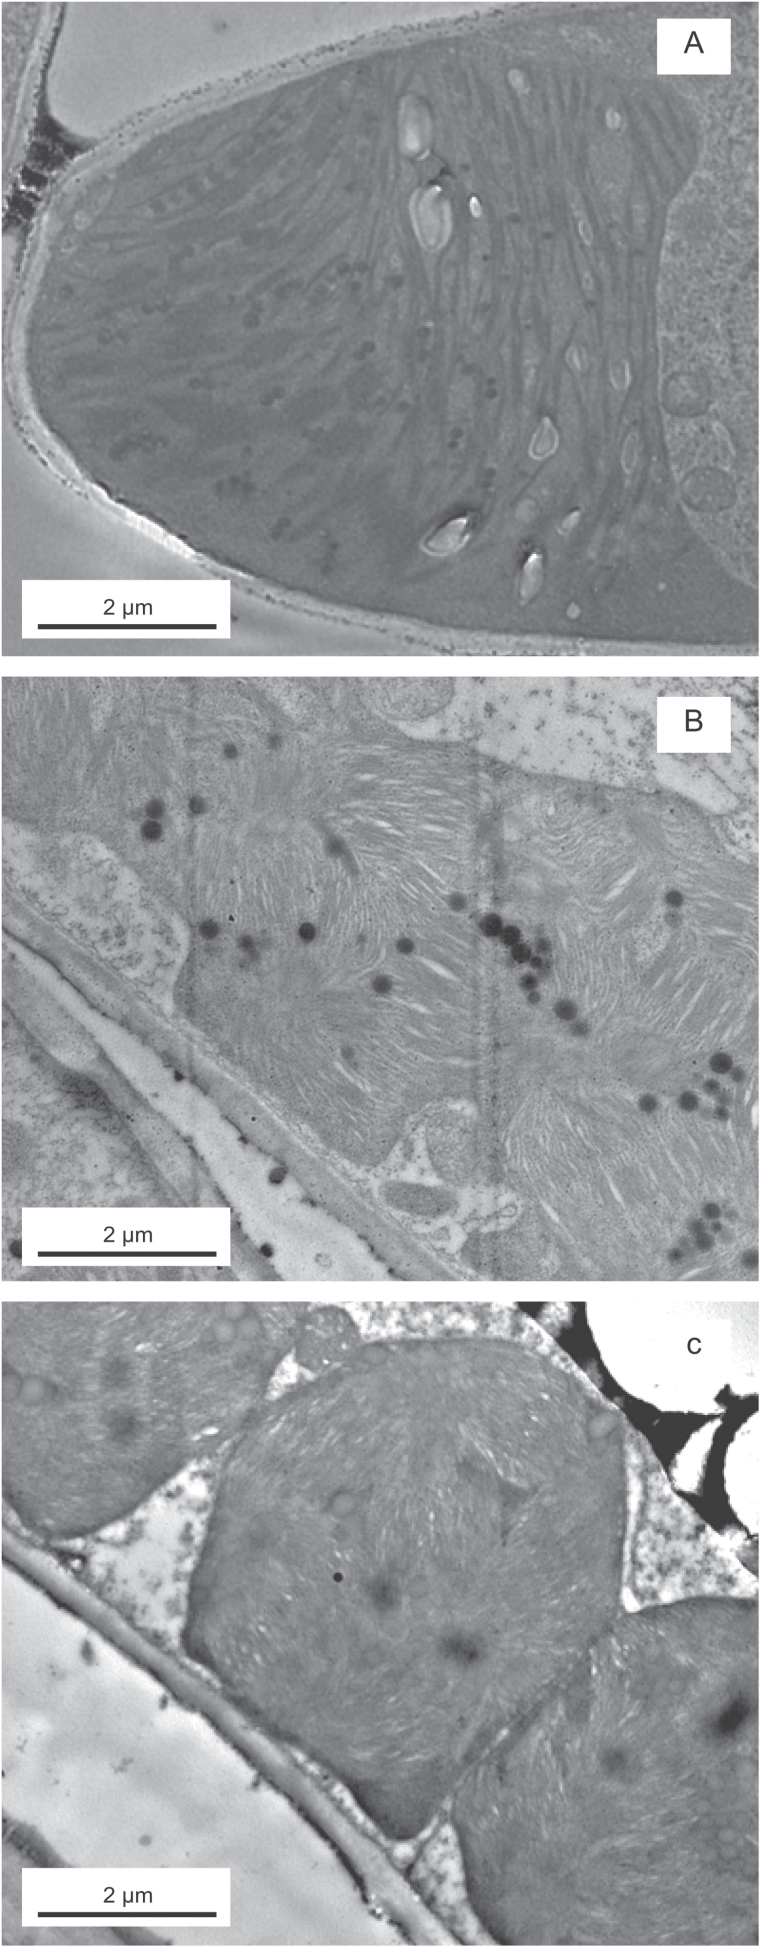
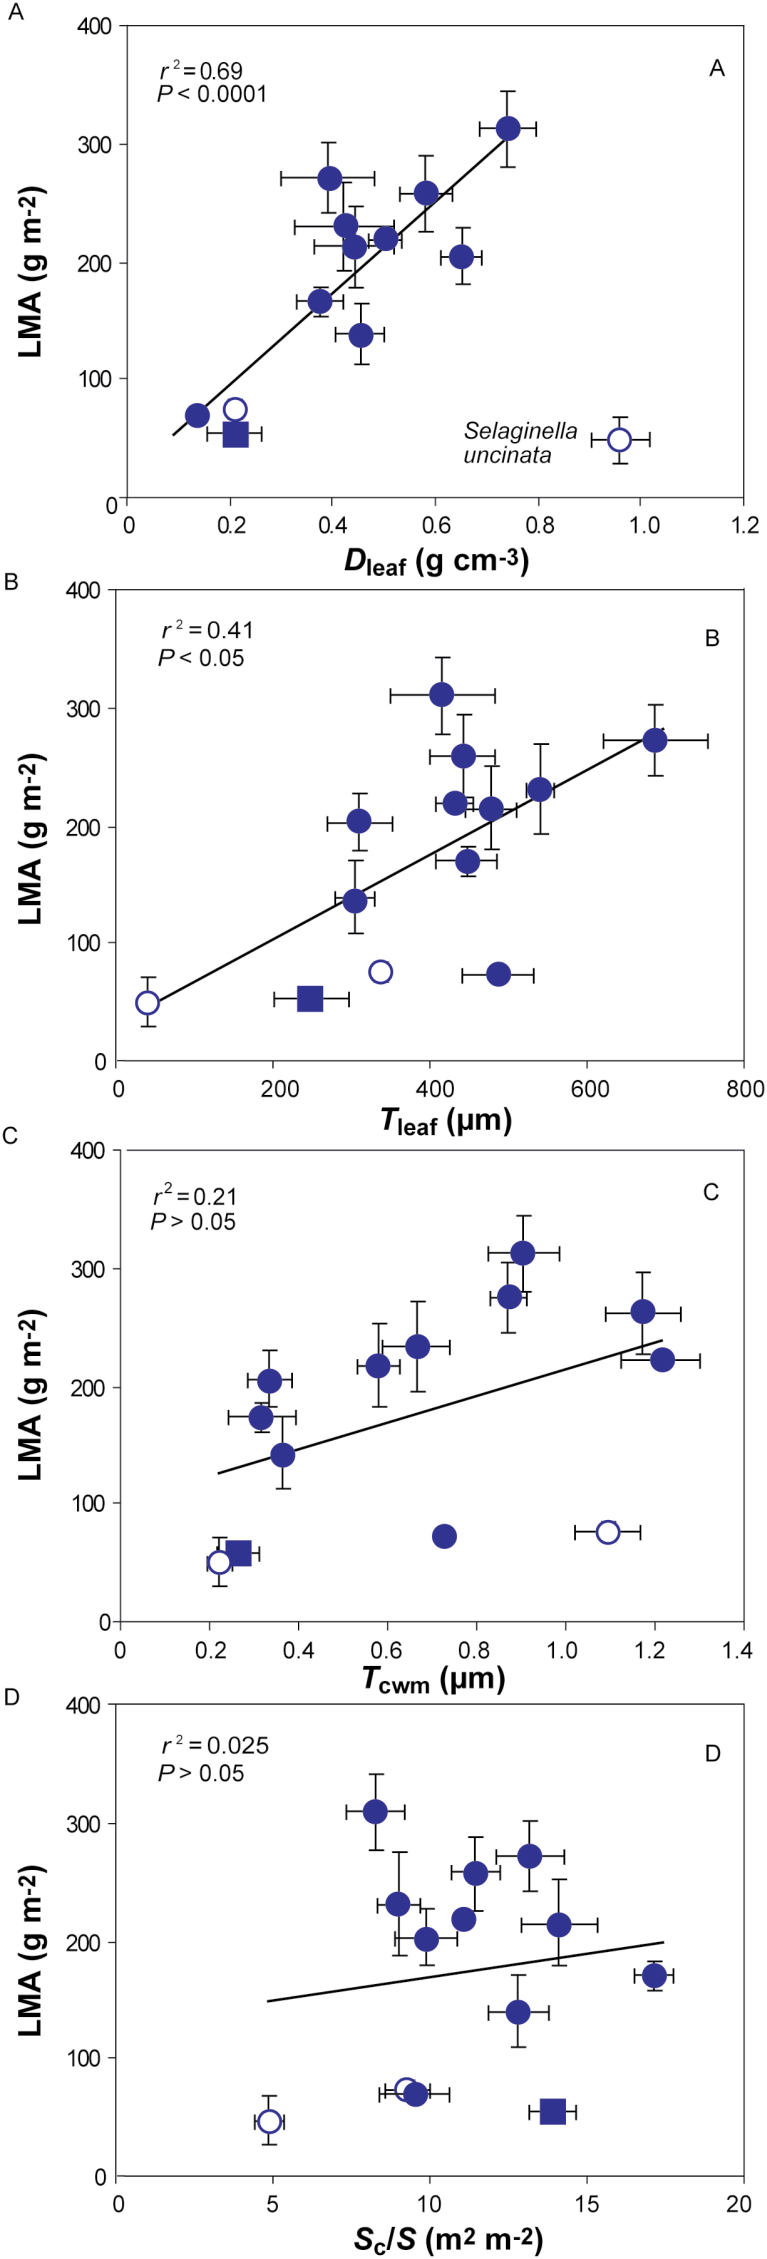
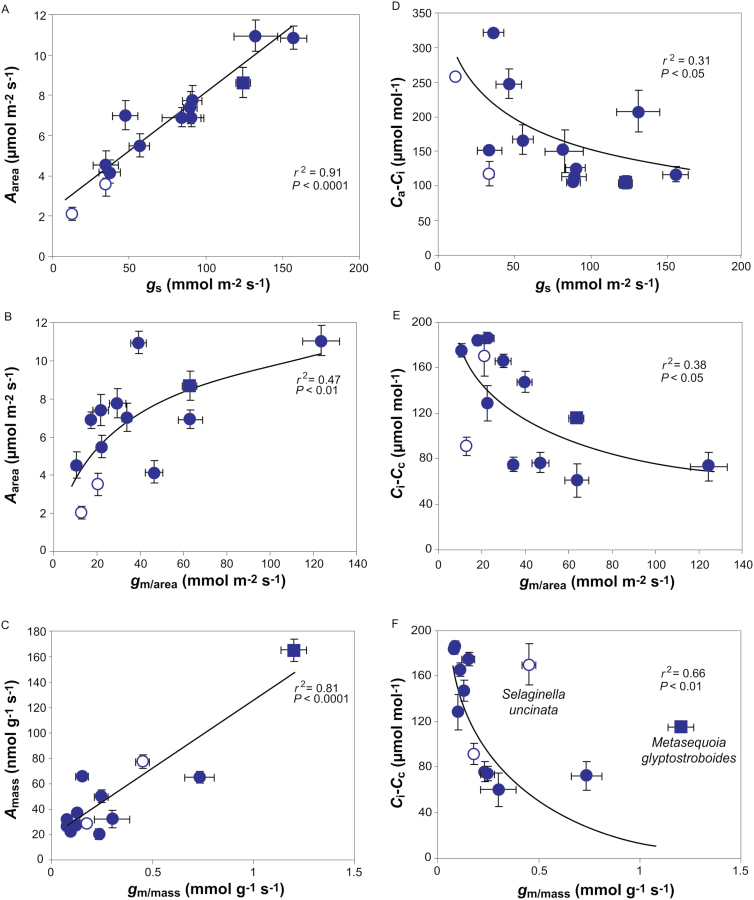
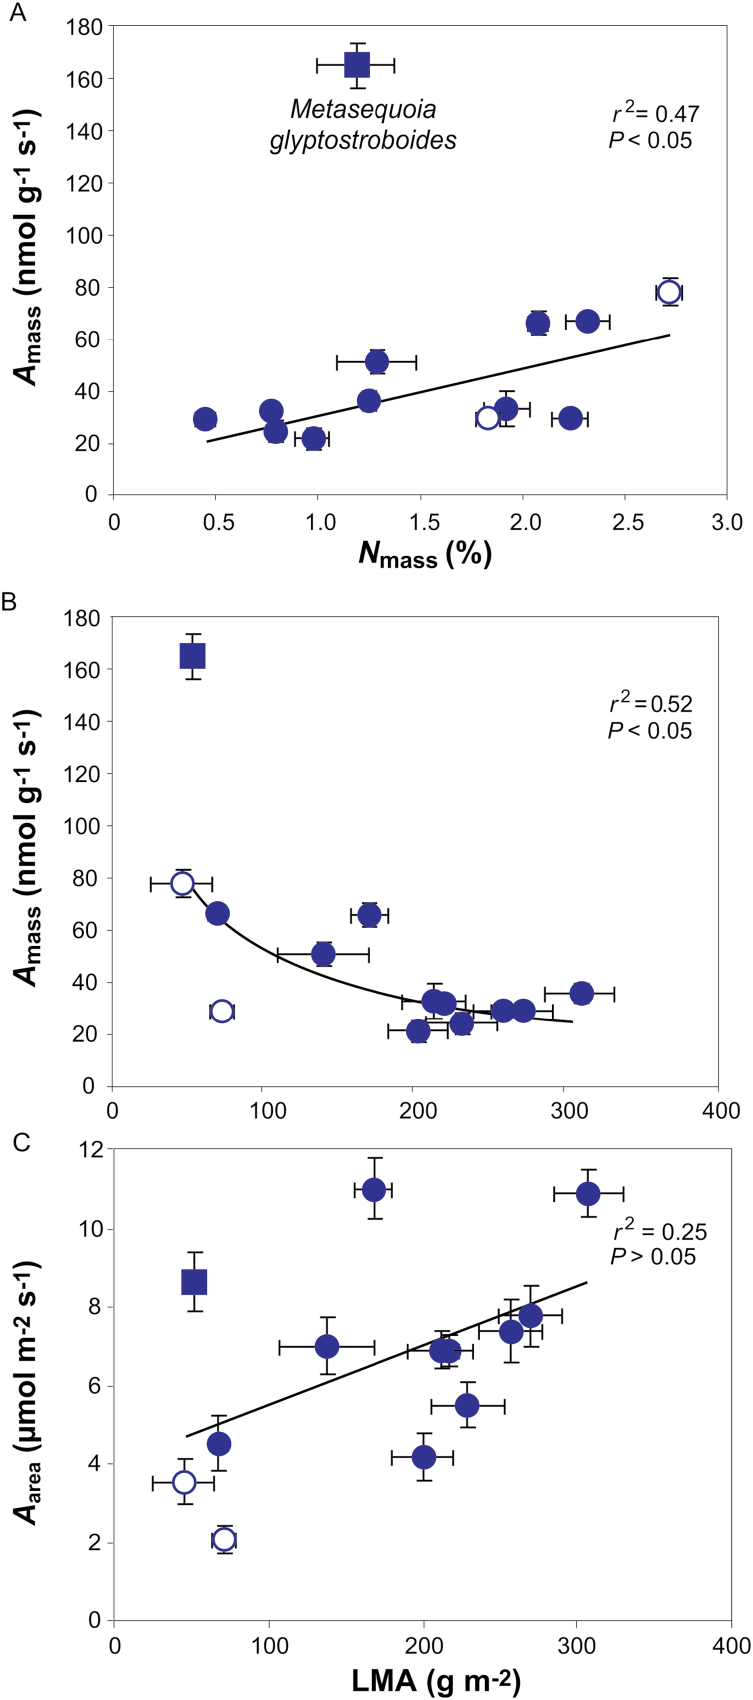
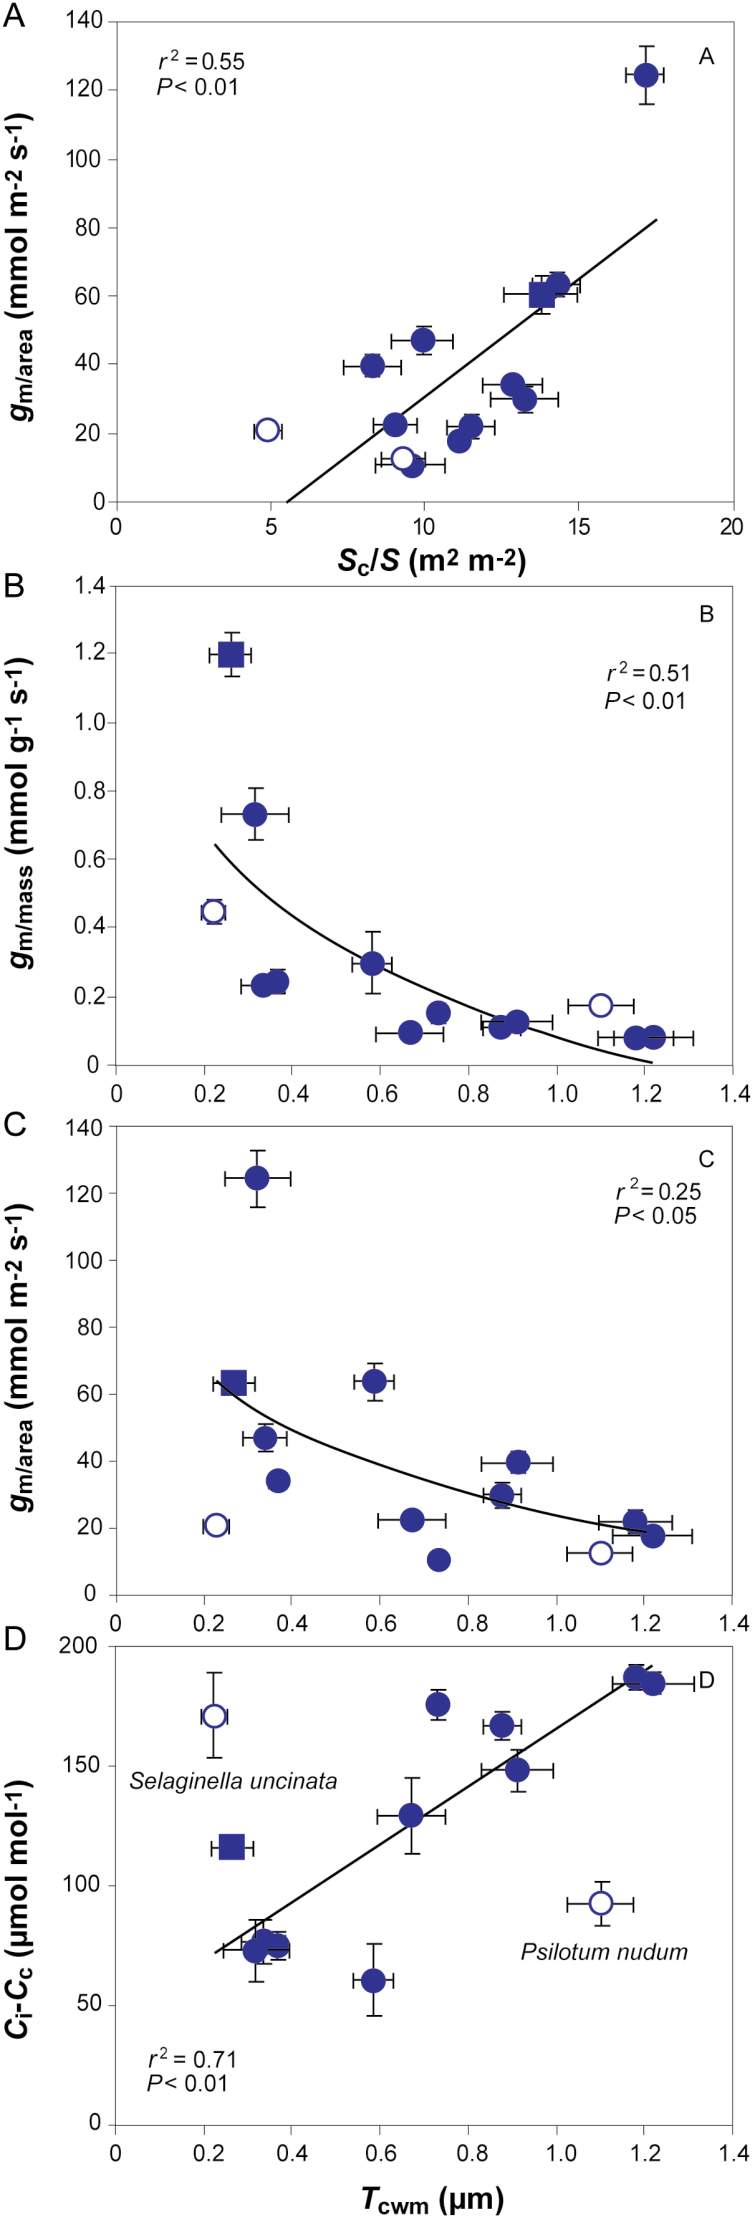
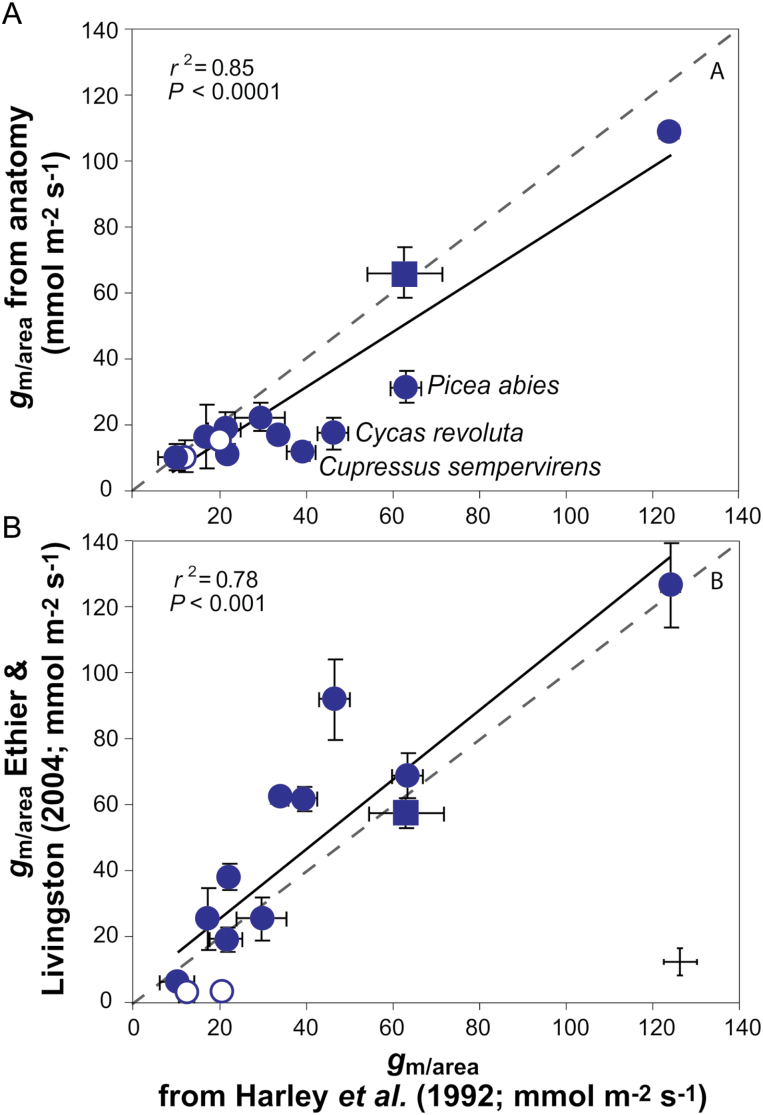
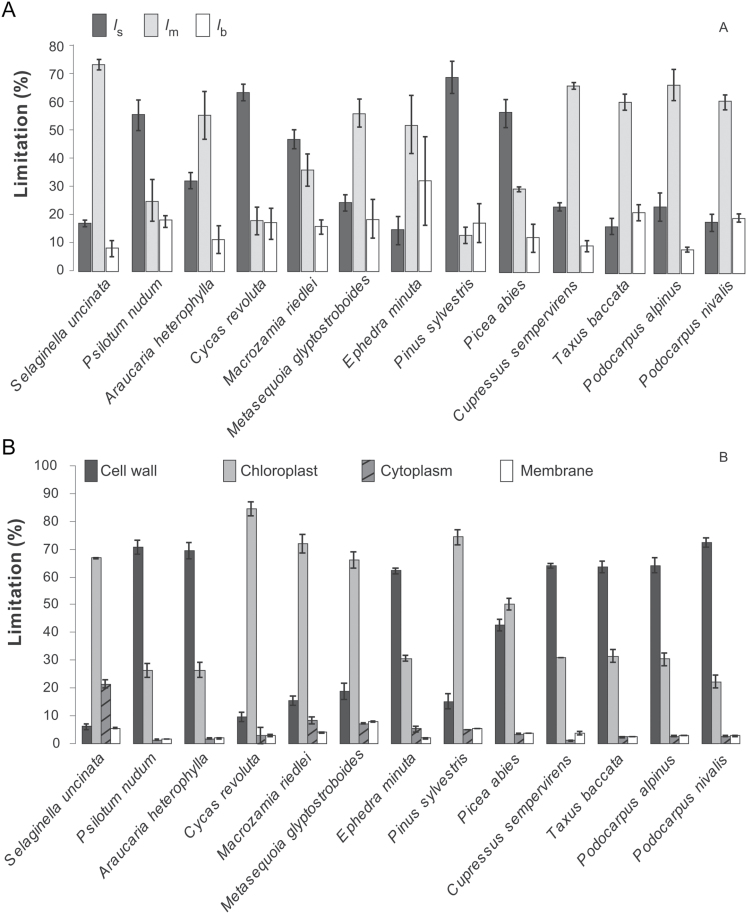
Mesophyll conductance is thought to be an important photosynthetic limitation in gymnosperms, but they currently constitute the most understudied plant group in regard to the extent to which photosynthesis and intrinsic water use efficiency are limited by mesophyll conductance. A comprehensive analysis of leaf gas exchange, photosynthetic limitations, mesophyll conductance (calculated by three methods previously used for across-species comparisons), and the underlying ultra-anatomical, morphological and chemical traits in 11 gymnosperm species varying in evolutionary history was performed to gain insight into the evolution of structural and physiological controls on photosynthesis at the lower return end of the leaf economics spectrum. Two primitive herbaceous species were included in order to provide greater evolutionary context. Low mesophyll conductance was the main limiting factor of photosynthesis in the majority of species. The strongest sources of limitation were extremely thick mesophyll cell walls, high chloroplast thickness and variation in chloroplast shape and size, and the low exposed surface area of chloroplasts per unit leaf area. In gymnosperms, the negative relationship between net assimilation per mass and leaf mass per area reflected an increased mesophyll cell wall thickness, whereas the easy-to-measure integrative trait of leaf mass per area failed to predict the underlying ultrastructural traits limiting mesophyll conductance.
Keywords: Conifer; LES; LMA; gm; gymnosperm; nitrogen; photosynthesis..
© The Author 2017. Published by Oxford University Press on behalf of the Society for Experimental Biology.
Figures
Similar articles
-
Variability in the chloroplast area lining the intercellular airspace and cell walls drives mesophyll conductance in gymnosperms.J Exp Bot. 2020 Aug 6;71(16):4958-4971. doi: 10.1093/jxb/eraa231. J Exp Bot. 2020. PMID: 32392579
-
Cell wall composition strongly influences mesophyll conductance in gymnosperms.Plant J. 2020 Aug;103(4):1372-1385. doi: 10.1111/tpj.14806. Epub 2020 Jun 3. Plant J. 2020. PMID: 32390169
-
The photosynthetic capacity in 35 ferns and fern allies: mesophyll CO2 diffusion as a key trait.New Phytol. 2016 Mar;209(4):1576-90. doi: 10.1111/nph.13719. Epub 2015 Oct 28. New Phytol. 2016. PMID: 26508678
-
Mesophyll diffusion conductance to CO2: an unappreciated central player in photosynthesis.Plant Sci. 2012 Sep;193-194:70-84. doi: 10.1016/j.plantsci.2012.05.009. Epub 2012 May 26. Plant Sci. 2012. PMID: 22794920 Review.
-
Mesophyll conductance: walls, membranes and spatial complexity.New Phytol. 2021 Feb;229(4):1864-1876. doi: 10.1111/nph.16968. Epub 2020 Nov 1. New Phytol. 2021. PMID: 33135193 Review.
Cited by
-
A Novel Hypothesis for the Role of Photosynthetic Physiology in Shaping Macroevolutionary Patterns.Plant Physiol. 2019 Nov;181(3):1148-1162. doi: 10.1104/pp.19.00749. Epub 2019 Sep 4. Plant Physiol. 2019. PMID: 31484680 Free PMC article.
-
Wounding-Induced VOC Emissions in Five Tropical Agricultural Species.Molecules. 2021 Apr 29;26(9):2602. doi: 10.3390/molecules26092602. Molecules. 2021. PMID: 33946933 Free PMC article.
-
Cell wall thickness spectrum of photosynthetic cells in herbaceous C3, C4, and crassulacean acid metabolism plants.J Plant Res. 2025 Mar;138(2):197-213. doi: 10.1007/s10265-024-01603-7. Epub 2024 Dec 10. J Plant Res. 2025. PMID: 39658745
-
Isotope-Based Techniques to Investigate Factors Influencing Water Use Efficiency in Pinus koraiensis Leaves during Plant Growth.Plants (Basel). 2024 Jun 27;13(13):1771. doi: 10.3390/plants13131771. Plants (Basel). 2024. PMID: 38999611 Free PMC article.
-
Mesophyll conductance in cotton bracts: anatomically determined internal CO2 diffusion constraints on photosynthesis.J Exp Bot. 2018 Nov 26;69(22):5433-5443. doi: 10.1093/jxb/ery296. J Exp Bot. 2018. PMID: 30124926 Free PMC article.
References
-
- Bernacchi CJ, Singsaas EL, Pimentel C, Portis AR, Jr, Long SP. 2001. Improved temperature response functions for models of Rubisco-limited photosynthesis. Plant, Cell and Environment 24, 253–259.
-
- Black K, Davis P, McGrath J, Doherty P, Osborne B. 2005. Interactive effects of irradiance and water availability on the photosynthetic performance of Picea sitchensis seedlings: implications for seedling establishment under different management practices. Annals of Forest Science 62, 413–422.
-
- Brodribb TJ, Holbrook NM, Zwieniecki MA, Palma B. 2005. Leaf hydraulic capacity in ferns, conifers and angiosperms: impacts on photosynthetic maxima. The New Phytologist 165, 839–846. - PubMed
-
- Brodribb TJ, McAdam SA, Jordan GJ, Feild TS. 2009. Evolution of stomatal responsiveness to CO2 and optimization of water-use efficiency among land plants. The New Phytologist 183, 839–847. - PubMed
Publication types
MeSH terms
Substances
LinkOut - more resources
Full Text Sources
Other Literature Sources
