. 2017 Apr 1;68(8):1941-1953.
doi: 10.1093/jxb/erx117.

Enhancing faba bean (Vicia faba L.) genome resources

Affiliations

Enhancing faba bean (Vicia faba L.) genome resources

James W Cooper et al. J Exp Bot. .

Abstract

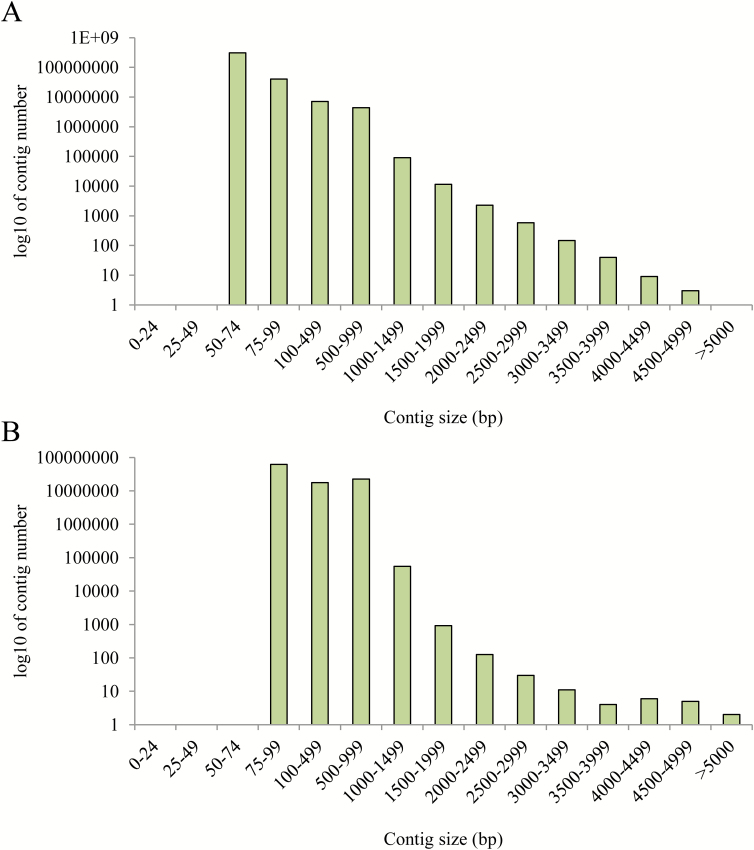
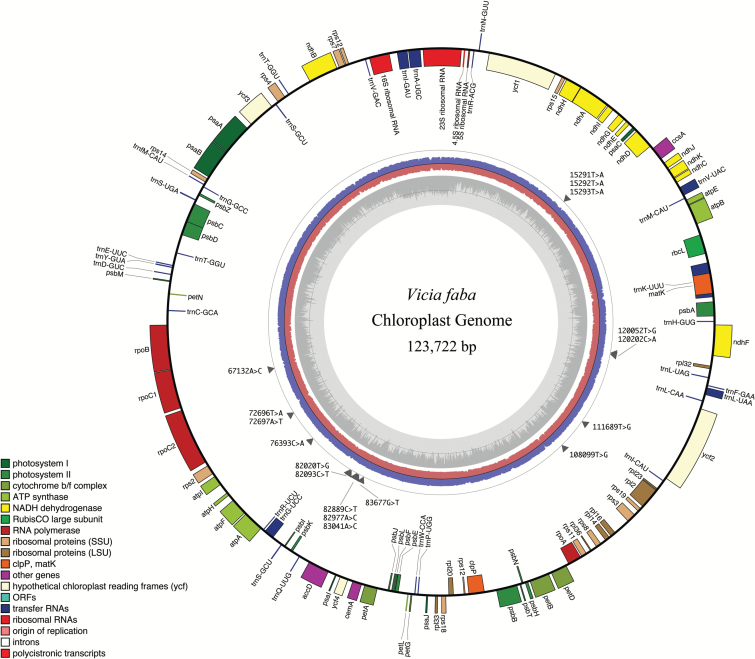
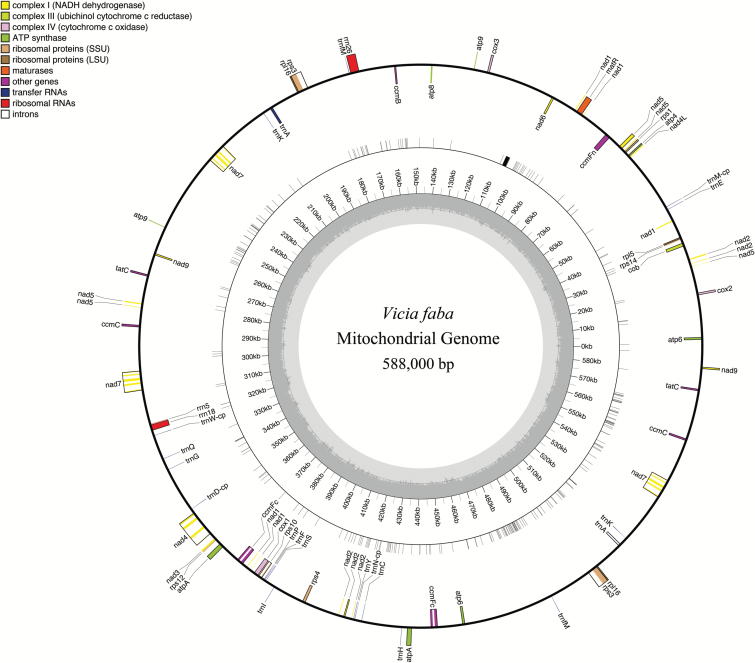
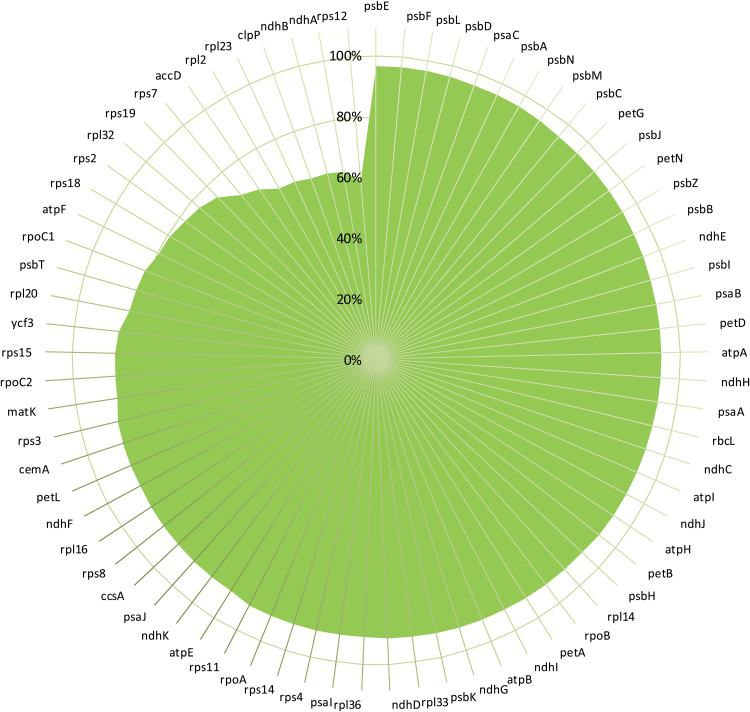
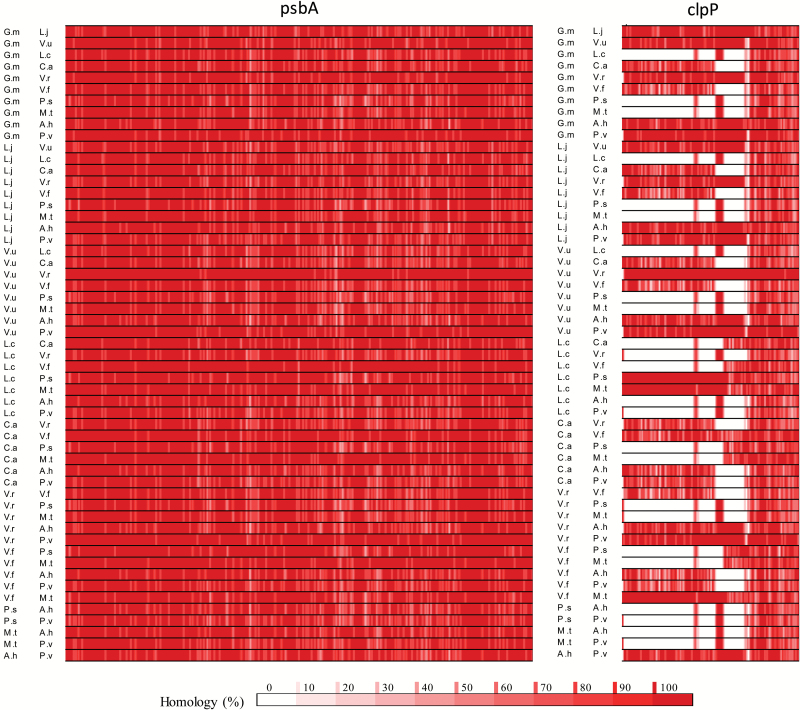
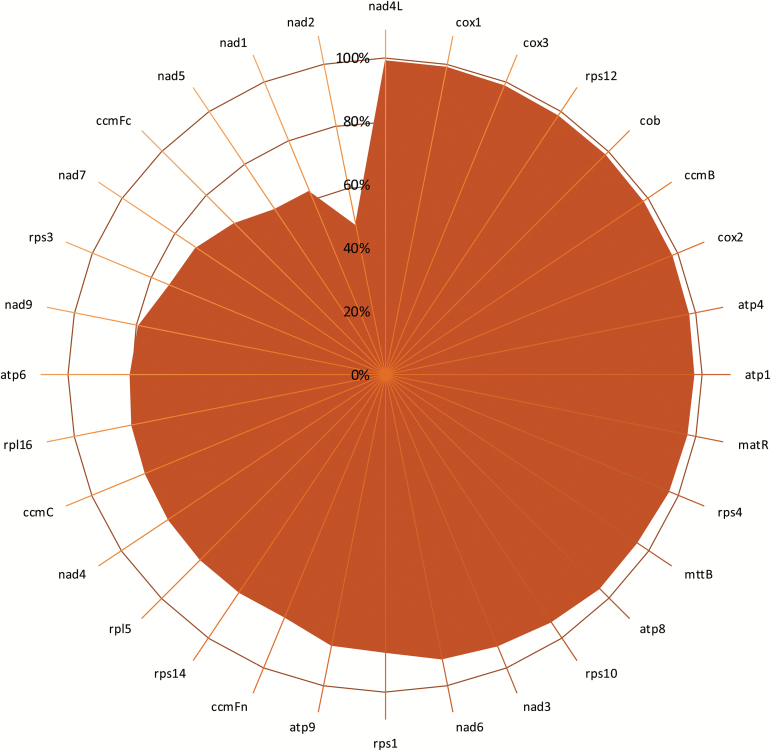
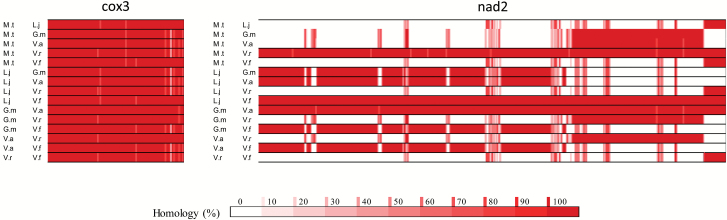
Grain legume improvement is currently impeded by a lack of genomic resources. The paucity of genome information for faba bean can be attributed to the intrinsic difficulties of assembling/annotating its giant (~13 Gb) genome. In order to address this challenge, RNA-sequencing analysis was performed on faba bean (cv. Wizard) leaves. Read alignment to the faba bean reference transcriptome identified 16 300 high quality unigenes. In addition, Illumina paired-end sequencing was used to establish a baseline for genomic information assembly. Genomic reads were assembled de novo into contigs with a size range of 50-5000 bp. Over 85% of sequences did not align to known genes, of which ~10% could be aligned to known repetitive genetic elements. Over 26 000 of the reference transcriptome unigenes could be aligned to DNA-sequencing (DNA-seq) reads with high confidence. Moreover, this comparison identified 56 668 potential splice points in all identified unigenes. Sequence length data were extended at 461 putative loci through alignment of DNA-seq contigs to full-length, publicly available linkage marker sequences. Reads also yielded coverages of 3466× and 650× for the chloroplast and mitochondrial genomes, respectively. Inter- and intraspecies organelle genome comparisons established core legume organelle gene sets, and revealed polymorphic regions of faba bean organelle genomes.

Keywords: Illumina sequencing; RNA-seq analysis.; legumes; mitochondrial genome; plastome; protein security.


Figures

Fig. 1.
Fig. 1.
Light microscope image (magnification ×40) of Vicia faba chromosomes in metaphase. (A) Feulgen staining of DNA against a FastGreen cytoplasm stain; (B) chromosome labels with roman numerals denote the largest (I) and smallest (VI) chromosome pairs. Scale bars=5 µm.
Fig. 2.
Fig. 2.
(A) The log10 contig abundance over a range of contig sizes, produced from 32 bp k-mers; (B) the log10 contig abundance over a range of contig sizes, produced from 64 bp k-mers.
Fig. 3.
Fig. 3.
Vicia faba chloroplast genome map. The outermost circle shows gene identities and read direction, with outward-facing genes being in the positive direction and inward-facing genes being in the negative direction. SNPs are denoted by grey triangles with the location and nature of polymorphism detailed. Read depth is shown for the forward reads (blue ring) and reverse reads (red ring). GC content (%) is shown by the innermost grey circle, with 50% being denoted by the dark grey line. Gene mapping and annotation were performed in OGDRAW.
Fig. 4.
Fig. 4.
Vicia faba mitochondrial genome map. The outermost circle shows gene identities and read direction, with outward-facing genes being in the positive direction and inward-facing genes being in the negative direction. SNPs are denoted by grey bars on the second concentric circle. Base pair positioning is detailed in the third circle. GC content (%) is shown by the innermost grey circle, with 50% being demarked by the dark grey line. The key provides details of mitochondrial gene families. Gene mapping and annotation were performed in OGDRAW.
Fig. 5.
Fig. 5.
The percentage sequence identity for chloroplast-encoded genes, showing the average data for a 55-way alignment for individual chloroplast genes of 11 species. Gene identities are given in the outermost circle. The scale shows the homology percentage (0–100%). Species comparisons were performed for Glycine max (G.m), Lotus japonicus (L.j), Vigna unguiculata (V.u), Lens culinaris (L.c), Cicer arietinum (C.a), Vigna radiata (V.r), Pisum sativum (P.s), Medicago truncatula (M.t), Arachis hypogaea (A.h), Phaseolus vulgaris (P.v), and Vicia faba (V.f).
Fig. 6.
Fig. 6.
Representative examples of sequence identity maps drawn for the highly homologous psbA gene and the clpP gene with low homology. Maps were constructed from a multiway homology comparison between 11 legume species; Glycine max (G.m), Lotus japonicus (L.j), Vigna unguiculata (V.u), Lens culinaris (L.c), Cicer arietinum (C.a), Vigna radiata (V.r), Pisum sativum (P.s), Medicago truncatula (M.t), Arachis hypogaea (A.h), Phaseolus vulgaris (P.v), and Vicia faba (V.f). High degrees of homology between compared species are shown in dark red, while a lack of detectable matches is shown in white. Quantitation is as shown in the scale bar. Homology was determined across a 10 bp frame (i.e. a single polymorphism would give 90% homology).
Fig. 7.
Fig. 7.
The percentage sequence identity for genes encoded in the mitochondrial genome. Average data for individual mitochondrial genes from six species were subjected to a 15-way alignment. Gene identities are given in the outermost circle. The scale shows the percentage sequence identity (0–100%). Species comparisons were performed for Medicago truncatula (M.t), Lotus japonicus (L.j), Glycine max (G.m), Vigna angularis (V.a), Vigna radiata (V.r), and Vicia faba (V.f).
Fig. 8.
Fig. 8.
Percentage homology maps for cox3 and nad2. Maps were constructed from a multiway homology comparison of six legume species: Medicago truncatula (M.t), Lotus japonicus (L.j), Glycine max (G.m), Vigna angularis (V.a), Vigna radiata (V.r), and Vicia faba (V.f). High degrees of homology are shown in dark red, and a lack of detectable match is shown in white, with quantitation as shown in the scale bar.

References

    1. Andrews S. 2010. FastQC: a quality control tool for high throughput sequence data. http://www.bioinformatics.babraham.ac.uk/projects/fastqc. Retrieved on 4....
    1. Arun-Chinnappa KS, McCurdy DW. 2015. De novo assembly of a genome-wide transcriptome map of Vicia faba (L.) for transfer cell research. Frontiers in Plant Science 6, 217. - PMC - PubMed
    1. Bao W, Kojima KK, Kohany O. 2015. Repbase Update, a database of repetitive elements in eukaryotic genomes. Mobile DNA 6, 11. - PMC - PubMed
    1. Barton L, Thamo T, Engelbrecht D, Biswas WK. 2014. Does growing grain legumes or applying lime cost effectively lower greenhouse gas emissions from wheat production in a semi-arid climate? Journal of Cleaner Production 83, 194–203.
    1. Benedito VA, Torres-Jerez I, Murray JD, et al. 2008. A gene expression atlas of the model legume Medicago truncatula. The Plant Journal 55, 504–513. - PubMed

Publication types