

Enhanced imaging of lipid rich nanoparticles embedded in methylcellulose films for transmission electron microscopy using mixtures of heavy metals
- PMID: 28419915
- PMCID: PMC5465805
- DOI: 10.1016/j.micron.2017.03.019
Enhanced imaging of lipid rich nanoparticles embedded in methylcellulose films for transmission electron microscopy using mixtures of heavy metals
Abstract
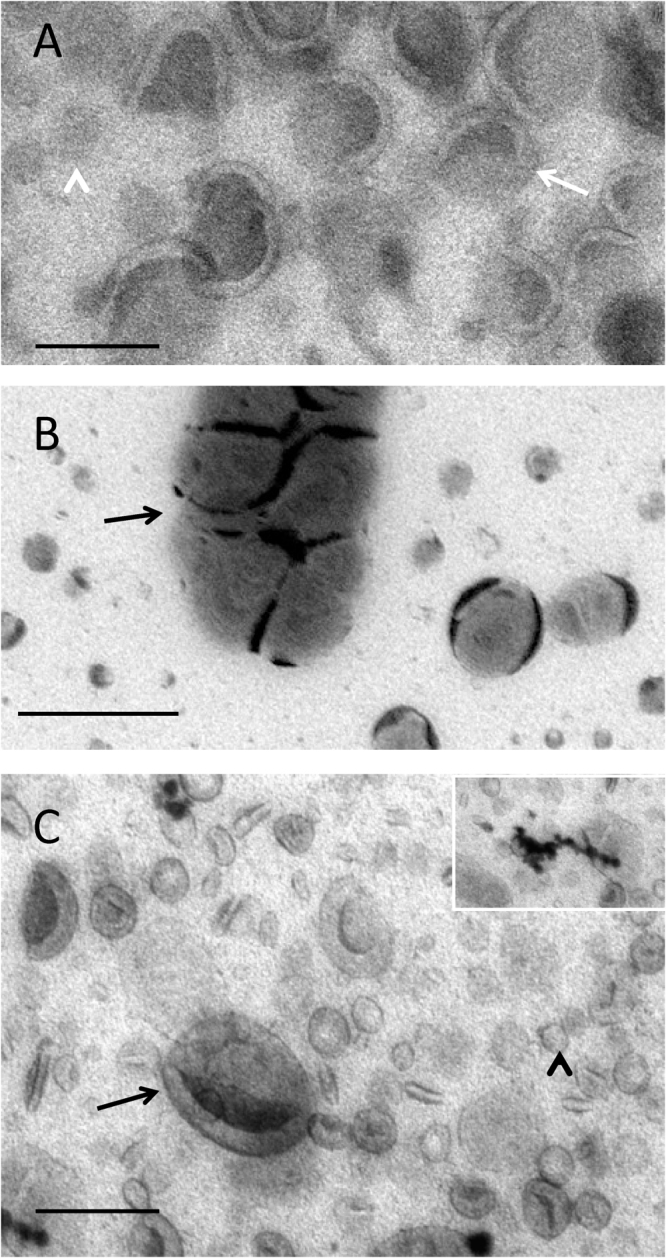
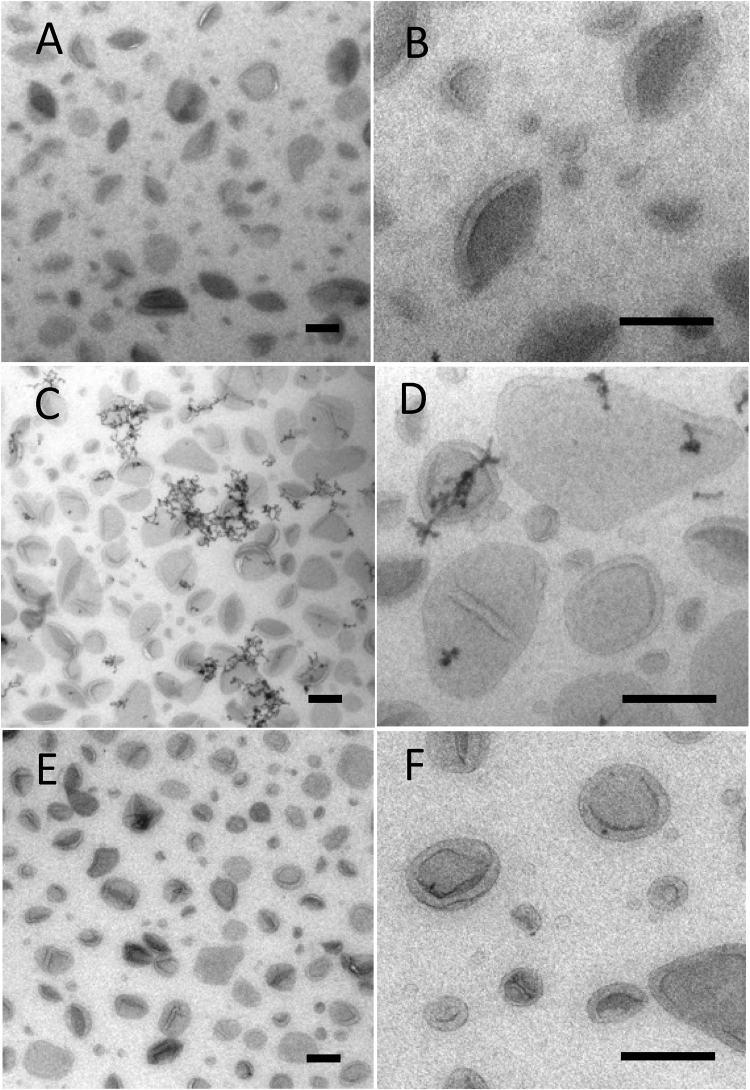
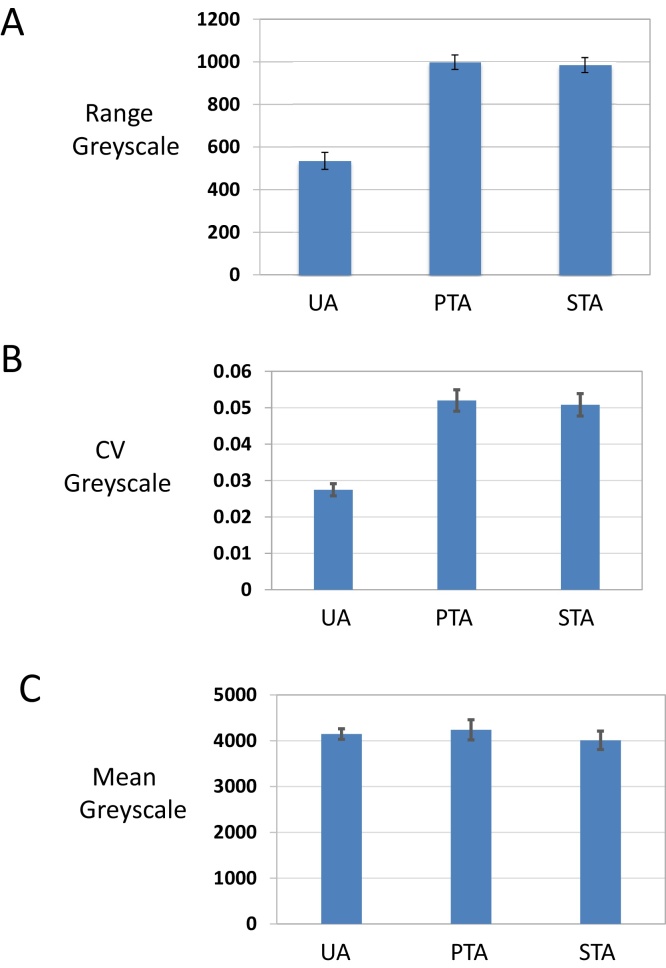
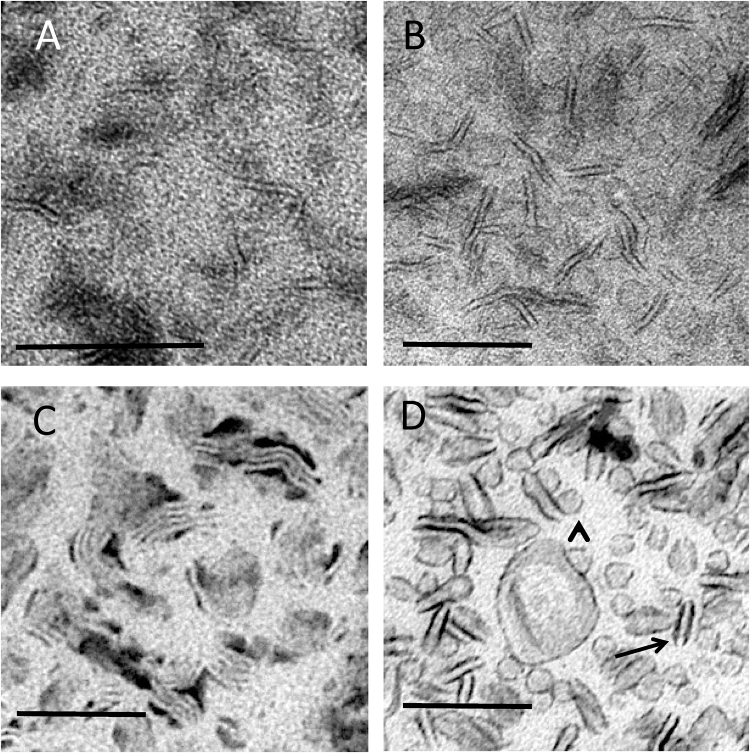
Synthetic and naturally occurring lipid-rich nanoparticles are of wide ranging importance in biomedicine. They include liposomes, bicelles, nanodiscs, exosomes and virus particles. The quantitative study of these particles requires methods for high-resolution visualization of the whole population. One powerful imaging method is cryo-EM of vitrified samples, but this is technically demanding, requires specialized equipment, provides low contrast and does not reveal all particles present in a population. Another approach is classical negative stain-EM, which is more accessible but is difficult to standardize for larger lipidic structures, which are prone to artifacts of structure collapse and contrast variability. A third method uses embedment in methylcellulose films containing uranyl acetate as a contrasting agent. Methylcellulose embedment has been widely used for contrasting and supporting cryosections but only sporadically for visualizing lipid rich vesicular structures such as endosomes and exosomes. Here we present a simple methylcellulose-based method for routine and comprehensive visualization of synthetic lipid rich nanoparticles preparations, such as liposomes, bicelles and nanodiscs. It combines a novel double-staining mixture of uranyl acetate (UA) and tungsten-based electron stains (namely phosphotungstic acid (PTA) or sodium silicotungstate (STA)) with methylcellulose embedment. While the methylcellulose supports the delicate lipid structures during drying, the addition of PTA or STA to UA provides significant enhancement in lipid structure display and contrast as compared to UA alone. This double staining method should aid routine structural evaluation and quantification of lipid rich nanoparticles structures.
Keywords: Bicelles; Lipids; Liposomes; Membranes; Methylcellulose; Nanodiscs; Negative stain; Phospholipids; Phosphotungstic acid; Sodium silicotungstate; Uranyl acetate.
Copyright © 2017. Published by Elsevier Ltd.
Figures
Similar articles
-
Nanoparticle suspensions enclosed in methylcellulose: a new approach for quantifying nanoparticles in transmission electron microscopy.Sci Rep. 2016 May 4;6:25275. doi: 10.1038/srep25275. Sci Rep. 2016. PMID: 27141843 Free PMC article.
-
Imaging of Liposomes by Transmission Electron Microscopy.Methods Mol Biol. 2018;1682:73-88. doi: 10.1007/978-1-4939-7352-1_8. Methods Mol Biol. 2018. PMID: 29039095
-
Contrasting of Lowicryl K4M thin sections.Histochemistry. 1990;95(2):123-36. doi: 10.1007/BF00266584. Histochemistry. 1990. PMID: 1707044
-
Specimen Preparation for High-Resolution Cryo-EM.Methods Enzymol. 2016;579:51-86. doi: 10.1016/bs.mie.2016.04.011. Epub 2016 Jun 16. Methods Enzymol. 2016. PMID: 27572723 Free PMC article. Review.
-
Lipid-based nanoparticles for contrast-enhanced MRI and molecular imaging.NMR Biomed. 2006 Feb;19(1):142-64. doi: 10.1002/nbm.1011. NMR Biomed. 2006. PMID: 16450332 Review.
Cited by
-
Combination of Nucleic Acid and Mesoporous Silica Nanoparticles: Optimization and Therapeutic Performance In Vitro.ACS Appl Mater Interfaces. 2020 Sep 2;12(35):38873-38886. doi: 10.1021/acsami.0c07106. Epub 2020 Aug 18. ACS Appl Mater Interfaces. 2020. PMID: 32805923 Free PMC article.
-
The Delivery Strategy of Paclitaxel Nanostructured Lipid Carrier Coated with Platelet Membrane.Cancers (Basel). 2019 Jun 11;11(6):807. doi: 10.3390/cancers11060807. Cancers (Basel). 2019. PMID: 31212681 Free PMC article.
-
Developing Electron Microscopy Tools for Profiling Plasma Lipoproteins Using Methyl Cellulose Embedment, Machine Learning and Immunodetection of Apolipoprotein B and Apolipoprotein(a).Int J Mol Sci. 2020 Sep 2;21(17):6373. doi: 10.3390/ijms21176373. Int J Mol Sci. 2020. PMID: 32887372 Free PMC article.
-
Scaffolds with controlled release of pro-mineralization exosomes to promote craniofacial bone healing without cell transplantation.Acta Biomater. 2020 Dec;118:215-232. doi: 10.1016/j.actbio.2020.09.052. Epub 2020 Oct 13. Acta Biomater. 2020. PMID: 33065285 Free PMC article.
-
Choosing an Optimal Solvent Is Crucial for Obtaining Cell-Penetrating Peptide Nanoparticles with Desired Properties and High Activity in Nucleic Acid Delivery.Pharmaceutics. 2023 Jan 24;15(2):396. doi: 10.3390/pharmaceutics15020396. Pharmaceutics. 2023. PMID: 36839718 Free PMC article.
References
-
- Borch J., Hamann T. The nanodisc: a novel tool for membrane protein studies. Biol. Chem. 2009;390:805–814. - PubMed
MeSH terms
Substances
Grants and funding
LinkOut - more resources
Full Text Sources
Other Literature Sources
