

Comparative Study of Blood-Based Biomarkers, α2,3-Sialic Acid PSA and PHI, for High-Risk Prostate Cancer Detection
- PMID: 28420168
- PMCID: PMC5412429
- DOI: 10.3390/ijms18040845
Comparative Study of Blood-Based Biomarkers, α2,3-Sialic Acid PSA and PHI, for High-Risk Prostate Cancer Detection
Abstract
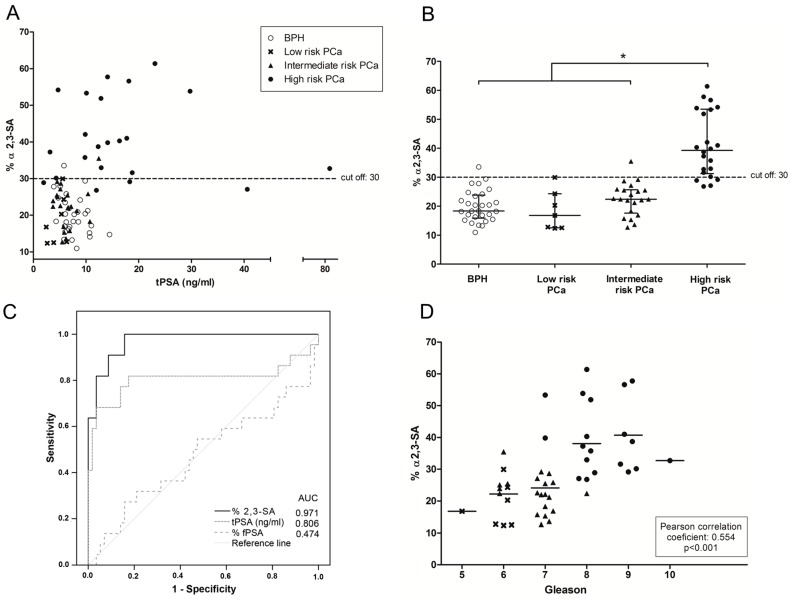
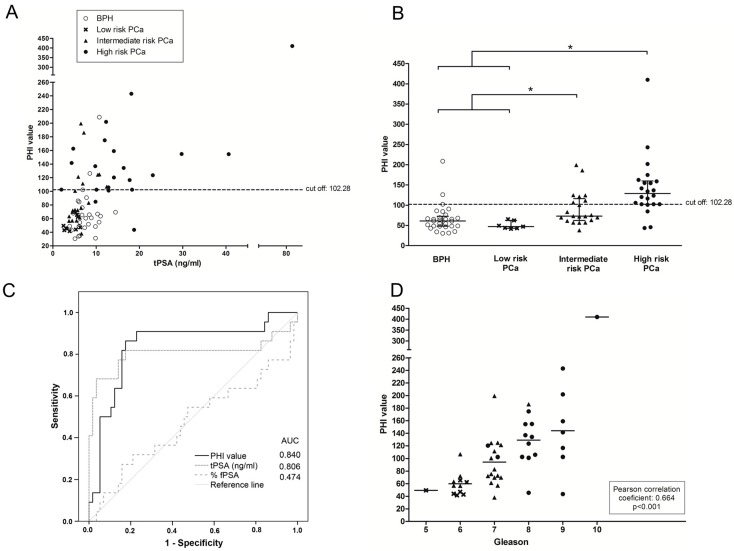
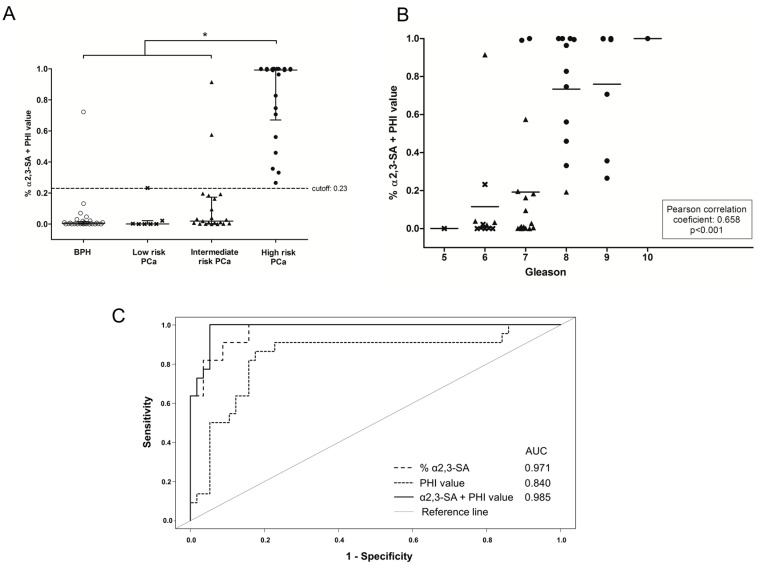
Prostate Specific Antigen (PSA) is the most commonly used serum marker for prostate cancer (PCa), although it is not specific and sensitive enough to allow the differential diagnosis of the more aggressive tumors. For that, new diagnostic methods are being developed, such as PCA-3, PSA isoforms that have resulted in the 4K score or the Prostate Health Index (PHI), and PSA glycoforms. In the present study, we have compared the PHI with our recently developed PSA glycoform assay, based on the determination of the α2,3-sialic acid percentage of serum PSA (% α2,3-SA), in a cohort of 79 patients, which include 50 PCa of different grades and 29 benign prostate hyperplasia (BPH) patients. The % α2,3-SA could distinguish high-risk PCa patients from the rest of patients better than the PHI (area under the curve (AUC) of 0.971 vs. 0.840), although the PHI correlated better with the Gleason score than the % α2,3-SA. The combination of both markers increased the AUC up to 0.985 resulting in 100% sensitivity and 94.7% specificity to differentiate high-risk PCa from the other low and intermediate-risk PCa and BPH patients. These results suggest that both serum markers complement each other and offer an improved diagnostic tool to identify high-risk PCa, which is an important requirement for guiding treatment decisions.
Keywords: PHI; diagnosis; glycosylation; proPSA; prostate cancer; prostate specific antigen; α2,3-sialic acid.
Conflict of interest statement
The authors have filed a patent: “In vitro method for prostate cancer diagnosis”. PCT/ES2016/070781, Priority date: 6 November 2015.
Figures
Similar articles
-
Comparison of prostate cancer gene 3 score, prostate health index and percentage free prostate-specific antigen for differentiating histological inflammation from prostate cancer and other non-neoplastic alterations of the prostate at initial biopsy.Anticancer Res. 2014 Dec;34(12):7159-65. Anticancer Res. 2014. PMID: 25503144
-
Wisteria floribunda Agglutinin and Its Reactive-Glycan-Carrying Prostate-Specific Antigen as a Novel Diagnostic and Prognostic Marker of Prostate Cancer.Int J Mol Sci. 2017 Jan 26;18(2):261. doi: 10.3390/ijms18020261. Int J Mol Sci. 2017. PMID: 28134773 Free PMC article.
-
Characterisation of the main PSA glycoforms in aggressive prostate cancer.Sci Rep. 2020 Nov 4;10(1):18974. doi: 10.1038/s41598-020-75526-3. Sci Rep. 2020. PMID: 33149259 Free PMC article.
-
From prostate-specific antigen (PSA) to precursor PSA (proPSA) isoforms: a review of the emerging role of proPSAs in the detection and management of early prostate cancer.BJU Int. 2013 Oct;112(6):717-28. doi: 10.1111/j.1464-410X.2012.11329.x. Epub 2012 Jul 3. BJU Int. 2013. PMID: 22759214 Review.
-
Current biomarkers for diagnosing of prostate cancer.Future Oncol. 2015;11(20):2743-55. doi: 10.2217/fon.15.203. Epub 2015 Sep 11. Future Oncol. 2015. PMID: 26358139 Review.
Cited by
-
Sugar-Coated: Can Multivalent Glycoconjugates Improve upon Nature's Design?J Am Chem Soc. 2024 Oct 9;146(40):27215-27232. doi: 10.1021/jacs.4c08818. Epub 2024 Sep 28. J Am Chem Soc. 2024. PMID: 39340450 Free PMC article. Review.
-
Medical Relevance, State-of-the-Art and Perspectives of "Sweet Metacode" in Liquid Biopsy Approaches.Diagnostics (Basel). 2024 Mar 28;14(7):713. doi: 10.3390/diagnostics14070713. Diagnostics (Basel). 2024. PMID: 38611626 Free PMC article. Review.
-
Blood-Derived Biomarkers of Diagnosis, Prognosis and Therapy Response in Prostate Cancer Patients.J Pers Med. 2021 Apr 13;11(4):296. doi: 10.3390/jpm11040296. J Pers Med. 2021. PMID: 33924671 Free PMC article. Review.
-
A panel of selected serum protein biomarkers for the detection of aggressive prostate cancer.Theranostics. 2021 Apr 15;11(13):6214-6224. doi: 10.7150/thno.55676. eCollection 2021. Theranostics. 2021. PMID: 33995654 Free PMC article.
-
Prostate-specific antigen glycoprofiling as diagnostic and prognostic biomarker of prostate cancer.Interface Focus. 2019 Apr 6;9(2):20180077. doi: 10.1098/rsfs.2018.0077. Epub 2019 Feb 15. Interface Focus. 2019. PMID: 30842876 Free PMC article. Review.
References
Publication types
MeSH terms
Substances
LinkOut - more resources
Full Text Sources
Other Literature Sources
Medical
Research Materials
Miscellaneous
