. 2017 Jul:81:99-109.
doi: 10.1016/j.jaut.2017.03.014. Epub 2017 Apr 15.

Expression of long non-coding RNAs in autoimmunity and linkage to enhancer function and autoimmune disease risk genetic variants

Affiliations

Expression of long non-coding RNAs in autoimmunity and linkage to enhancer function and autoimmune disease risk genetic variants

T M Aune et al. J Autoimmun. 2017 Jul.

Abstract

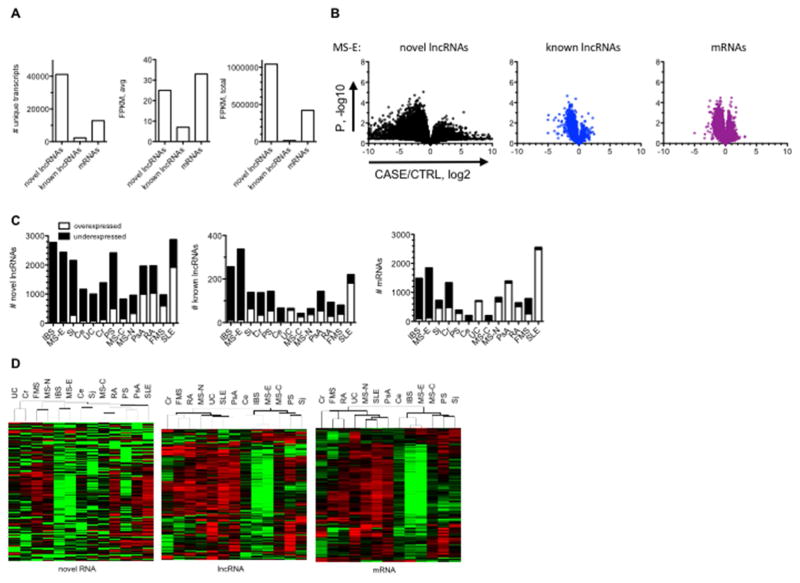
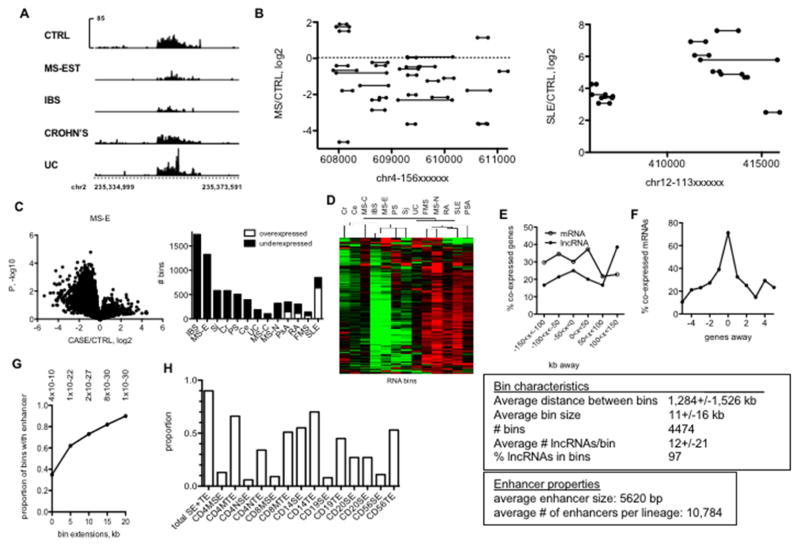
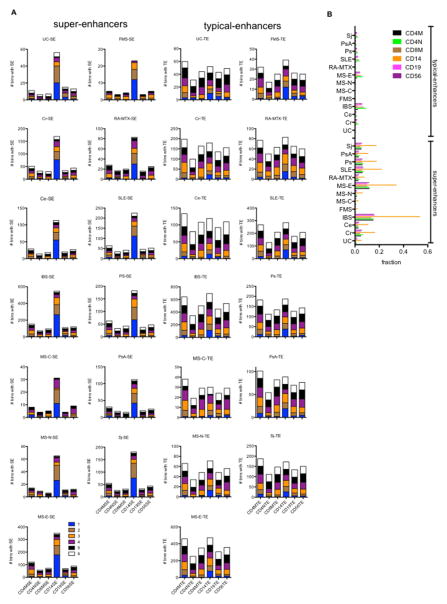
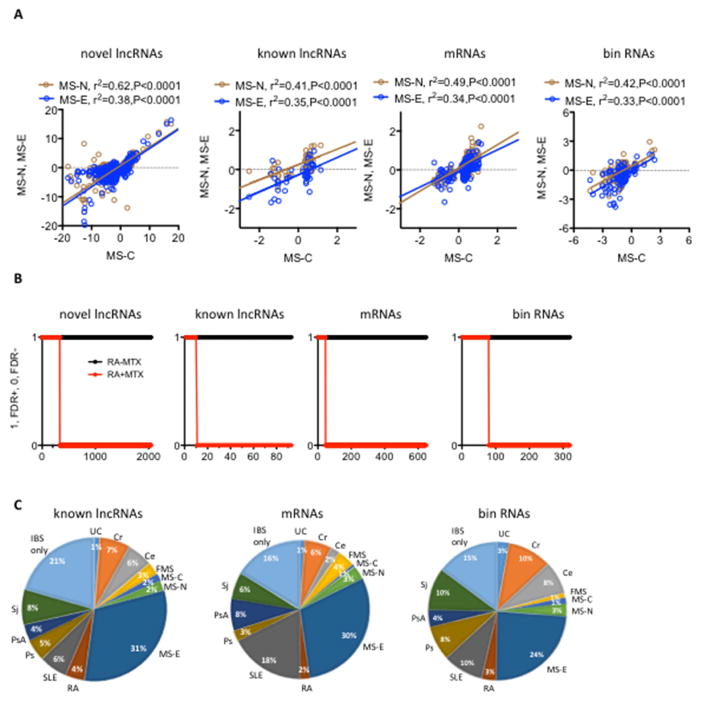
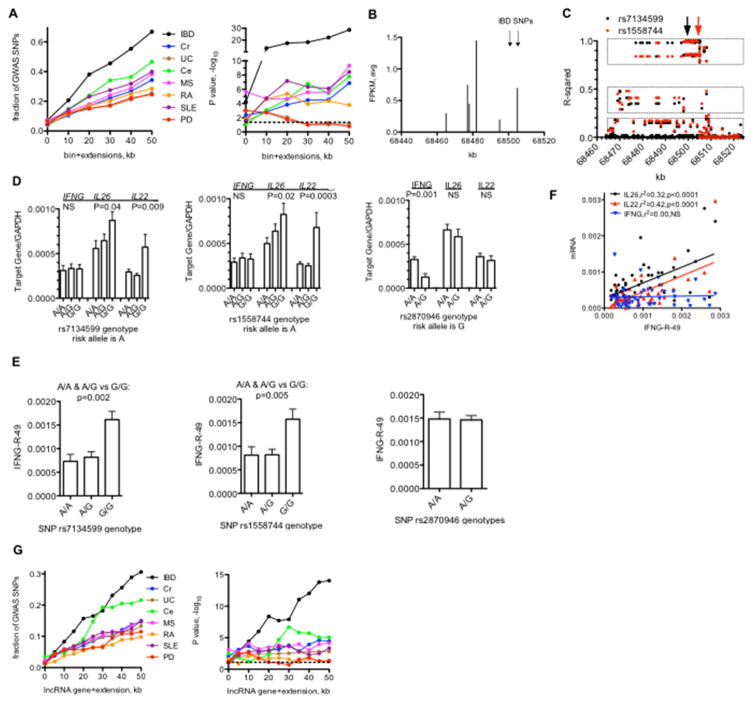
Genome-wide association studies have identified numerous genetic variants conferring autoimmune disease risk. Most of these genetic variants lie outside protein-coding genes hampering mechanistic explorations. Numerous mRNAs are also differentially expressed in autoimmune disease but their regulation is also unclear. The majority of the human genome is transcribed yet its biologic significance is incompletely understood. We performed whole genome RNA-sequencing [RNA-seq] to categorize expression of mRNAs, known and novel long non-coding RNAs [lncRNAs] in leukocytes from subjects with autoimmune disease and identified annotated and novel lncRNAs differentially expressed across multiple disorders. We found that loci transcribing novel lncRNAs were not randomly distributed across the genome but co-localized with leukocyte transcriptional enhancers, especially super-enhancers, and near genetic variants associated with autoimmune disease risk. We propose that alterations in enhancer function, including lncRNA expression, produced by genetics and environment, change cellular phenotypes contributing to disease risk and pathogenesis and represent attractive therapeutic targets.


Conflict of interest statement

Competing interests: TMA and CFS are co-founders of IQuity Labs. JTT has a financial interest in IQuity Labs.

Figures

Fig. 1
Fig. 1
Differential expression of RNA classes in idiopathic disease. A, Distribution of RNA classes, novel IncRNAs, known IncRNAs, and mRNAs, determined by RNA-seq. B, ‘Volcano plots’ showing differential expression of different RNA classes in MS-E compared to CTRL. C, Numbers of over- and under-expressed novel IncRNAs, known IncRNAs. and mRNAs in different idiopathic disease cohorts after FDR correction. D, Hierarchical clustering of RNA classes across idiopathic disease cohorts after FDR correction.
Fig. 2
Fig. 2
Novel IncRNAs are transcribed from discrete locations in the genome (‘bins’) overlapping with known typical and super-enhancers. A, Examples of two genomic regions transcribing a high density of novel IncRNAs (bins). Spikes indicate individual IncRNAs. Y-axes aremean expression of IncRNAs and X-axes are genomic positions on chr1. B, Example of IncRNA bin differentially expressed in the indicated disease cohorts. Y axes are RPKM and X axis is genomic position on chr2. C, Left panel: ‘Volcano’ plots illustrating differential bin activity in MS-E versus CTRL. Right panel: Total numbers of under- and over-expressed ‘bins’ in different idiopathic disease cohorts relative to CTRL after FDR correction. D, Hierarchical clustering of RNA bins across idiopathic disease cohorts after FDR correction. E, Co-expression of bin activity and expression of neighboring IncRNA and mRNA genes. Y-axis is the % of co-expressed genes relative to all genes within the indicated genomic distances of a ‘bin’, X axis is genomic distances from bins. F, Correlation of co-expression of protein-coding genes as a function of distance from a known IncRNA gene. The text box describes overall properties of bins in the genome. G, Relationship between genomic positions of bins and myeloid and lymphoid enhancers. Y-axis is the proportion of bins that contain a myeloid or lymphoid enhancer defined by H3K27Ac levels. X-axis: effect of increasing bin size by the indicated kb in both 5′ and 3′ directions.* = P-values determined by χ2 analysis. H, Proportion of bins that contain enhancers in the indicated lymphoid and myeloid lineages using the bin + 20 kb extension.
Fig. 3
Fig. 3
Genomic ‘bins’ are enriched with CD14 super-enhancers. (A) We determined the number of ‘bins’ differentially expressed in the indicated idiopathic diseases that contained an SE or TE present in the indicated cell types. Numbers from 1–6 indicate if ‘bins’ contain SEs or TEs present in one or more cell types (from ref. 23). Left column: stack plots showing number of bins with an SE in the indicated cell types, X-axis; right column, stack plots showing number of bins with an TE in the indicated cell types, X-axis. (B) Fraction of total TEs or SEs present in the indicated cell types contained within a differentially expressed ‘bin’ in the indicated idiopathic diseases.
Fig. 4
Fig. 4
Regulation of ‘bin’ activity. A, Differentially expressed MS-C RNA classes were determined after FDR adjustment. Expression levels of these MS-C RNAs were compared to their expression in MS-N and MS-E cohorts by linear regression. P values are the probability that the regression line is non-zero. B, RNAs differentially expressed in subjects with RA who were not on methotrexate therapy were identified by adjusting for CASE/CTRL FDR. Expression levels of these RNAs were determined ins subjects on current methotrexate therapy (RA+MTX) by determining RA-MTX/CTRL FDR+. Y-axis, FDR+=1, FDR−=0, X-axis: number of discrete transcripts in each of the RNA classes C, Proportion of differentially expressed RNAs unique to a single cohort or shared among different cohorts. Results for IBS are shown, see also Supplements Table 2.
Fig. 5
Fig. 5
LncRNA bins and disease-specific genetic polymorphisms. A, Left panel: Fraction of disease-associated SNPs identified by GWAS studies near novel IncRNA ‘bins’ per disease. Y-axis is the fraction of total SNPs per indicated disease near a IncRNA bin and the X-axis is the bin (0) + indicated extensions in kb from 5′ and 3′ ends. Right panel: P values. −log10 determined by C2 analysis. B, Genomic positions on chr12 transcribing unique IncRNAs (X-axis) relative to transcript level (FPKM avg. of each IncRNA in total sample set). Positions of SNPs associated with IBD are indicated by the arrows. C Linkage disequilibrium across the same genomic region on chr12. Y-axis: Linear regression relative to the indicated IBD-associated SNPs. filled black circles=linear regression compared to rs7134599, filled red circles=linear regression compared to rs1558744. Boxes indicate haplotypes in high (upper), moderate (middle), and low (bottom) linkage disequilibrium with the indicated SNPs. D, Association of IFNG. IL26, and IL22 transcript levels with indicated genotypes. Y-axes are transcript levels in whole blood relative to GAPDH for the given genotypes, rs 7134599 or rs1558744: A/A, N=40, A/C, N=64, G/G, N=32: rs2870946: A/A, N=120, A/G, N=22. E, Association of IFNG-R-49 transcript levels with indicated genotypes, Y-axes are transcript levels in whole blood relative to GAPDH for the given genotypes, subject #s and genotypes as in (d). F, Association between IFNG-R-49 and IFNG, IL26 and IL22 transcript levels in whole blood determined by linear regression analysis. Indicated transcripts normalized to GAPDH, p values are probability that the regression line is non-zero. G, Left panel: Fraction of disease-associated SNPs identified by GWAS studies near annotated IncRNA genes per disease. Y-axis is the fraction of total SNPs per indicated disease near a IncRNA bin and the X-axis is the bin (0) + indicated extensions in kb from 5′ and 3′ ends. Right panel: P values, −log10 determined by C2- analysis. Dashed lines indicate P<0.05.

References

    1. Rinn JL, Chang HY. Genome Regulation by Long Noncoding RNAs. Annu Rev Biochem. 2012;81:145–66. - PMC - PubMed
    1. Kapusta A, Feschotte C. Volatile evolution of long noncoding RNA repertoires: mechanisms and biological implications. Trends Genet. 2014;30:439–52. - PMC - PubMed
    1. Liu GQ, Mattick JS, Taft RJ. A meta-analysis of the genomic and transcriptomic composition of complex life. Cell Cycle. 2013;12:2061–72. - PMC - PubMed
    1. Morris KV, Mattick JS. The rise of regulatory RNA. Nat Rev Genet. 2014;15:423–37. - PMC - PubMed
    1. Pascual V, Chaussabel D, Banchereau J. A Genomic Approach to Human Autoimmune Diseases. Annu Rev Immunol. 2010;28:535–71. - PMC - PubMed

MeSH terms