

Use of Machine Learning Classifiers and Sensor Data to Detect Neurological Deficit in Stroke Patients
- PMID: 28420599
- PMCID: PMC5413803
- DOI: 10.2196/jmir.7092
Use of Machine Learning Classifiers and Sensor Data to Detect Neurological Deficit in Stroke Patients
Abstract
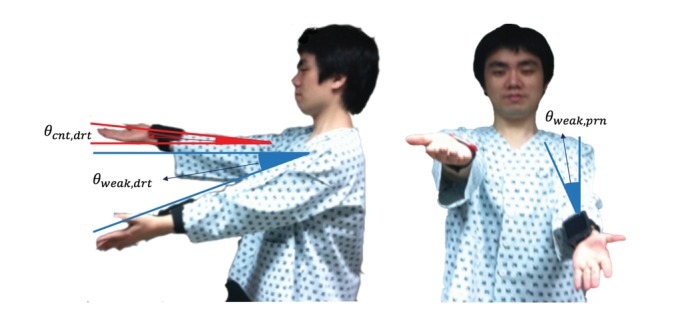
Background: The pronator drift test (PDT), a neurological examination, is widely used in clinics to measure motor weakness of stroke patients.
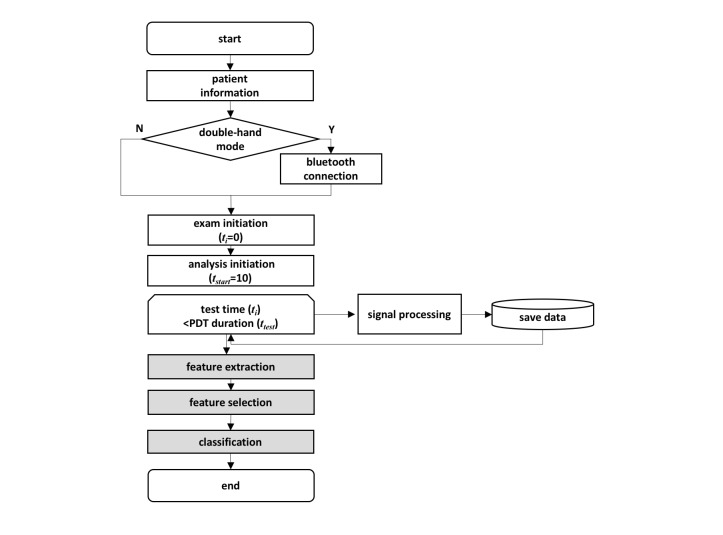
Objective: The aim of this study was to develop a PDT tool with machine learning classifiers to detect stroke symptoms based on quantification of proximal arm weakness using inertial sensors and signal processing.
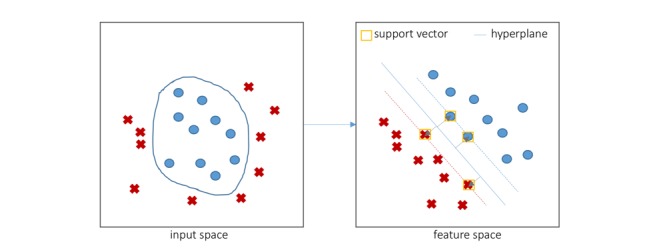
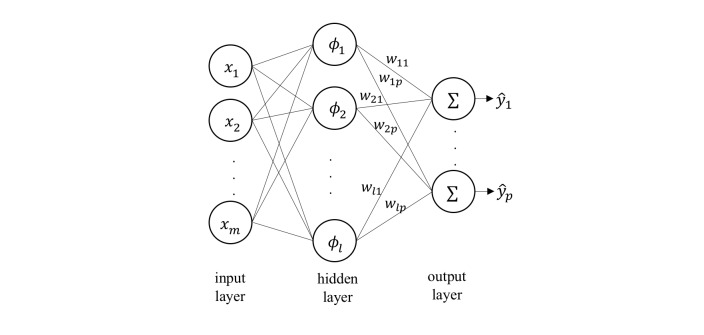
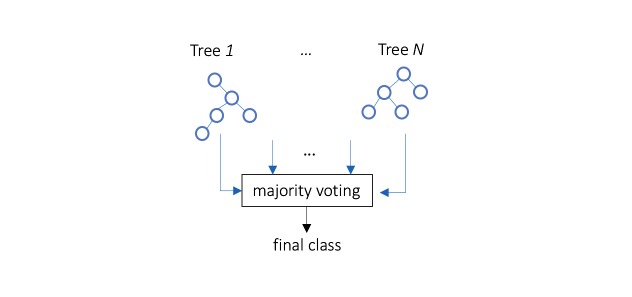
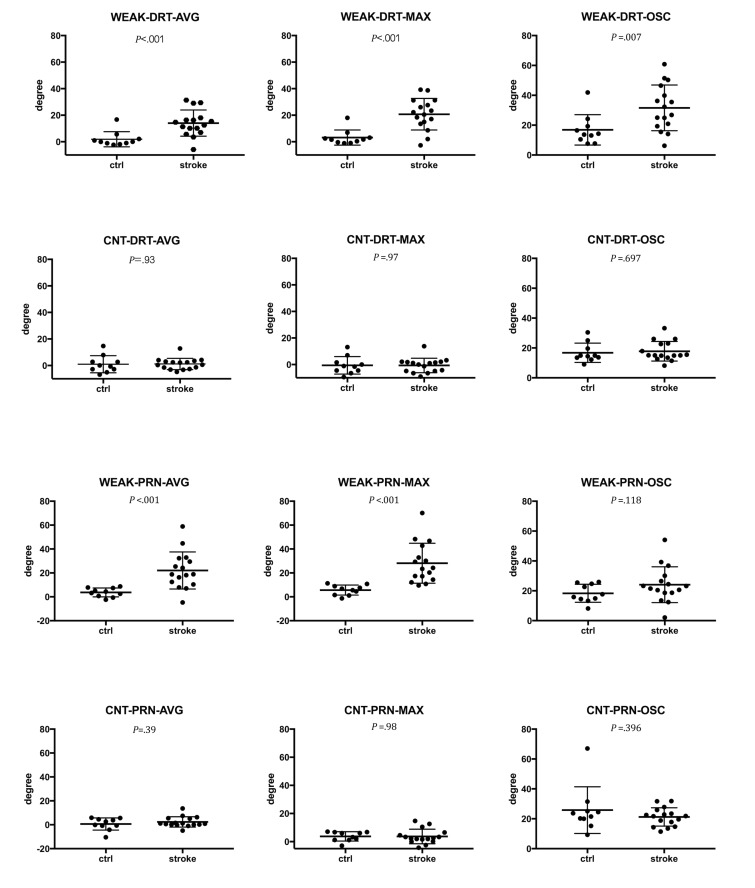
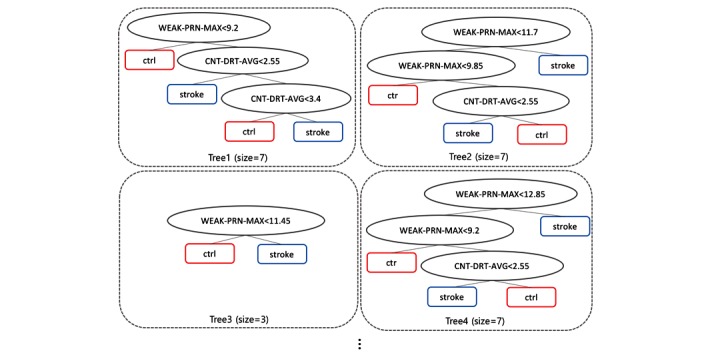
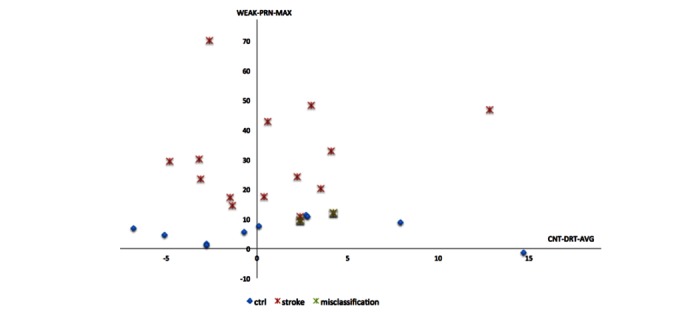
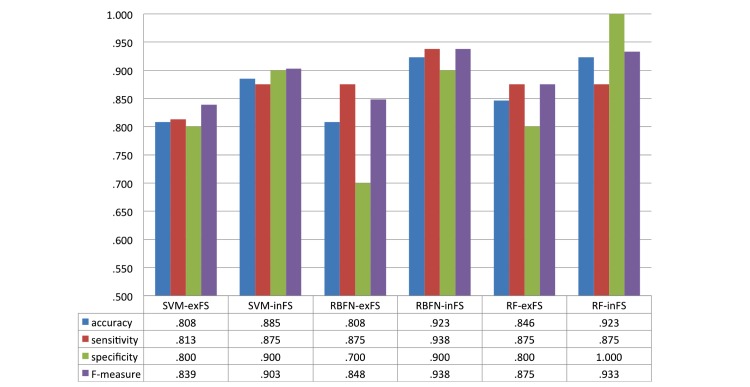
Methods: We extracted features of drift and pronation from accelerometer signals of wearable devices on the inner wrists of 16 stroke patients and 10 healthy controls. Signal processing and feature selection approach were applied to discriminate PDT features used to classify stroke patients. A series of machine learning techniques, namely support vector machine (SVM), radial basis function network (RBFN), and random forest (RF), were implemented to discriminate stroke patients from controls with leave-one-out cross-validation.
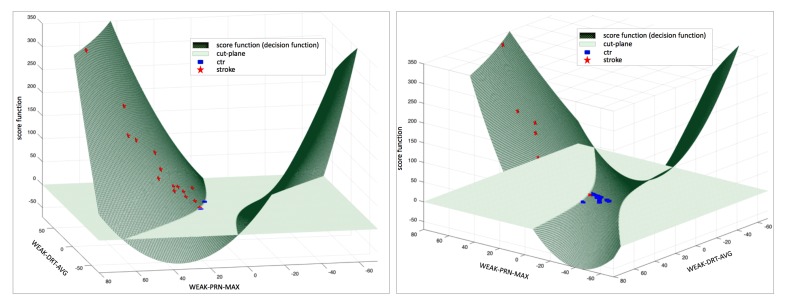
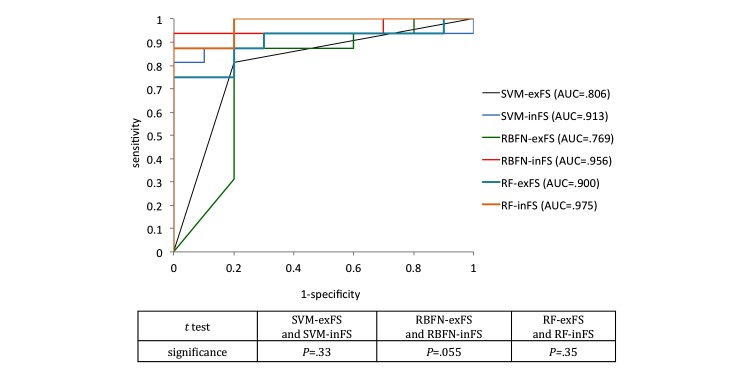
Results: Signal processing by the PDT tool extracted a total of 12 PDT features from sensors. Feature selection abstracted the major attributes from the 12 PDT features to elucidate the dominant characteristics of proximal weakness of stroke patients using machine learning classification. Our proposed PDT classifiers had an area under the receiver operating characteristic curve (AUC) of .806 (SVM), .769 (RBFN), and .900 (RF) without feature selection, and feature selection improves the AUCs to .913 (SVM), .956 (RBFN), and .975 (RF), representing an average performance enhancement of 15.3%.
Conclusions: Sensors and machine learning methods can reliably detect stroke signs and quantify proximal arm weakness. Our proposed solution will facilitate pervasive monitoring of stroke patients.
Keywords: machine learning; medical informatics; motor; neurological examination; stroke.
©Eunjeong Park, Hyuk-Jae Chang, Hyo Suk Nam. Originally published in the Journal of Medical Internet Research (http://www.jmir.org), 18.04.2017.
Conflict of interest statement
Conflicts of Interest: None declared.
Figures
References
-
- GBD 2015 Mortality and Causes of Death Collaborators Global, regional, and national life expectancy, all-cause mortality, and cause-specific mortality for 249 causes of death, 1980-2015: a systematic analysis for the Global Burden of Disease Study 2015. Lancet. 2016 Oct 08;388(10053):1459–1544. doi: 10.1016/S0140-6736(16)31012-1. https://linkinghub.elsevier.com/retrieve/pii/S0140-6736(16)31012-1 - DOI - PMC - PubMed
-
- Rathore SS, Hinn AR, Cooper LS, Tyroler HA, Rosamond WD. Characterization of incident stroke signs and symptoms: findings from the atherosclerosis risk in communities study. Stroke. 2002 Nov;33(11):2718–21. http://stroke.ahajournals.org/cgi/pmidlookup?view=long&pmid=12411667 - PubMed
-
- Teitelbaum JS, Eliasziw M, Garner M. Tests of motor function in patients suspected of having mild unilateral cerebral lesions. Can J Neurol Sci. 2002 Nov;29(4):337–44. - PubMed
-
- Hacke W, Kaste M, Bluhmki E, Brozman M, Dávalos A, Guidetti D, Larrue V, Lees KR, Medeghri Z, Machnig T, Schneider D, von KR, Wahlgren N, Toni D. Thrombolysis with alteplase 3 to 4.5 hours after acute ischemic stroke. N Engl J Med. 2008 Sep 25;359(13):1317–29. doi: 10.1056/NEJMoa0804656. - DOI - PubMed
MeSH terms
LinkOut - more resources
Full Text Sources
Other Literature Sources
Medical
