. 2017 Jun 9;292(23):9480-9492.
doi: 10.1074/jbc.M117.780197. Epub 2017 Apr 18.

A membrane-embedded pathway delivers general anesthetics to two interacting binding sites in the Gloeobacter violaceus ion channel

Affiliations

A membrane-embedded pathway delivers general anesthetics to two interacting binding sites in the Gloeobacter violaceus ion channel

Mark J Arcario et al. J Biol Chem. .

Abstract

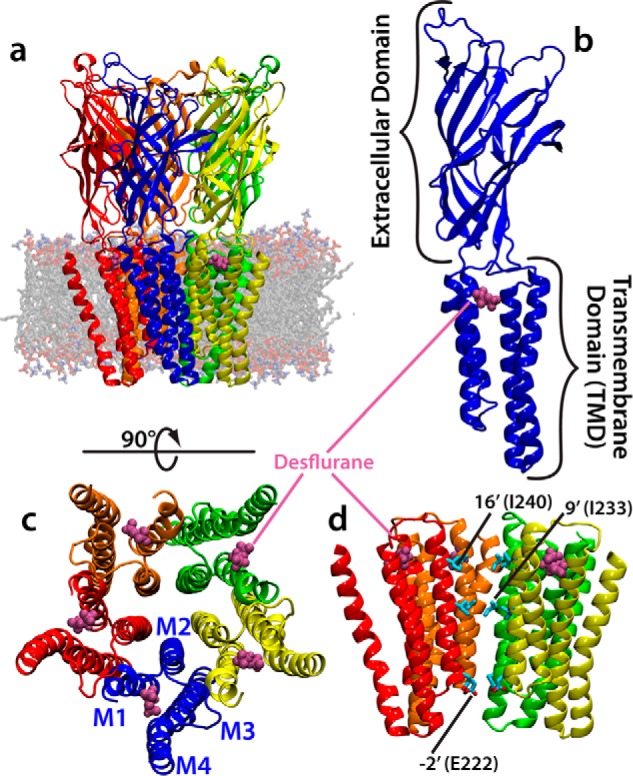
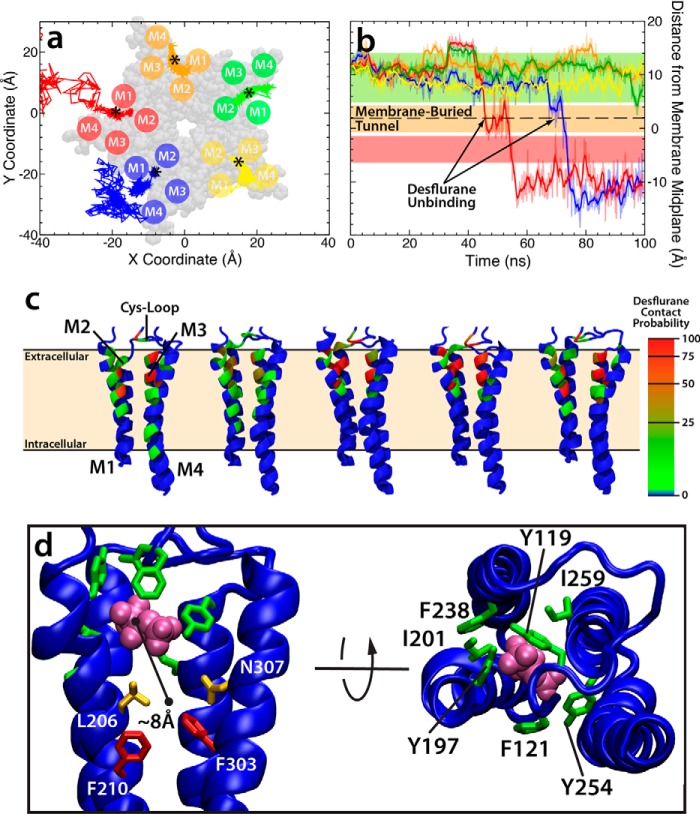
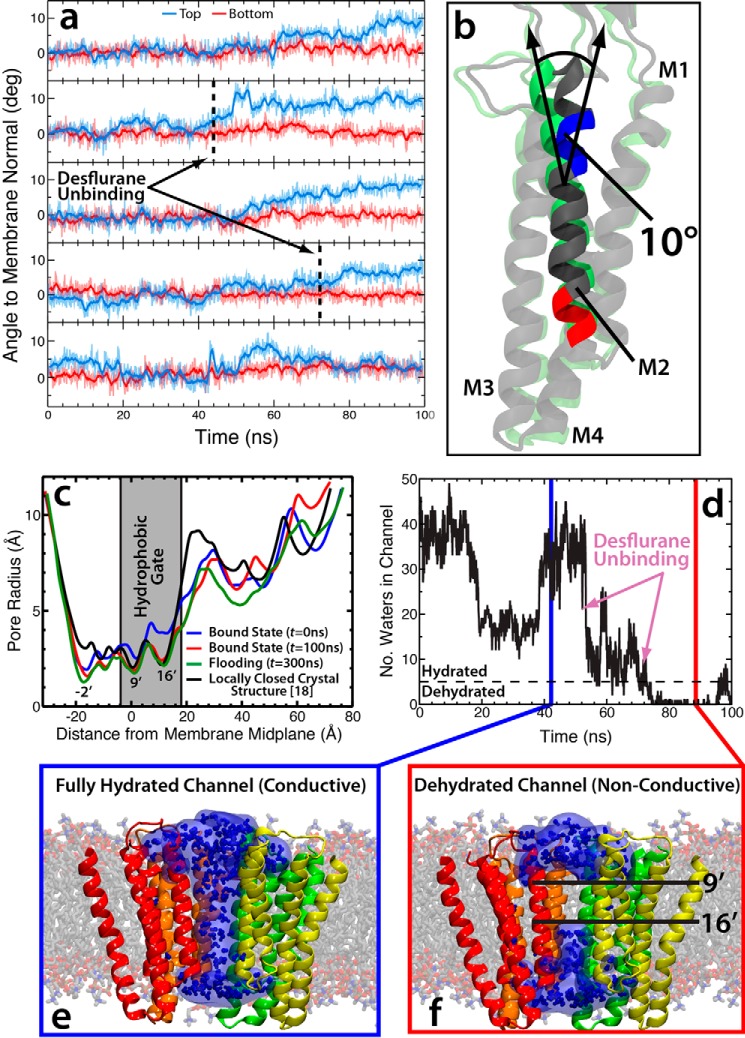
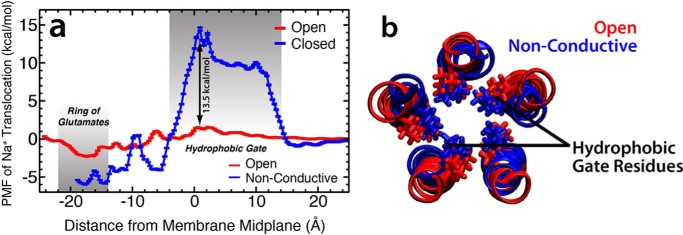
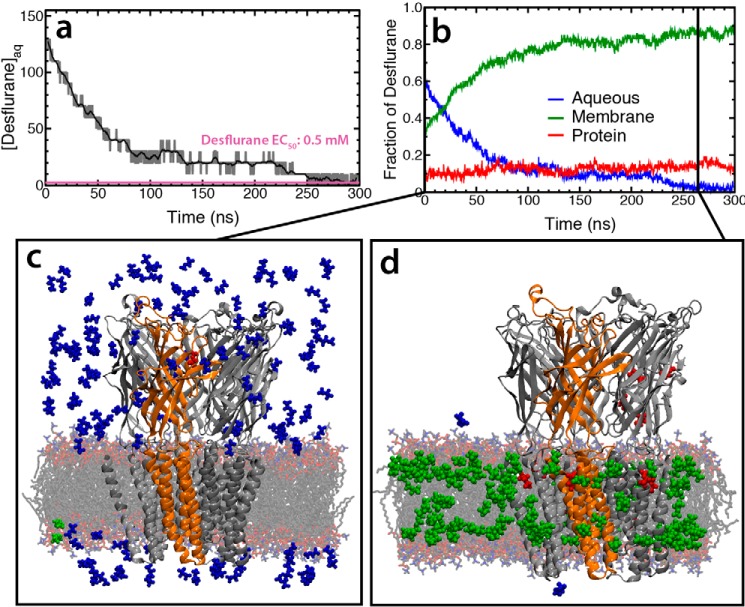
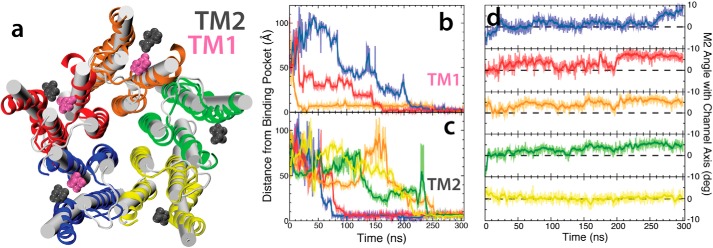
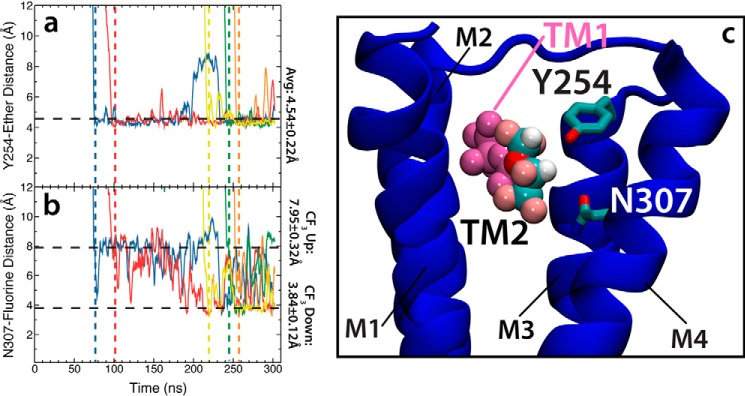
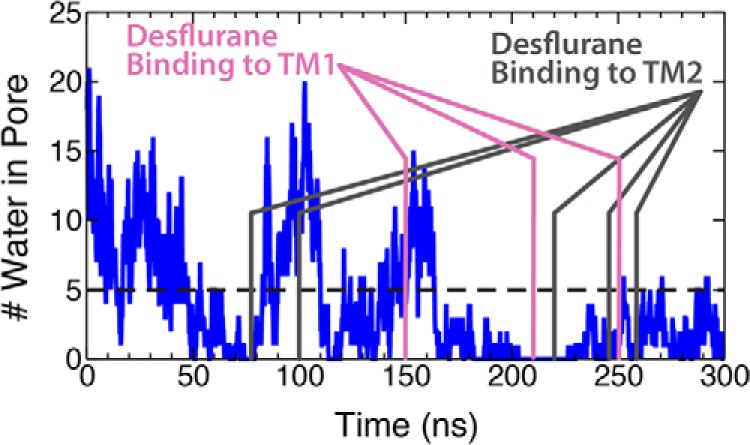
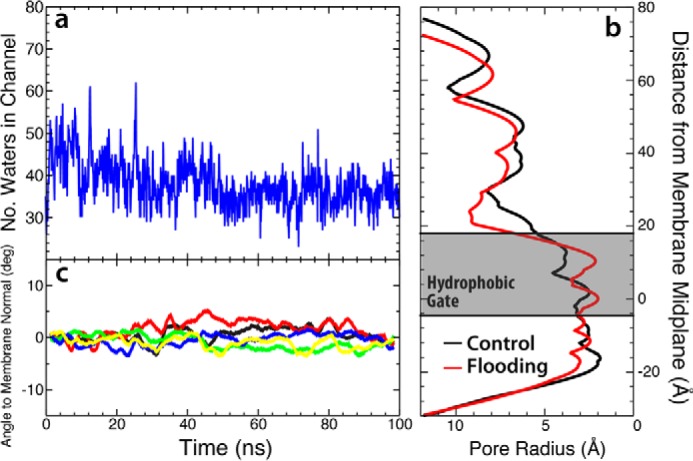
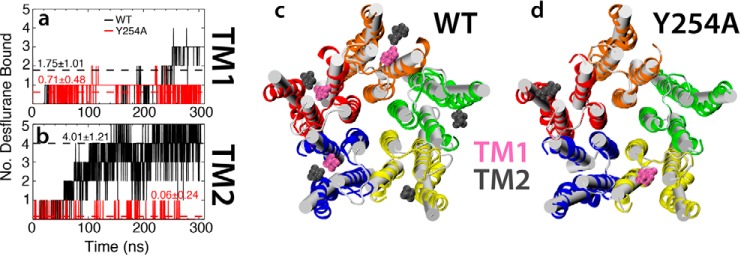
General anesthetics exert their effects on the central nervous system by acting on ion channels, most notably pentameric ligand-gated ion channels. Although numerous studies have focused on pentameric ligand-gated ion channels, the details of anesthetic binding and channel modulation are still debated. A better understanding of the anesthetic mechanism of action is necessary for the development of safer and more efficacious drugs. Herein, we present a computational study identifying two anesthetic binding sites in the transmembrane domain of the Gloeobacter violaceus ligand-gated ion channel (GLIC) channel, characterize the putative binding pathway, and observe structural changes associated with channel function. Molecular simulations of desflurane reveal a binding pathway to GLIC via a membrane-embedded tunnel using an intrasubunit protein lumen as the conduit, an observation that explains the Meyer-Overton hypothesis, or why the lipophilicity of an anesthetic and its potency are generally proportional. Moreover, employing high concentrations of ligand led to the identification of a second transmembrane site (TM2) that inhibits dissociation of anesthetic from the TM1 site and is consistent with the high concentrations of anesthetics required to achieve clinical effects. Finally, asymmetric binding patterns of anesthetic to the channel were found to promote an iris-like conformational change that constricts and dehydrates the ion pore, creating a 13.5 kcal/mol barrier to ion translocation. Together with previous studies, the simulations presented herein demonstrate a novel anesthetic binding site in GLIC that is accessed through a membrane-embedded tunnel and interacts with a previously known site, resulting in conformational changes that produce a non-conductive state of the channel.

Keywords: anesthetic; computational biology; ion channel; membrane protein; molecular dynamics.


Conflict of interest statement

The authors declare that they have no conflicts of interest with the contents of this article

Figures

Figure 1.
Figure 1.
Structure of GLIC. a, molecular image of the equilibrated system containing GLIC embedded in a membrane. GLIC is shown in a multicolor representation, each subunit a different color, with the position of bound desflurane molecules shown in magenta. b, a single subunit of the homopentameric GLIC channel composed of an extracellular domain and transmembrane domain. This view is from outside the channel toward the ion conduction pore. The position of bound desflurane within the subunit is shown. c, top view of the transmembrane domain of GLIC. Each subunit is composed of four helices labeled M1–M4 (shown in figure). The position of bound anesthetic is shown. d, side view of the ion conduction channel excluding one subunit for clarity. The position of −2′, 9′, and 16′ are shown for clarity. The hydrophobic gate is composed of the area between 9′ and 16′, whereas the selectivity filter is composed of the −2′ position.
Figure 2.
Figure 2.
Desflurane is loosely bound to the intrasubunit site identified in crystal structure. The data in this figure comes from the 100-ns simulation starting from the fully bound state in which desflurane is initially bound as observed from the crystal structure. a, plot of the position of each anesthetic projected onto the xy plane as a function of time. In the case of the blue and red subunits, desflurane spontaneously and completely exits the protein. The asterisk denotes the initial center of mass of each anesthetic at t = 0 ns. The structure of the TMD is shown in transparent gray van der Waals representation. The approximate location of the M1-M4 helices in each subunit is shown as a circle. b, plot of the height of the center of mass of each anesthetic as a function of time. The colored lines here represent the subunit the anesthetic was initially bound to in a. The colored bars correspond to the position of the amino acids pictured in d. Desflurane contact probabilities (c) are mapped onto the backbone of each residue for individual subunits as discussed under “Experimental Procedures.” The color on the protein corresponds to how often the desflurane in that subunit contacts the protein (defined as within 3.5 Å of any atom in the residue) and is adjusted so that a contact probability >50% is red. The first two subunits from the left are those in which the desflurane unbinds and exits. d, molecular images showing side and top views of the position of bulky residues that block the exit (green and red) and residues with comparatively smaller side chains that allow desflurane to exit into the lipid bilayer (orange). The color of the residues in this image corresponds to the same colored horizontal bars in b.
Figure 3.
Figure 3.
Binding asymmetry of anesthetics induces conformational transition. a, plots of the angles of the top (blue) and bottom (red) portions of the M2 helix for all five subunits in the simulation starting from the fully bound state. The black dashed lines in the second and fourth plots represent the time step where the desflurane exits the binding region in that subunit. b, molecular image showing the starting conformation (green) and asymmetrically bound conformation (gray) of the M2 helix. The red and blue portions of the helix shown in this image denote the residues used to measure the top and bottom angles in a. c, plots of the pore radius for the bound state simulation at t = 0 ns (blue) and t = 100 ns (red), the flooding simulation at t = 300 ns (green), and the locally closed crystal structure (black) (18) calculated using Hole (46). The −2′, 9′, and 16′ positions are labeled as well as the location of the presumed hydrophobic gate (gray box) where dehydration of the pore prevents ion conduction. d, number of water molecules in the hydrophobic gate (defined as Ile-233/Ile-240 or 9′/16′) as a function of time. The time points of desflurane unbinding in the bound state simulation is marked by the arrows, and the chosen hydration/dehydration cutoff (n = 5; Ref. 29) is shown as the dashed black line. e and f, molecular images showing the fully hydrated/conductive channel (e) and dehydrated/non-conductive channel (f). Only the TMD is shown, and one subunit has been removed for clarity. The protein is shown in schematic representation, whereas the water molecules are shown both as a surface, to demonstrate the gap in water, and as stick models.
Figure 4.
Figure 4.
Conformational transition of GLIC leads to non-conductance. a, the PMF for translocation of a single Na+ ion across both the open (red trace) and non-conductive (blue trace) GLIC states. The energy was set to 0 for both curves at z = 25 Å where the Na+ ion was in bulk aqueous solution. Two areas are highlighted in gray: the hydrophobic gate demarcated by positions 9′ to 16′ (14 > z > −4 Å) and the ring of glutamates at position −2′ (−14 > z > −22 Å). b, the structures of the M2 helices of the open (red) and non-conductive (blue) states used in the umbrella sampling calculations. Shown in stick models are the isoleucine residues at positions 9′ and 16′ for the open and non-conductive states.
Figure 5.
Figure 5.
Partitioning of desflurane into the membrane and GLIC in flooding simulation. a, aqueous concentration of desflurane as a function of simulation time. By the end of the simulation there was a fluctuation between 0 and 2 molecules of desflurane in aqueous solution that correlates to a fluctuation between 0 mm and 10 mm. However, the concentration could not have a value between 0 and 10 mm due to the size limits of the system. b, fraction of desflurane molecules in each phase (blue, aqueous; green, membrane; red, protein). It is clear that most of the molecules partition to the membrane within the first 100 ns. Snapshots of the system at the beginning (c) and end (d) of the simulation show the positions of every desflurane molecule in the system. The color of the desflurane molecule corresponds to its environment (blue, aqueous; green, membrane; red, protein).
Figure 6.
Figure 6.
Identification of a distinct binding region from flooding simulations. a, snapshot of the TMD of GLIC showing the initial (white cylinders) and final states (multicolor schematic) of the flooding simulation together with the TM1 (magenta) and TM2 (gray) binding regions. Only three of the five TM1 sites were occupied during the simulation, whereas all five TM2 sites were occupied. b and c, plots of the distance between the bound desflurane and the TM1 site (b) and TM2 site (c) are shown with the running average (averaged >30 ns) as the thick curve and the raw position data as the light trace. The colors in these plots correspond with the color of the subunits shown in a. d, plots of the M2 angle with the channel axis for each of the five subunits. The colors in these plots correspond with the color of the subunits shown in a.
Figure 7.
Figure 7.
Anesthetic-protein interactions at the newly identified TM2 site. a, plot of the distance between the hydroxyl group of Tyr-254 and the ether of the desflurane molecule bound to the TM2 site. Each color represents a different subunit, and the vertical dashed lines represent the time point at which the desflurane binds to the TM2 site in each subunit. The color of the dashed lines correlates with the color of the distance trace. b, plot of the distance between the trifluoromethyl (CF3) group of the desflurane bound to the TM2 site and the NH2 moiety of the Asn-307 amide. The vertical dashed lines represent initial binding of desflurane to the TM2 site. c, molecular image of the TM2 site with desflurane bound (multicolor van der Waals) and a desflurane molecule occupying the TM1-binding region (magenta van der Waals). Here, the protein backbone is shown in blue and Y254/Asn-307 are shown as multicolor stick models. Other subunits and the membrane are omitted for clarity.
Figure 8.
Figure 8.
Dehydration of the GLIC ion pore in flooding simulation. Plot of the number of water molecules in the hydrophobic gate in the flooding simulation. Here, the three magenta lines represent the time points when desflurane binds to the TM1 sites discussed previously. Here, dehydration is considered to be <5 water molecules in the hydrophobic gate as this is the number required to transport a Na+ (29).
Figure 9.
Figure 9.
Structure of GLIC channel in control simulation. a, plot of the water number in the hydrophobic gate as a function of simulation time. The number of waters in the hydrophobic gate remains constant throughout the simulation. b, plot of pore radius for both the control/anesthetic-free simulation (black) and the flooding simulation (red) found using the HOLE program (46). Presented here is the final frame of each simulation. c, plot of the angle between the M2 helix and the membrane normal as a function of time for each subunit, similar to Fig. 3a. The colors in this plot correspond to those of the individual subunits seen in Fig. 2a. Each trace is presented as a running average of the data in windows of 5 ns.
Figure 10.
Figure 10.
Y254A mutant decreases anesthetic interaction with the TM1-binding region. Plots of the number of desflurane molecules bound to the TM1 (a) and TM2 (b) sites over the duration of the simulation are shown for both the wild-type (black trace) and Y254A mutant (red trace). The dashed lines represent the average of the entire simulation, with the numbers representing the mean ± S.D. Molecular images of the TMD of both the wild type (c) and Y254A mutant (d) are shown, with the initial state displayed in white schematic and the final state displayed in multicolor ribbons, each subunit shown in a different color. In both images a representative snapshot of the system is shown with all anesthetics bound to the TM1 (pink van der Waals surface) and TM2 (gray van der Waals surface) regions.

References

    1. Meyer H. H. (1899) The Theory of Alcohol Anesthesia – First Communication. What property of anesthetics causes its narcotic effect? Arch. Exp. Pathol. Pharmakol. 42, 109–118
    1. Seeman P. (1972) The membrane actions of anesthetics and tranquilizers. Pharmacol. Rev. 24, 583–655 - PubMed
    1. Corringer P.-J., Baaden M., Bocquet N., Delarue M., Dufresne V., Nury H., Prevost M., and Van Renterghem C. (2010) Atomic structure and dynamics of pentameric ligand-gated ion channels: new insight from bacterial homologues. J. Physiol. 588, 565–572 - PMC - PubMed
    1. Thompson A. J., Lester H. A., and Lummis S. C. (2010) The structural basis of function in Cys-loop receptors. Q. Rev. Biophys. 43, 449–499 - PubMed
    1. Forman S. A., and Miller K. W. (2011) Anesthetic sites and allosteric mechanisms of action on Cys-loop ligand-gated ion channels. Can. J. Anesth. 58, 191–205 - PMC - PubMed

MeSH terms

LinkOut - more resources