

The transcription factor bZIP14 regulates the TCA cycle in the diatom Phaeodactylum tricornutum
- PMID: 28420744
- PMCID: PMC5452028
- DOI: 10.15252/embj.201696392
The transcription factor bZIP14 regulates the TCA cycle in the diatom Phaeodactylum tricornutum
Abstract
Diatoms are amongst the most important marine microalgae in terms of biomass, but little is known concerning the molecular mechanisms that regulate their versatile metabolism. Here, the pennate diatom Phaeodactylum tricornutum was studied at the metabolite and transcriptome level during nitrogen starvation and following imposition of three other stresses that impede growth. The coordinated upregulation of the tricarboxylic acid (TCA) cycle during the nitrogen stress response was the most striking observation. Through co-expression analysis and DNA binding assays, the transcription factor bZIP14 was identified as a regulator of the TCA cycle, also beyond the nitrogen starvation response, namely in diurnal regulation. Accordingly, metabolic and transcriptional shifts were observed upon overexpression of bZIP14 in transformed P. tricornutum cells. Our data indicate that the TCA cycle is a tightly regulated and important hub for carbon reallocation in the diatom cell during nutrient starvation and that bZIP14 is a conserved regulator of this cycle.
Keywords: Phaeodactylum tricornutum; bZIP; diurnal; nitrogen; tricarboxylic acid cycle.
© 2017 The Authors.
Figures
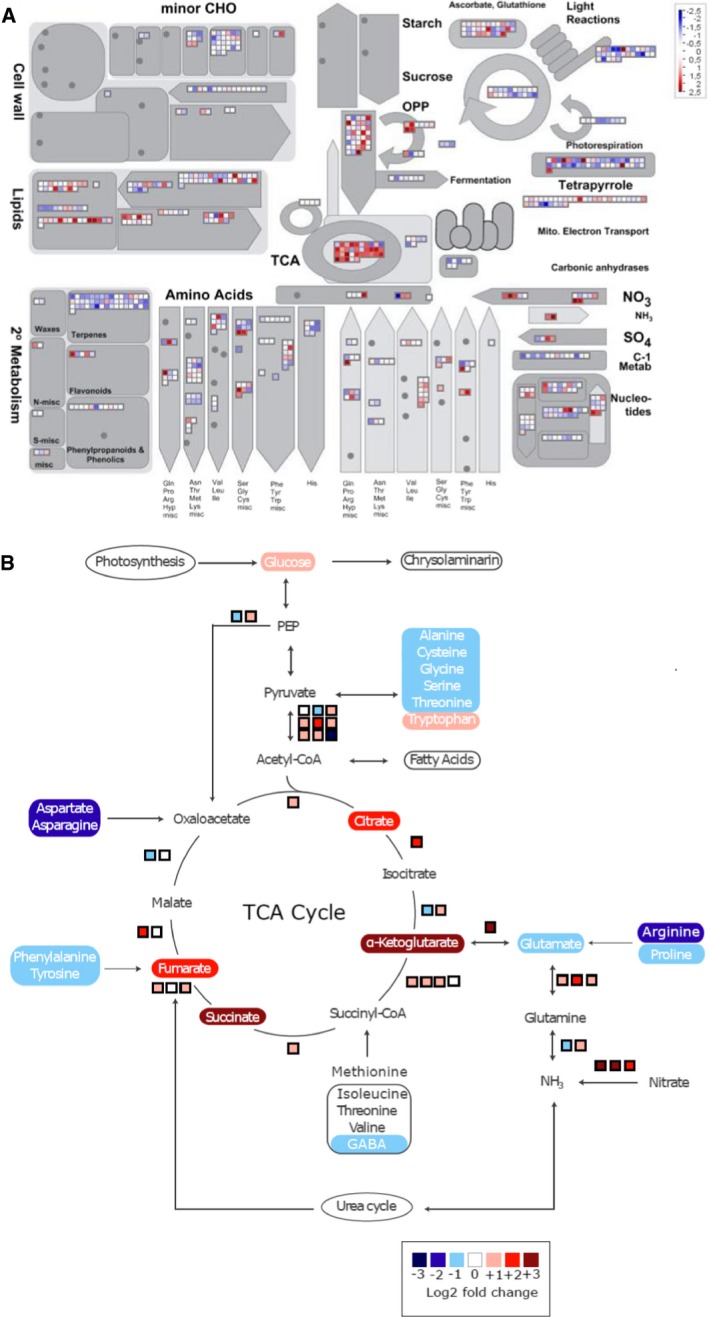
Overview of reprogramming of primary metabolism as visualized by the MapMan program and using the normalized RNA‐Seq data. Points represent the log2 fold change in gene expression in nitrogen‐starved cells 20 h after medium change versus control cells at the same time point. Red and blue indicate gene induction and repression, respectively.
Overview of amino acid degradation and central carbon metabolism (adapted from Hockin et al, 2012 and Obata et al, 2013). Not all reaction products are shown, and some arrows represent more than one reaction. Measured metabolites are indicated by rectangles of which the colours indicate relative log2 fold change in nitrogen‐starved versus control cells at 20 h. Pathways are indicated by ovals. Coloured boxes next to arrows indicate mRNA expression changes in log2 fold change of FPKM values of the nitrogen‐starved sample versus the control sample at 20 h.
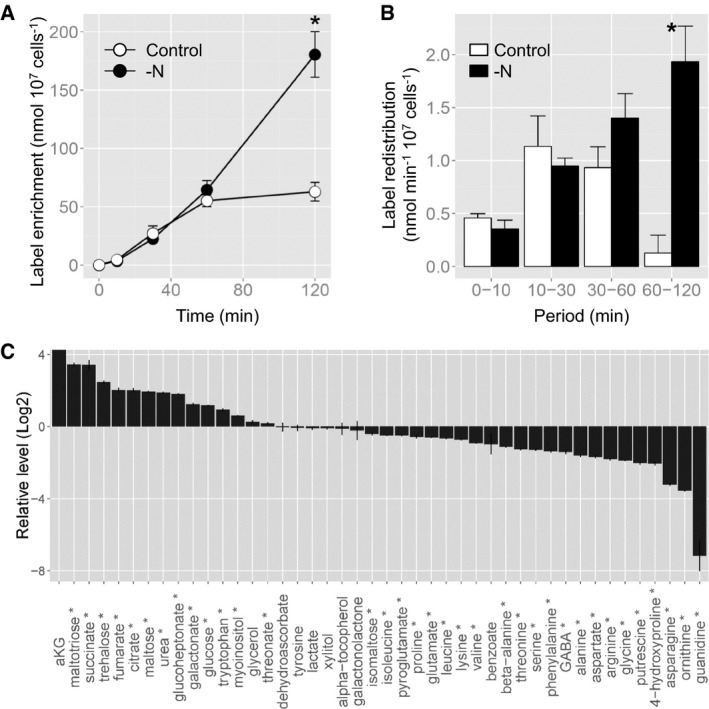
Time course of 13C enrichment in citrate. The asterisk indicates the time period at which the values are significantly different between nitrogen‐depleted and control cells by a Student's t‐test (P < 0.05).
Label redistribution in citrate during the periods of 0–10, 10–30, 30–60, and 60–120 min. The asterisk indicates the time period at which the values are significantly different between nitrogen‐depleted and control cells by a Student's t‐test (P < 0.05).
The log2 fold changes in metabolite levels in nitrogen‐starved versus control cells following 20 h of culturing in nitrogen‐depleted conditions. The metabolites marked by an asterisk were significantly altered between control and nitrogen‐depleted conditions by a Student's t‐test (P < 0.05). α‐ketoglutarate (aKG) was detected only in nitrogen‐starved cells.
- A, B
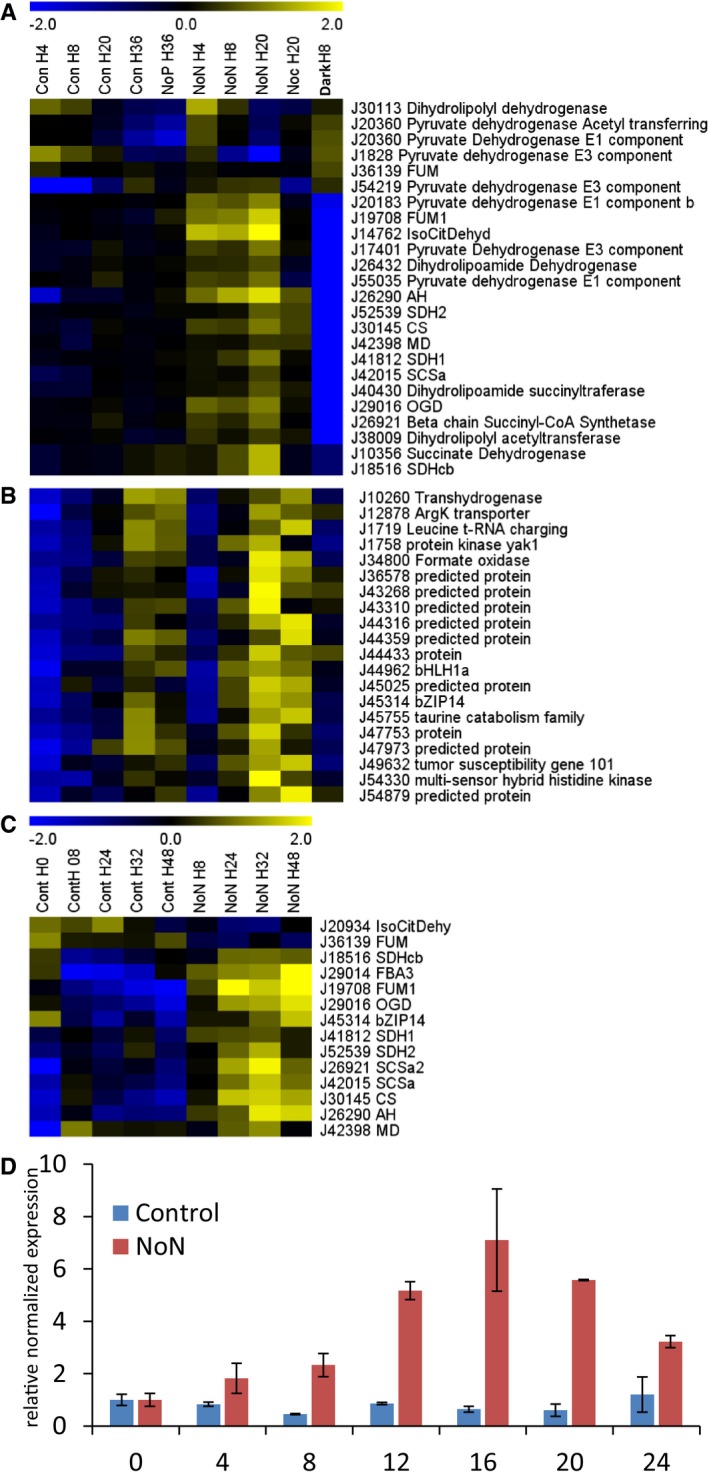
Expression profile of TCA cycle genes (A) and bZIP14 co‐expression cluster (B) during nitrogen starvation. Cluster analysis was performed based on Fragments Per Kilobase Of Exon Per Million Fragments Mapped (FPKM) values normalized to the average FPKM value across all samples. Yellow and blue indicate gene induction and repression, respectively. Con, control cells; NoN, nitrogen‐depleted cells; NoP, phosphate‐starved cells; Noc, nocodazole‐treated cells; Dark, dark‐placed cells; H, hours.
- C
Expression pattern of TCA cycle genes during nitrogen starvation assessed by qRT–PCR on an independent repeat of the RNA‐Seq time course (n = 3). Cells grown in nitrogen‐repleted and ‐depleted conditions were harvested at the indicated time points to confirm the expression pattern of the TCA cycle genes observed in the RNA‐Seq analysis.
- D
Expression pattern of bZIP14 during nitrogen starvation assessed by qRT–PCR on an independent repeat of the RNA‐Seq time course. Values in the y‐axis represent the relative normalized expression ± SE of two biological repeats (each in three technical repeats) relative to the levels at time point 0 (set at 1). The x‐axis indicates time in hours.
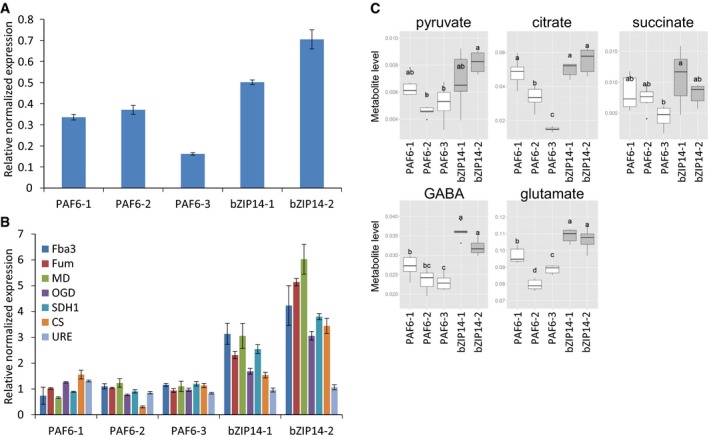
Verification of bZIP14 overexpression in transformed P. tricornutum cells by qRT–PCR (n = 3). Three control (PAF6) and two bZIP14 OE lines were assessed. The control lines are empty vector transformed. Values in the y‐axis represent the relative normalized expression to the two reference genes used ± SE of three technical repeats.
Determination of TCA cycle transcript levels in bZIP14 overexpression lines by qRT–PCR (n = 3). During nitrogen starvation, Urease (URE, Phatr3_J29702) transcript levels were over threefold upregulated (Dataset EV1), illustrating that the transformed cell lines did not lack nitrogen in the condition assayed here. FBA3: fructose bisphosphate aldolase 3, Phatr3_J29014; MD: malate dehydrogenase, Phatr3_J42398; FUM: fumarase, Phatr3_J36139; OGD: 2‐oxoglutarate dehydrogenase E1 component, Phatr3_J29016; CS: citrate synthase, Phatr3_J30145; SDH1: succinate dehydrogenase flavoprotein, Phatr3_J41812.
Metabolite levels of the TCA cycle‐related organic acids (pyruvate, citrate, and succinate), glutamate, and gamma‐butyric acid (GABA) in bZIP14 overexpression lines (n = 6). Box plots show relative metabolite levels. The box and the horizontal line within the box represent the data at first and third quartile and median, respectively. The ends of vertical bars show maximum and minimum values. Letters indicate the results of a Tukey's test comparing metabolite levels amongst genotypes.
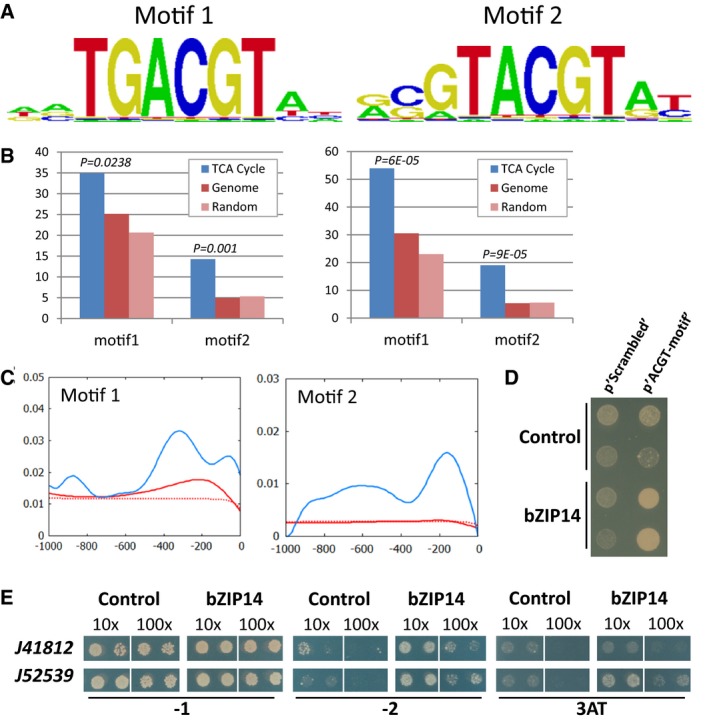
TF binding sites as predicted by the protein binding array represented as positional weight matrixes. Shown are the two binding motifs obtained by generating the consensus motif from all oligonucleotides bound by the recombinant protein with an E‐score > 0.45.
Scan for the bZIP14 motifs in all P. tricornutum gene promoters (genome, in red; random promoters, in light red) or only those linked to the TCA cycle (in blue). Left and right panels show the % promoters with motif 1 or 2 and the number of motifs per promoter, respectively, within 0.5 kb upstream of the ORF. P‐values correspond to the comparison between the promoters of the TCA cycle containing the motif and all the promoters of the genome containing the same motif (hypergeometric distribution).
Histogram showing an increased density of the bZIP14 motifs in the proximal promoter regions of the “TCA cycle genes” (in blue), compared with those in the whole genome (in red) or in random promoters (dashed red). The complete scan of 1.0 kb upstream of the ORF is shown.
Y1H analysis with a synthetic promoter. The full‐length bZIP14 ORF fused to GAL4AD (bZIP14) or the empty vector control (control) was expressed in reporter strains harbouring the HIS3 gene under control of a synthetic promoter element consisting of both bZIP14 motif1 and motif2 with random nucleotide spacers (p'ACGT‐motif') or a scrambled version (p'Scrambled') thereof. Transformed yeast cultures dropped in serial dilutions (10‐ and 100‐fold) were grown for 6 days on selective medium (minus histidine and plus 3‐AT).
Y1H analysis with diatom gene promoters. The full‐length bZIP14 ORF fused to GAL4AD (bZIP14) or the empty vector control (control) was expressed in reporter strains harbouring the HIS3 gene under control of a 150‐bp and 219‐bp promoter sequence of the P. tricornutum genes Phatr3_J41812 and (mitochondrial succinate dehydrogenase iron‐sulphur subunit) Phatr3_J52539, respectively. Transformed yeast cultures (two independent transformants) dropped in serial dilutions (10‐ and 100‐fold) were grown for 6 days on control medium (−1) and selective medium (minus histidine (−2) or minus histidine plus 3‐AT (3AT)).
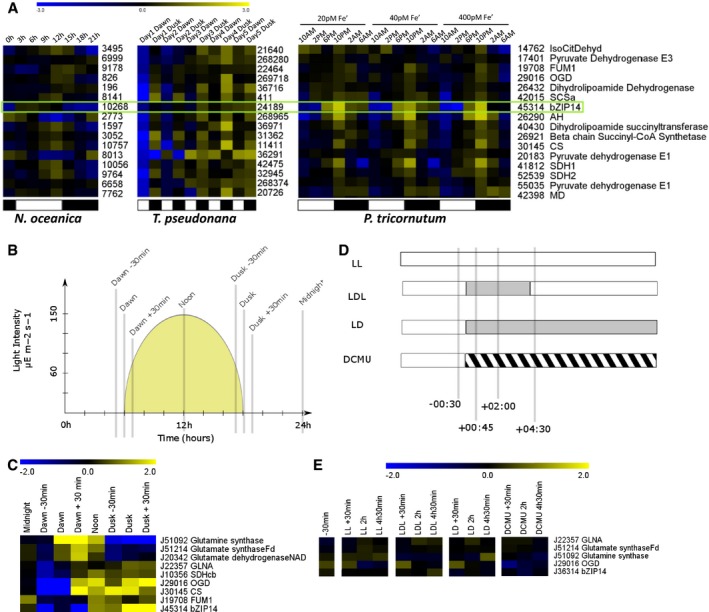
Meta‐analysis of the expression patterns of bZIP14 orthologues in three different species of heterokonts, derived from independent transcriptomics datasets, that is, from left to right Nannochloropsis oceanica (Poliner et al, 2015), Thalassiosira pseudonana (Ashworth et al, 2013) and P. tricornutum (Smith et al, 2016). The numbers reflect CCMP1779, Thapsdraft3, and Phatr3 identifiers, respectively. FPKM values were log2 transformed and centred for comparison. Yellow and blue indicate gene induction and repression, respectively. The green box highlights the expression of bZIP14 orthologues, suggesting that its diurnal expression pattern is conserved. Representative genes from the TCA cycle were retrieved from the Smith et al (2016) dataset and clustered (Spearman's rank) after normalization. Orthologous genes in T. pseudonana and N. oceanica were identified by BLASTP, normalized, and ranked in the same order. Approximate light regimes are indicated below the clusters as light (white) and dark (black). Enzyme abbreviations are identical to those in Fig 3.
Cartoon illustrating the growing conditions and sampling points (grey bars) of cells grown in a 12‐h:12‐h diurnal rhythm. The yellow surface indicates the light intensity (values indicated in the y‐axis).
Heatmap of log2 transformed and centred transcript data for selected nitrogen assimilation and TCA cycle genes. Expression was determined by qRT–PCR (n = 3). Yellow and blue indicate gene induction and repression, respectively. Enzyme abbreviations are identical to those in Fig 3. GLNA, type III glutamine synthase.
Treatments on continuously illuminated cells. Bars indicate sampling points relative to treatment start. Grey and hatched areas indicate dark and DCMU treatment, respectively. LL, continuous light; LDL, continuous light interrupted by a period of darkness; LD, continuous light followed by darkness; DCMU, DCMU‐treated cells in the light.
Heatmap of log2 transformed and centred transcript data for selected nitrogen assimilation and TCA cycle genes. Expression was determined by qRT–PCR (n = 3). Yellow and blue indicate gene induction and repression, respectively.
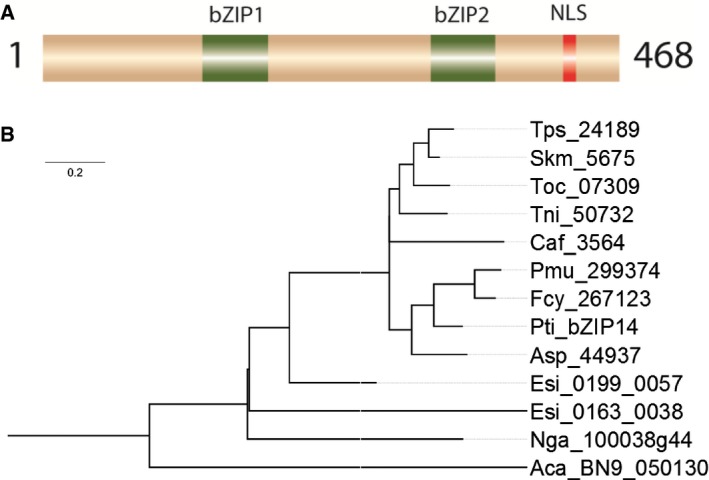
Schematic representation of bZIP14. NLS, nuclear localization signal; bZIP, basic leucine zipper domain.
Phylogenetic analysis of heterokont proteins with two bZIP domains. Aca: Albugo candida; Asp: Amphiprora sp.; Caf: Chaetoceros affinis; Esi: Ectocarpus siliculosus; Fcy: Fragilariopsis cylindrus; Nga: Nannochloropsis gaditana; Pmu: Pseudonitzschia multiseries; Pti: Phaeodactylum tricornutum; Skm: Skeletonema‐menzelii; Tni: Thalassiosira nitzschioides; Toc: Thalassiosira oceanica; Tps: Thalassiosira pseudonana.
References
-
- Allen AE, Dupont CL, Obornik M, Horák A, Nunes‐Nesi A, McCrow JP, Zheng H, Johnson DA, Hu H, Fernie AR, Bowler C (2011) Evolution and metabolic significance of the urea cycle in photosynthetic diatoms. Nature 473: 203–207 - PubMed
-
- Armbrust EV, Berges JA, Bowler C, Green BR, Martinez D, Putnam NH, Zhou S, Allen AE, Apt KE, Bechner M, Brzezinski MA, Chaal BK, Chiovitti A, Davis AK, Demarest MS, Detter JC, Glavina T, Goodstein D, Hadi MZ, Hellsten U et al (2004) The genome of the diatom Thalassiosira pseudonana: ecology, evolution, and metabolism. Science 306: 79–86 - PubMed
Publication types
MeSH terms
Substances
LinkOut - more resources
Full Text Sources
Other Literature Sources
Molecular Biology Databases
