. 2017 May;29(5):1137-1156.
doi: 10.1105/tpc.16.00899. Epub 2017 Apr 18.

The Mitochondrial DNA-Associated Protein SWIB5 Influences mtDNA Architecture and Homologous Recombination

Affiliations

The Mitochondrial DNA-Associated Protein SWIB5 Influences mtDNA Architecture and Homologous Recombination

Jonas Blomme et al. Plant Cell. 2017 May.

Abstract

In addition to the nucleus, mitochondria and chloroplasts in plant cells also contain genomes. Efficient DNA repair pathways are crucial in these organelles to fix damage resulting from endogenous and exogenous factors. Plant organellar genomes are complex compared with their animal counterparts, and although several plant-specific mediators of organelle DNA repair have been reported, many regulators remain to be identified. Here, we show that a mitochondrial SWI/SNF (nucleosome remodeling) complex B protein, SWIB5, is capable of associating with mitochondrial DNA (mtDNA) in Arabidopsis thaliana Gain- and loss-of-function mutants provided evidence for a role of SWIB5 in influencing mtDNA architecture and homologous recombination at specific intermediate-sized repeats both under normal and genotoxic conditions. SWIB5 interacts with other mitochondrial SWIB proteins. Gene expression and mutant phenotypic analysis of SWIB5 and SWIB family members suggests a link between organellar genome maintenance and cell proliferation. Taken together, our work presents a protein family that influences mtDNA architecture and homologous recombination in plants and suggests a link between organelle functioning and plant development.


Figures

Figure 1.
Figure 1.
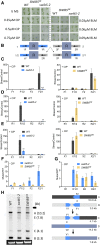
Effect of Genotoxic Stress Treatment on Plant Growth and Accumulation of Intermediate Repeat Crossover Products. (A) Wild-type, swib5-2, and SWIB5OE plants were germinated on 0.5× MS medium and 0.5× MS medium supplemented with the concentration of CIP or BLM indicated. For each condition, four representative plants were selected. (B) Simplified scheme explaining the amplification with qPCR of sequences 1 and 2 comprising a repeated sequence (blue R box) and the crossover products 1/2 and 2/1. Scheme adapted from Miller-Messmer et al. (2012). (C) Accumulation of repeat F crossover products in wild-type, swib5-2, and SWIB5OE plants grown on 0.75 μM CIP relative to levels when grown on 0.5× MS medium (n = 3). (D) Accumulation of repeat R crossover products in wild-type, swib5-2, and SWIB5OE plants grown on 0.75 μM CIP relative to levels when grown on 0.5× MS medium (n = 3). (E) Accumulation of repeat X crossover products in wild-type, swib5-2, and SWIB5OE plants grown on 0.75 μM CIP relative to levels when grown on 0.5× MS medium (n = 3). (F) Accumulation of repeat F crossover products in swib5-2 and SWIB5OE plants grown on 0.5× MS medium compared with the wild type (n = 3 SWIB5OE; n = 31 for swib5_2). (G) Accumulation of repeat R crossover products in swib5-2 and SWIB5OE plants grown on 0.5× MS medium compared with the wild type (n = 3). (H) DNA gel blot hybridization of wild-type, swib5-2, and SWIB5OE DNA from seedlings and schematic interpretation of the results (scheme adapted from Arrieta-Montiel et al., 2009). The F repeated sequence was used as probe. The size of the parental sequences (A and B), and primary and secondary recombination molecules (C and E) are denoted. The full recombination product of the F repeated sequence is indicated with an arrow. Molecule D does not hybridize with the probe used in this experiment. Below the blot, SYBR Safe-stained uncut DNA is shown as a loading control. In (C) to (G), For each biological replicate (n), DNA was extracted from 14-d-old seedlings grown on the indicated conditions. Two technical replicates were performed on each biological replicate. Graph represents mean ± se. One, two, or three asterisks indicate significant differences within a 5, 1, or 0.1% confidence interval, respectively, between the wild type and mutants (two-way ANOVA; see ANOVA tables in Supplemental Data Set 1).
Figure 2.
Figure 2.
SWIB5 Associates with mtDNA. (A) Components of the GSgreen tag fused to SWIB5. GSgreen consist of a Streptavidin Binding Peptide (SBP), two rhinovirus 3C protease, and two tobacco etch virus (TEV) protease cleavage sites and GFP. (B) Selected region for ChIP-qPCR. Thirty-six primers (black bars) were designed between both copies of the F repeated region. The coordinates on the mtDNA, 130285 to 170809, are given together with the open reading frames (green) and repeated regions (blue) within this region. (C) ChIP-qPCR results for cross-linked and non-cross-linked seedlings expressing 35Spro:SWIB5:GSgreen. Fold enrichment is given for samples immunoprecipitated with anti-GFP relative to samples immunoprecipitated with anti-IgG antibody (n = 3). For each biological replicate (n), 14-d-old seedlings expressing 35Spro:SWIB5:GSgreen were harvested. Two technical replicates were performed on each biological replicate. Graphs represent mean ± se. One, two, or three asterisks indicate significant differences within a 5, 1, or 0.1% confidence interval, respectively, for samples immunoprecipitated with anti-GFP versus anti-IgG (linear model).
Figure 3.
Figure 3.
Transcriptional Changes in swib5-2 and SWIB5OE. (A) Quantification of steady state mitochondrial transcript levels. RNA was extracted from 14-d-old seedlings, and transcripts (mRNA and rRNA) were quantified according to Delannoy et al. (2015). (B) Genes from the mitochondrial dysfunction stimulon (MDS; De Clercq et al., 2013) showing a significant up- or downregulation in swib5-2 and/or SWIB5OE seedlings. The expression profiles of all genes of the MDS are shown in Supplemental Figure 7B. For each biological replicate (n), 14-d-old seedlings were harvested. Two technical replicates were performed on each biological replicate. Graphs represent mean ± se. One, two, or three asterisks indicate significant differences within a 5, 1, or 0.1% confidence interval, respectively, between the wild type and mutants (linear model).
Figure 4.
Figure 4.
Protein Interaction Partners of SWIB5. Transient expression of SWIB5, SWIB4, and SWIB6 fused with head or tail GFP (hGFP/tGFP) at their C termini. The GFP signal, bright-field image, and overlay are displayed. As a positive control, transient expression of 35Spro:SWIB5:GSgreen is shown. Bar = 10 mm.
Figure 5.
Figure 5.
Expression Studies of Genes Encoding Organellar SWIB Proteins. (A) Relative expression of SWIB genes, measured in wild-type plants by qRT-PCR. The samples include 4- (n = 2), 10- (n = 4), and 21-d-old (n = 4) seedlings, and 8-d-old root (n = 4) and flower (n = 1) tissue. (B) Normalized expression of SWIB4, SWIB5, and SWIB6 during leaf development. For leaf development, we used a microarray analysis performed over six consecutive days during early development of the third true leaf, i.e., at 8 to 13 DAS (Andriankaja et al., 2012). This data set encompasses the developmental phases during which the third leaf exclusively grows through cell proliferation (Prol; 8–9 DAS), followed by a transitioning phase (Tran; 10–11 DAS) and cell expansion-based growth (Exp; 12–13 DAS). The expression profiles of the DEGs were normalized using TMeV software (www.tm4.org) and subsequently CAST clustered (using Pearson correlation at a threshold of 0.8) according to their specific profiles over the developmental zones. (C) Normalized expression of SWIB4, SWIB5, and SWIB6 during root development. For the expression patterns during root development, a microarray analysis of a total of 15 different zones of the root corresponding to different tissues and developmental stages was used (Birnbaum et al., 2003). The expression profile in the different root tissue types was averaged for each gene and corresponded to three zones of root development: the root tip where cells are proliferating (Prol), the zone in which cells are transitioning (Tran) to expansion, and the zone consisting of fully expanded and differentiated cells (Exp). Normalization and clustering of genes were performed as in (B). (D) Relative expression level of SWIB5 during early leaf development. Third vegetative leaves were harvested at 8 to 11 DAS and SWIB5 transcript levels were measured with qRT-PCR. For each biological replicate (n), the indicated developmental stages and tissues were harvested. Two technical replicates were performed on each biological replicate. Two technical replicates were performed on each biological replicate. Values are averages ± se.
Figure 6.
Figure 6.
Phenotypic Characterization of swib5-2 and SWIB5OE. (A) Rosette phenotype of 3-week-old plants grown in soil and 2-week-old wild-type, swib5-2, and SWIB5OE plants grown in vitro. (B) Leaf area, cell number, and cell area of the third vegetative leaf at 21 DAS. Eighteen plants were analyzed per line. (C) Area of the third vegetative leaf of the SWIB5OE transgenic line over time (8–21 DAS). The insert shows the leaf area at 8 and 9 DAS. On average, 42 plants per line and time point were analyzed. (D) Cell number of the third vegetative leaf at 8 to 13 DAS. The inset indicates the cell number at 8 and 9 DAS. Eighteen plants per line and time point were analyzed. (E) Cell area of the third vegetative leaf at 8 to 13 DAS. Eighteen plants per line and time point were analyzed. (F) Area of the SAM of wild-type and SWIB5OE plants. Eight plants per line were analyzed. (G) Primary root length over time (3–14 DAS). Twenty-two plants per line were analyzed. Three biological replicates were performed; the total number of analyzed plants is indicated for each panel. All values are averages ± se; statistical significance is indicated as *P < 0.05, **P < 0.01, or ***P < 0.001. (A), (F), and (G) Linear model. (C) to (E) and (H) Mixed model.
Figure 7.
Figure 7.
Mitochondrial Phenotypes in swib5-2 and SWIB5OE. (A) Area of mitochondria in the wild type, swib5-2, and SWIB5OE at 10 and 21 DAS. At 10 DAS, the areas were measured at the base and the tip of leaves; at 21 DAS, they were measured from whole leaves. (B) Cell area measured at the base and the tip of leaves at 10 DAS. (C) Representative image of mitochondria from 21-d-old leaves in the wild type and swib5-2; mitochondria are indicated with black arrows. (D) BN-PAGE separation of mitochondrial protein complexes. After electrophoresis, the gel was stained by Coomassie blue-colloidal. The complexes of the electron transport chain are indicated. (E) Protein gel blot analysis of mitochondrial proteins. Isolated mitochondrial proteins (5 or 10 μg) were separated on polyacrylamide gels, which were blotted and incubated with the indicated antibodies. (F) Complex I activity stain on isolated mitochondria. Quantification of relative supercomplex I+III and Complex I band intensity using ImageJ software (n = 2). As a control, the activity of nonspecific bands was quantified. The inset shows a representative gel. BN-PAGE gel was run as in (D) and incubated with NADH and nitro tetrazolium blue to visualize complex I and supercomplex I+III (indicated with the arrow in the inset) activity. The area of minimum 83 and maximum 205 mitochondria was measured at 10 DAS, depending on the line. At 21 DAS, a minimum of 190 and a maximum of 212 mitochondria were measured. Graphs represent mean ± se. (A) Letters “a” and “b” indicate significant differences between 21 and 10 DAS base and tip, respectively; “c” indicates significant differences compared with the wild type within developmental stage. In (B) and (F), one, two, or three asterisks indicate significant differences within a 5, 1, or 0.1% confidence interval between the wild type and mutants (one-way ANOVA; see ANOVA tables in Supplemental Data Set 1).

Similar articles

Cited by

References

    1. Abdelnoor R.V., Yule R., Elo A., Christensen A.C., Meyer-Gauen G., Mackenzie S.A. (2003). Substoichiometric shifting in the plant mitochondrial genome is influenced by a gene homologous to MutS. Proc. Natl. Acad. Sci. USA 100: 5968–5973. - PMC - PubMed
    1. Albinsky D., Masson J.E., Bogucki A., Afsar K., Vass I., Nagy F., Paszkowski J. (1999). Plant responses to genotoxic stress are linked to an ABA/salinity signaling pathway. Plant J. 17: 73–82.
    1. Andriankaja M., Dhondt S., De Bodt S., Vanhaeren H., Coppens F., De Milde L., Mühlenbock P., Skirycz A., Gonzalez N., Beemster G.T.S., Inzé D. (2012). Exit from proliferation during leaf development in Arabidopsis thaliana: a not-so-gradual process. Dev. Cell 22: 64–78. - PubMed
    1. Arrieta-Montiel M.P., Shedge V., Davila J., Christensen A.C., Mackenzie S.A. (2009). Diversity of the Arabidopsis mitochondrial genome occurs via nuclear-controlled recombination activity. Genetics 183: 1261–1268. - PMC - PubMed
    1. Backert S., Nielsen B.L., Börner T. (1997). The mystery of the rings: structure and replication of mitochondrial genomes from higher plants. Trends Plant Sci. 2: 477–483.

MeSH terms

LinkOut - more resources