. 2017 Apr 3:11:168.
doi: 10.3389/fnins.2017.00168. eCollection 2017.

Motion-Induced Position Shifts Activate Early Visual Cortex

Affiliations

Motion-Induced Position Shifts Activate Early Visual Cortex

Peter J Kohler et al. Front Neurosci. .

Abstract

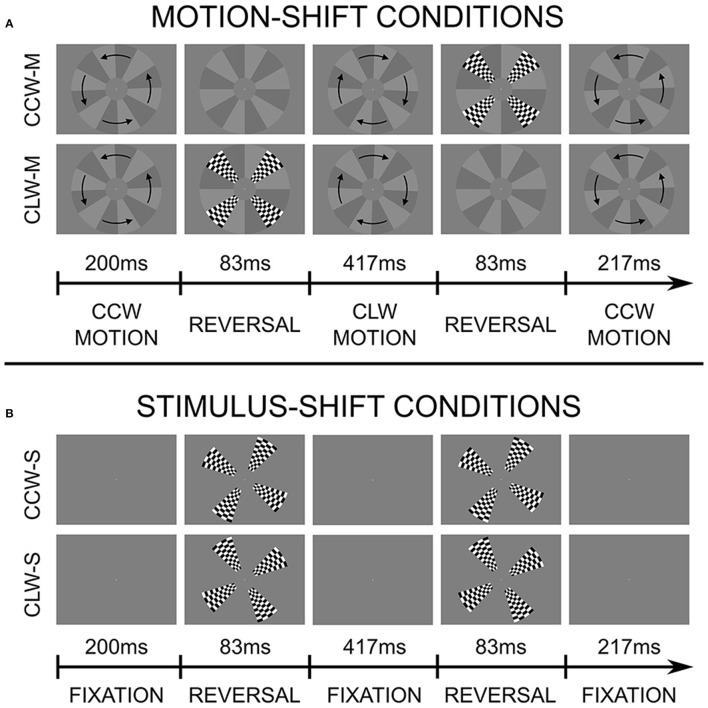
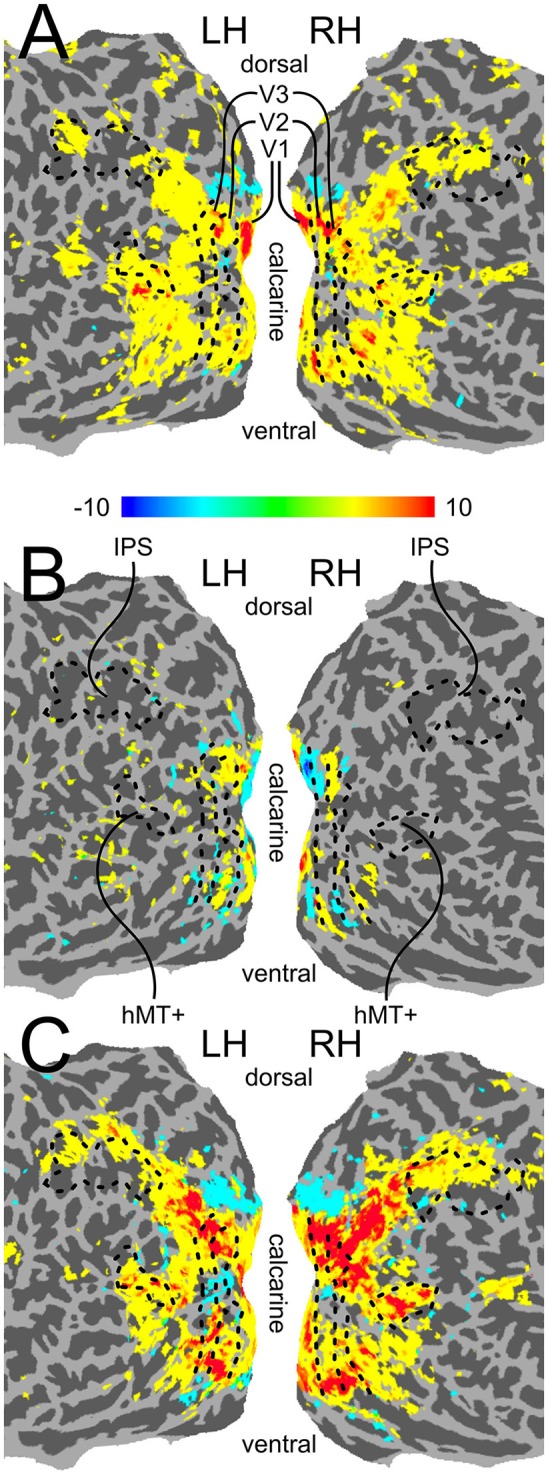
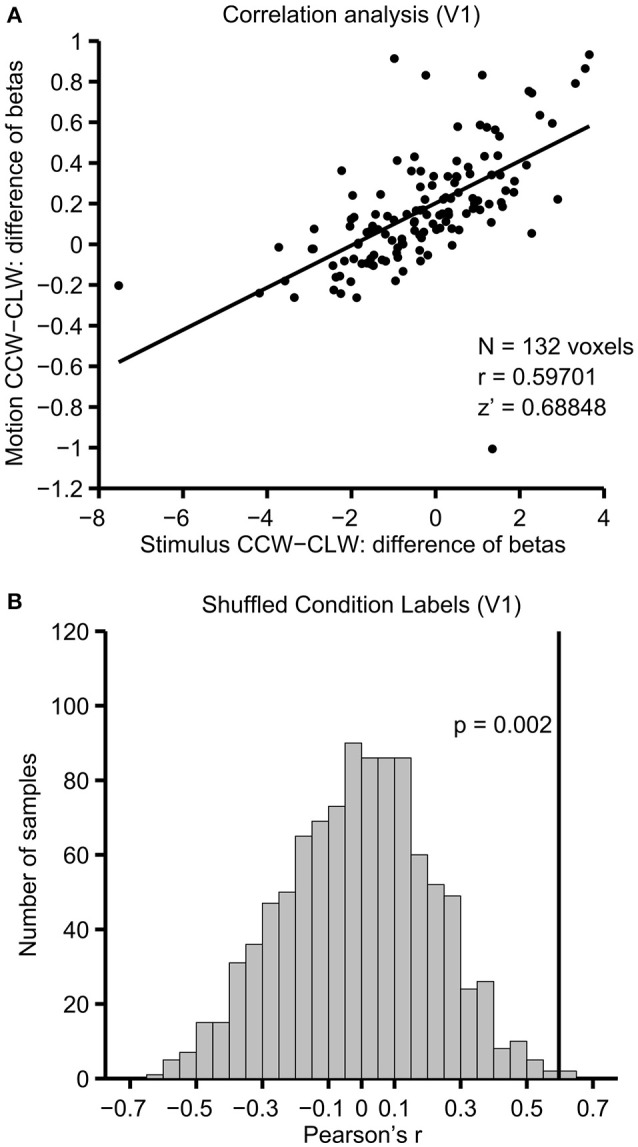
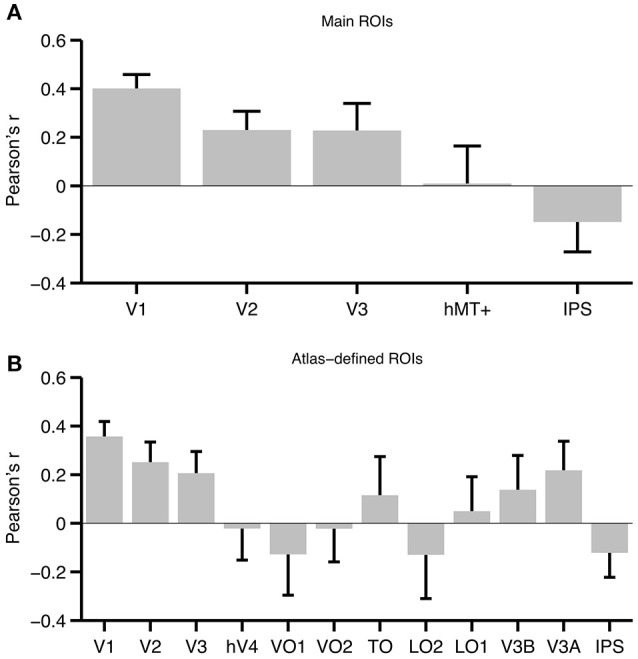
The ability to correctly determine the position of objects in space is a fundamental task of the visual system. The perceived position of briefly presented static objects can be influenced by nearby moving contours, as demonstrated by various illusions collectively known as motion-induced position shifts. Here we use a stimulus that produces a particularly strong effect of motion on perceived position. We test whether several regions-of-interest (ROIs), at different stages of visual processing, encode the perceived rather than retinotopically veridical position. Specifically, we collect functional MRI data while participants experience motion-induced position shifts and use a multivariate pattern analysis approach to compare the activation patterns evoked by illusory position shifts with those evoked by matched physical shifts. We find that the illusory perceived position is represented at the earliest stages of the visual processing stream, including primary visual cortex. Surprisingly, we found no evidence of percept-based encoding of position in visual areas beyond area V3. This result suggests that while it is likely that higher-level visual areas are involved in position encoding, early visual cortex also plays an important role.

Keywords: functional MRI; motion-induced position shifts; position perception; spatial vision; striate and extrastriate cortex.


Figures

Figure 1
Figure 1
Stimulus and experimental design. Stimuli presented during motion-shift conditions (A) and stimulus shift conditions (B). Each row is a separate condition, and illustrates a single 1-s cycle. Two cycles were completed for each 2-s TR. Flashes were presented once per second in motion-shift conditions, and twice per second during stimulus shift conditions. In this illustration, the offset of the checkerboard pattern in the stimulus-shift conditions corresponds to the average effect size reported by participants. The moving background always paused for 5 frames (~83 ms) at the reversal position, regardless of whether a flash was presented or not. Note that the starting direction of motion was randomly assigned for each run. The two motion-shift conditions can be seen by viewing Supplementary Videos 1, 2.
Figure 2
Figure 2
Psychophysical data. Average size of the motion-induced position shift across seven participants, based on data collected inside the scanner, prior to the fMRI experiment. Large, almost perfectly equivalent shifts were seen in both directions. Although the two conditions produced shifts in opposite directions, they are presented here as absolute values, to aid comparison.
Figure 3
Figure 3
Flattened surface activation maps. (A) The contrast (CLW-S+CCW-S) > Fixation, which served as the voxel selection criterion for our multivariate pattern analysis. (B) The contrast CLW-S > CCW-S, indicating differential activity evoked by the two physical shift directions. (C) The contrast Motion > Fixation. All three maps were created by mapping GLM contrasts from volume space, thresholded at Bonferroni corrected p < 0.01, onto flattened surfaces generated in FreeSurfer, using AFNIs 3dVol2Surf program. The boundaries between retinotopic regions V1–V3, as well as the location of functionally localized hMT+ and the anatomically localized IPS ROI, are indicated with a black outline.
Figure 4
Figure 4
Correlation and permutation testing. Illustrated for V1 in a single example participant. (A) The difference of beta coefficients between motion conditions (y-axis) and physical stimulus shift conditions (x-axis) for each of the 132 voxels that survived the voxel selection procedure in V1 of this participant. (B) Correlations resulting from repeating this analysis 1,000 times, while shuffling the labels between CLW-M and CCW-M. The unshuffled correlation, illustrated with a solid line, was higher than all but 2 of the shuffled correlations, indicating that the correlation is stronger than what would be expected given the null hypothesis that there is no information shared between the motion and stimulus shift contrasts.
Figure 5
Figure 5
Average correlation across participants for each ROI. (A) Average correlations for the main set of ROIs. (B) Average correlations for ROIs defined based on a probabilistic atlas (Wang et al., 2015). Note that the atlas-defined TO ROI is the union of TO-1 and TO-2, while IPS is the union of IPS0-5. Error bars represent the standard error of the mean. To aid interpretation, correlations are plotted as Pearson's r, but we emphasize that these values were converted to Fisher's z′ prior to statistical analysis.

References

    1. Argall B. D., Saad Z. S., Beauchamp M. S. (2006). Simplified intersubject averaging on the cortical surface using SUMA. Hum. Brain Mapp. 27, 14–27. 10.1002/hbm.20158 - DOI - PMC - PubMed
    1. Boyaci H., Fang F., Murray S. O., Kersten D. (2007). Responses to lightness variations in early human visual cortex. Curr. Biol. 17, 989–993. 10.1016/j.cub.2007.05.005 - DOI - PMC - PubMed
    1. Brainard D. H. (1997). The psychophysics toolbox. Spat. Vis. 10, 433–436. 10.1163/156856897X00357 - DOI - PubMed
    1. Caplovitz G. P., Tse P. U. (2010). Extrastriate cortical activity reflects segmentation of motion into independent sources. Neuropsychologia 48, 2699–2708. 10.1016/j.neuropsychologia.2010.05.017 - DOI - PubMed
    1. Cavanagh P., Anstis S. (2013). The flash grab effect. Vision Res. 91, 8–20. 10.1016/j.visres.2013.07.007 - DOI - PMC - PubMed

LinkOut - more resources