. 2017 Apr 3:11:28.
doi: 10.3389/fnana.2017.00028. eCollection 2017.

Organization and Plasticity of Sodium Channel Expression in the Mouse Olfactory and Vomeronasal Epithelia

Affiliations

Organization and Plasticity of Sodium Channel Expression in the Mouse Olfactory and Vomeronasal Epithelia

Florian Bolz et al. Front Neuroanat. .

Abstract

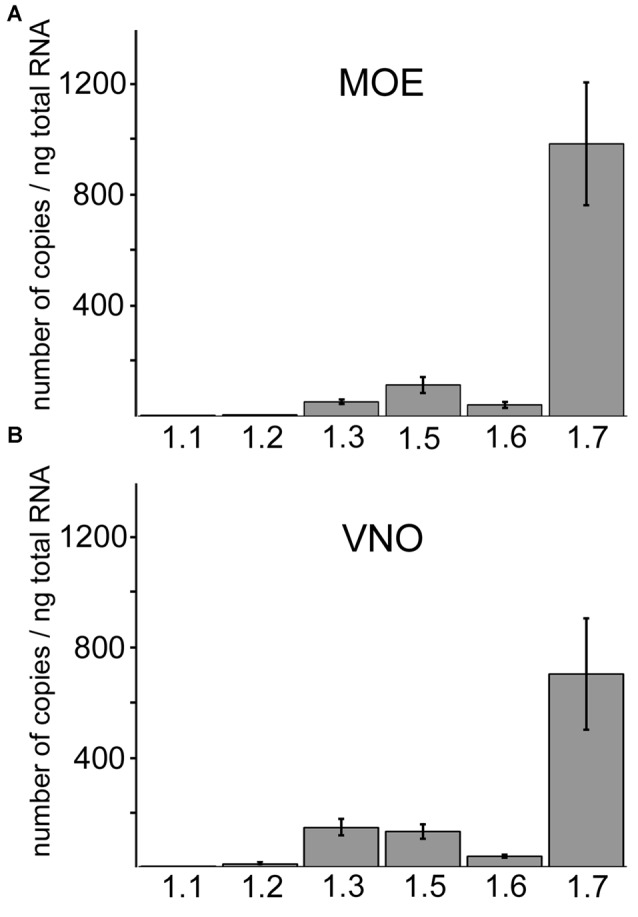
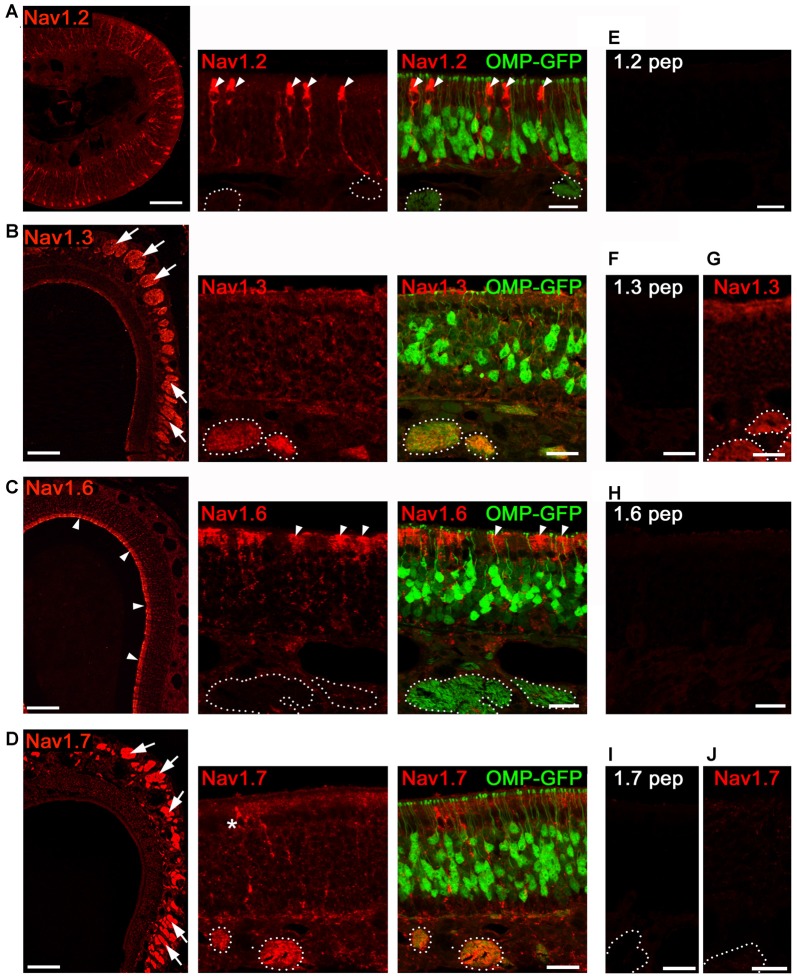
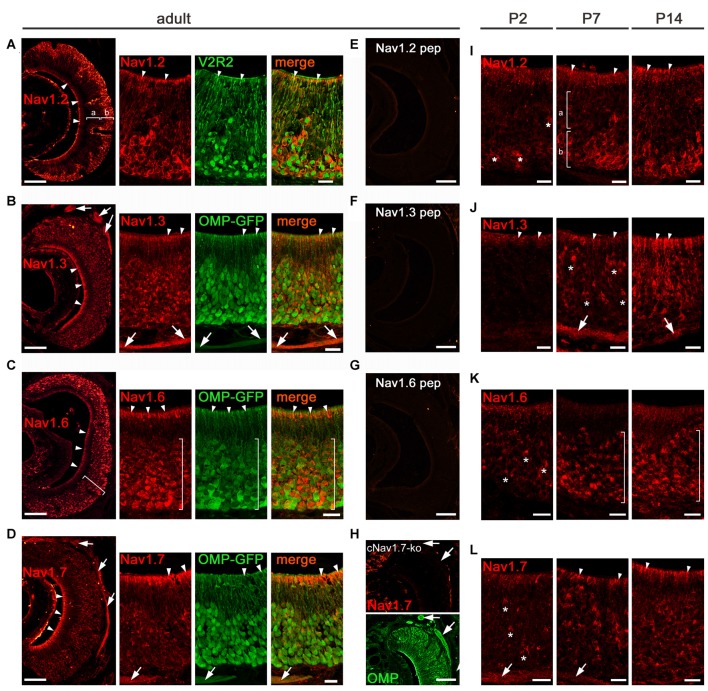
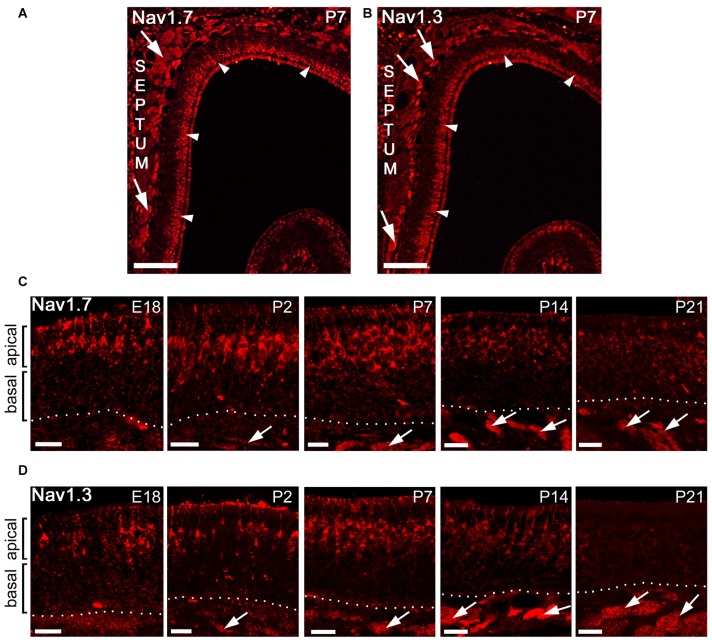
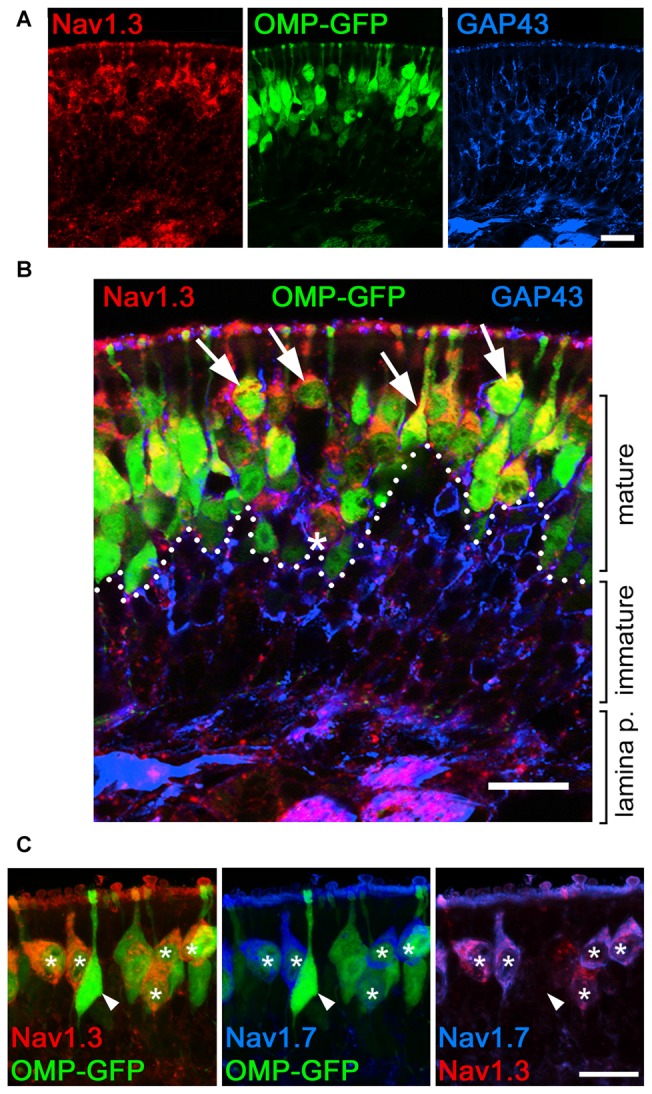
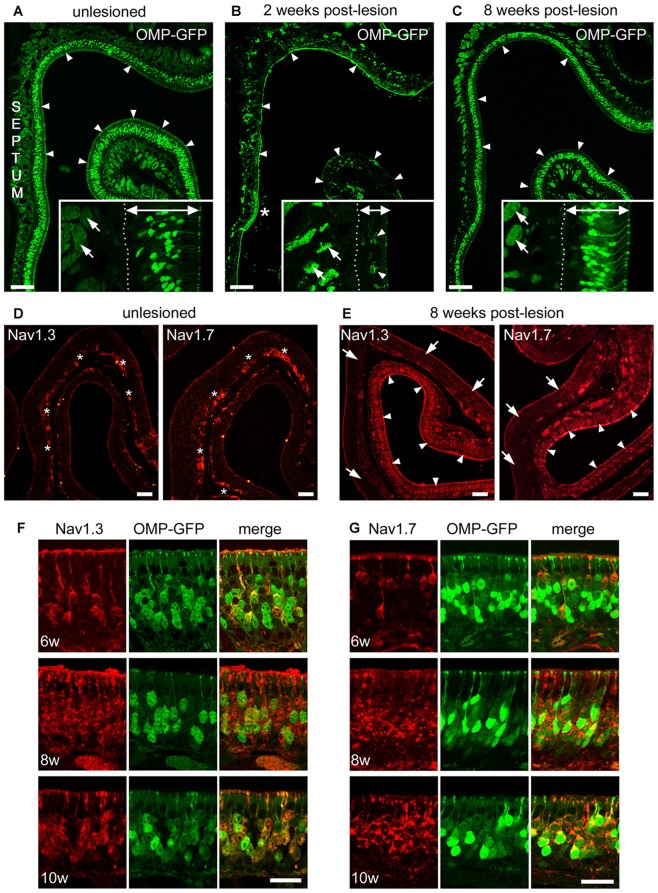
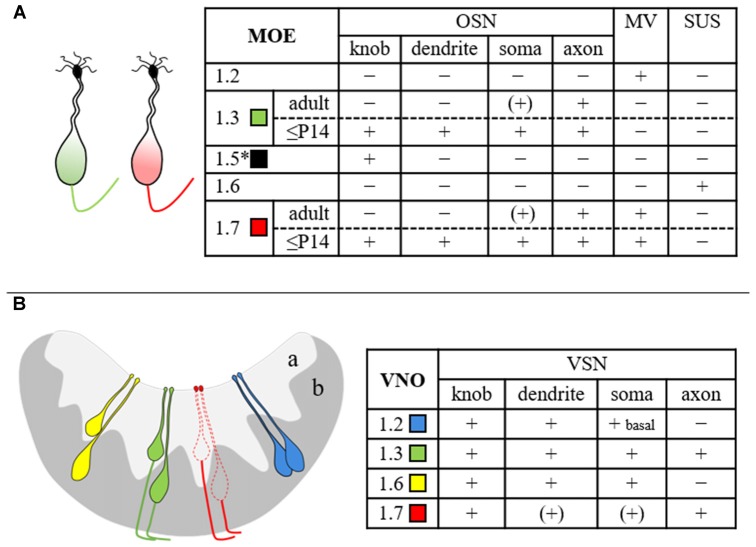
To understand the molecular basis of neuronal excitation in the mammalian olfactory system, we conducted a systematic analysis of the organization of voltage-gated sodium (Nav) channel subunits in the main olfactory epithelium (MOE) and vomeronasal organ (VNO) of adult mice. We also analyzed changes in Nav channel expression during development in these two systems and during regeneration of the MOE. Quantitative PCR shows that Nav1.7 is the predominant isoform in both adult MOE and VNO. We detected pronounced immunoreactivity for Nav1.7 and Nav1.3 in axons of olfactory and vomeronasal sensory neurons (VSNs). Analysis of Nav1.2 and Nav1.6 revealed an unexpected subsystem-specific distribution. In the MOE, these Nav channels are absent from olfactory sensory neurons (OSNs) but present in non-neuronal olfactory cell types. In the VNO, Nav1.2 and Nav1.6 are confined to VSNs, with Nav1.2-immunoreactive somata solely present in the basal layer of the VNO. The subcellular localization of Nav1.3 and Nav1.7 in OSNs can change dramatically during periods of heightened plasticity in the MOE. During the first weeks of development and during regeneration of the olfactory epithelium following chemical lesion, expression of Nav1.3 and Nav1.7 is transiently enhanced in the somata of mature OSNs. Our results demonstrate a highly complex organization of Nav channel expression in the mouse olfactory system, with specific commonalities but also differences between the MOE and the VNO. On the basis of their subcellular localization, Nav1.3 and Nav1.7 should play major roles in action potential propagation in both MOE and VNO, whereas Nav1.2 and Nav1.6 are specific to the function of VSNs. The plasticity of Nav channel expression in OSNs during early development and recovery from injury could reflect important physiological requirements in a variety of activity-dependent mechanisms.

Keywords: development; olfactory epithelium; regeneration; voltage-gated sodium channels; vomeronasal organ.


Figures

Figure 1
Figure 1
Quantitative RT-PCR of different Nav isoforms in main olfactory epithelium (MOE) and vomeronasal organ (VNO). Comparison of Nav channel mRNA frequency in the (A) MOE and (B) VNO using quantitative RT-PCR. Nav1.7 is the most abundant isoform in both subsystems and displays on average at least 5-fold higher copy numbers than other Nav isoforms. The column diagrams show mean copy numbers ± SD from two to four independent experiments, each carried out as triplicates using total RNA of adult C57/B6 mice (Y-axis). Nav channel isoforms (X-axis). (A) Copy numbers per ng total RNA in the MOE for Nav1.1 (2.6 ± 0.72), Nav1.2 (4.99 ± 0.62), Nav1.3 (51.80 ± 7.75), Nav1.5 (113.17 ± 27.35), Nav1.6 (41.19 ± 10.65), Nav1.7 (983.44 ± 221.34). (B) Copy numbers per ng total RNA in the VNO for Nav1.1 (0.80 ± 0.42), Nav1.2 (10.16 ± 2.10), Nav1.3 (142.70 ± 29.05), Nav1.5 (128.13 ± 25.56), Nav1.6 (38.17 ± 5.39), Nav1.7 (701.06 ± 203.50).
Figure 2
Figure 2
Analysis of Nav channel expression in MOE of adult mice. Confocal images showing immunoreactivity (red) for (A) Nav1.2, (B) Nav1.3, (C) Nav1.6, and (D) Nav1.7. We used coronal MOE cryosections (12 μm) of adult OMP-GFP mice (left, overviews; right, magnifications). Endogenous GFP (green) is located to mature, OMP+ OSNs as shown in the magnifications at the right. (A) Nav1.2 staining is restricted to microvillar cells (arrowheads) but absent from OSNs or axon bundles (dotted circles) identified by OMP-GFP labeling. (B) Robust Nav1.3 staining is present in axon bundles (arrows, left) that colocalize with OMP-GFP (dotted circles, right). (C) Nav1.6 labeling of the MOE surface (left, arrow heads) corresponds to sustentacular cells (right). OSNs and axon bundles (dotted line) lack Nav1.6 staining. (D) Nav1.7 immunoreactivity is profound in axon bundles, and occasionally found in microvillar cells (asterisk). (E,F,H,I) Blocking peptide control experiments lack immunoreactivity. (G) Nav1.3 immunoreactivity is present in cNav1.7−/− mice. (J) Nav1.7 immunoreactivity is absent in cNav1.7−/− mice. Images for each Nav channel immunostaining are representatives of n ≥ 3 mice and n = 20 sections per mouse. Scale bars overviews 100 μm, and magnifications 20 μm.
Figure 3
Figure 3
Analysis of Nav channel expression in VNO of adult and early postnatal mice. (A–H) Confocal images showing immunoreactivity (red) observed for (A) Nav1.2, (B) Nav1.3, (C) Nav1.6, and (D) Nav1.7 in 12 μm coronal VNO cryosections of adult mice (left, overviews; right, magnifications). (A) Nav1.2 staining is present in VSN knobs (arrowheads), dendrites and somata of basal (b) VSNs but absent in apical (a) VSNs (overview left). The magnification at the right shows colocalization of Nav1.2 with V2R2 (green). (B) Nav1.3 staining is moderate in VSN knobs (arrowheads), dendrites and somata and robust in axon bundles as identified in OMP-GFP mice (green signal). (C) Nav1.6 is strong in knobs (arrowheads) and somata (bracket). The magnification and colocalization with OMP-GFP shows a decline in Nav1.6 intensity from basal to apical. (D) Nav1.7 staining is prominent in VSN knobs (arrowheads) and axon bundles (arrows). Peptide control experiments (E,F,G) lack immunoreactivity. (H) Nav1.7 staining (top) is absent in axon bundles (arrows) of cNav1.7−/− mice, visualized by OMP staining (bottom). (I-L) Immunoreactivity (red) for (I) Nav1.2, (J) Nav1.3, (K) Nav1.6, and (L) Nav1.7 at postnatal (P) day 2, P7, and P14. (I) Onset of Nav1.2 in P2 VSNs (asterisks). At P7 and P14, basal (b) confinement of Nav1.2 somata and labeled knobs (arrowheads; a). (J) Nav1.3 is visible in single somata (asterisks) and axon bundles (arrows) at P7, and shows diffuse staining of the apical VNO (arrowheads) starting at P2. (K) Onset of Nav1.6 in somata (asterisks) at P2 with increasing numbers at P7 and P14 throughout the VNO (brackets). (L) Nav1.7 in single VSN somata (asterisks) and axon bundles (arrows) starts at P2. The knob area is substantially stained from P7 onwards. Images are representatives of n ≥ 3 adult mice (n = 20 sections per mouse) and n = 2 juvenile mice each at P2, P7, and P14 (n ≥ 10 sections per mouse). Scale bars overviews (A–H, left) and (E–H) 100 μm; magnifications (A–D) and (I–L) 20 μm.
Figure 4
Figure 4
Subcellular localization of Nav1.7 and Nav1.3 staining during mouse MOE development. (A,B) Coronal tissue sections showing the dorsal aspect of the left nasal cavity (septum to the left) of a postnatal day 7 (P7) mouse. A strip of strong immunoreactivity is visible for (A) Nav1.7 and (B) Nav1.3 in the most apical MOE layer (arrowheads) and in axon bundles (arrows). (C,D) Higher magnifications of the MOE derived at different mouse ages stained with antibodies for (C) Nav1.7 and (D) Nav1.3. The confocal images show strongly stained OSN somata solely in the apical MOE. Somatic OSN staining is visible at embryonic day 18 (E18), P2, and P7, declines at about P14 and is nearly diminished at P21. Axon bundles stain early on (arrows) and increase in size with age in relation to epithelial thickness. Images are representatives of (n ≥ 2) mice at each age with n ≥ 10 sections per mouse. Scale bars (A,B) 200 μm, (C,D) 20 μm.
Figure 5
Figure 5
Somatic expression of Nav1.3 and Nav1.7 occurs in mature OSNs. Colocalization of Nav1.3, GAP43, and Nav1.7 in the olfactory epithelium of a P7 OMP-GFP mouse (endogenous fluorescence, green). (A) Single fluorescence images for Nav1.3 (red), OMP-GFP (green), and GAP43 (blue). (B) Magnified merge of the images in (A) shows that Nav1.3 colocalizes with OMP-GFP (arrows) in mature OSN somata located in the apical layer (dotted line). Occasionally, triple-labeled OSNs, positive for Nav1.3, OMP-GFP, and GAP43 were detected (asterisk). (C) Colocalization of Nav1.3 (red) and Nav1.7 (blue) in OMP-GFP+ OSNs (asterisks) intermingle with singly, OMP-GFP labeled OSNs (arrowhead). Images are representatives of (n = 2) mice with n ≥ 10 sections per mouse. Scale bars, 20 μm.
Figure 6
Figure 6
Recovery of Nav1.3 and Nav1.7 expression in OSN somata during regeneration from chemical ablation. (A–C) Coronal MOE sections of the anterior left nasal cavity (septum to the left) of OMP-GFP mice. (A) Untreated control mice display OMP-GFP labeling of OSNs throughout the MOE (arrowheads). Inset magnification exemplifies regular thickness of axon bundles (arrows) and the MOE (double arrow, 80 μm). (B) Severely damaged MOE 2 weeks post-lesion. Small patch of unlesioned MOE at the septal wall (asterisk). The inset magnification depicts the reduced thickness of axon bundles (arrows) and the MOE (double arrow, 35 μm) 2 weeks post-lesion. Few newly generated OMP-GFP positive OSNs are visible (arrowheads). (C) The MOE has largely recovered 8 weeks post-lesion (arrowheads). The inset magnification shows that the thickness of axon bundles (arrows) and the MOE (double arrow, 70 μm) is increased. Basal membrane (dotted line). (D) Immunoreactivity for Nav1.3 and Nav1.7 in the intact, unlesioned MOE shows strong labeling of axon bundles (asterisks). (E) Eight weeks post-lesion, tissue stretches with heavy immunolabeling for Nav1.3 and Nav1.7 in OSN somata (arrowheads) reside side-by-side with areas devoid of any somatic immunoreactivity (arrows). This pattern likely coincides with the different levels of initial damage yielding various levels of MOE regeneration. (F,G) Magnifications of the MOE at 6, 8, and 10 weeks post-lesion showing somatic staining for (F) Nav1.3 (red) and (G) Nav1.7 (red) colocalizing with OMP-GFP (green). Images are representatives of (n = 2) mice at each recovery time point with n ≥ 20 sections per mouse. Scale bars (A–C) 200 μm, (D,E) 50 μm (F,G) 20 μm.
Figure 7
Figure 7
Summary scheme depicting the cellular and subcellular distribution of various Nav channel isoforms in mouse MOE (A) and VNO (B). The drawings at the left illustrate the results obtained in this study and refer to the table at the right. Expression of Nav1.5 (asterisk) in OSN dendritic knobs (Frenz et al., 2014) has been included for completeness. The different Nav channel subtypes are color-coded as indicated. The extent of immunoreactivity was categorized as + (present), − (absent), or (+) (close to detection threshold). MV, microvillar cells; OSN, olfactory sensory neuron; SUS, sustentacular cells; VSN, vomeronasal sensory neuron; a, apical VNO layer; b, basal VNO layer.

References

    1. Ackels T., von der Weid B., Rodriguez I., Spehr M. (2014). Physiological characterization of formyl peptide receptor expressing cells in the mouse vomeronasal organ. Front. Neuroanat. 8:134. 10.3389/fnana.2014.00134 - DOI - PMC - PubMed
    1. Ahn H.-S., Black J. A., Zhao P., Tyrrell L., Waxman S. G., Dib-Hajj S. D. (2011). Nav1.7 is the predominant sodium channel in rodent olfactory sensory neurons. Mol. Pain 7:32. 10.1186/1744-8069-7-32 - DOI - PMC - PubMed
    1. Blanchart A., Romaguera M., García-Verdugo J. M., de Carlos J. A., López-Mascaraque L. (2008). Synaptogenesis in the mouse olfactory bulb during glomerulus development. Eur. J. Neurosci. 27, 2838–2846. 10.1111/j.1460-9568.2008.06283.x - DOI - PubMed
    1. Brann J. H., Firestein S. J. (2014). A lifetime of neurogenesis in the olfactory system. Front. Neurosci. 8:182. 10.3389/fnins.2014.00182 - DOI - PMC - PubMed
    1. Bustin S. A., Benes V., Garson J. A., Hellemans J., Huggett J., Kubista M., et al. . (2009). The MIQE guidelines: minimum information for publication of quantitative real-time PCR experiments. Clin. Chem. 55, 611–622. 10.1373/clinchem.2008.112797 - DOI - PubMed

LinkOut - more resources