

Multi-modal, Multi-measure, and Multi-class Discrimination of ADHD with Hierarchical Feature Extraction and Extreme Learning Machine Using Structural and Functional Brain MRI
- PMID: 28420972
- PMCID: PMC5378777
- DOI: 10.3389/fnhum.2017.00157
Multi-modal, Multi-measure, and Multi-class Discrimination of ADHD with Hierarchical Feature Extraction and Extreme Learning Machine Using Structural and Functional Brain MRI
Erratum in
-
Corrigendum: Multi-modal, Multi-measure, and Multi-class Discrimination of ADHD with Hierarchical Feature Extraction and Extreme Learning Machine Using Structural and Functional Brain MRI.Front Hum Neurosci. 2017 May 31;11:292. doi: 10.3389/fnhum.2017.00292. eCollection 2017. Front Hum Neurosci. 2017. PMID: 28579953 Free PMC article.
Abstract
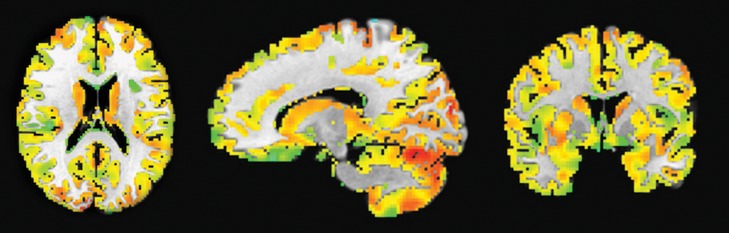
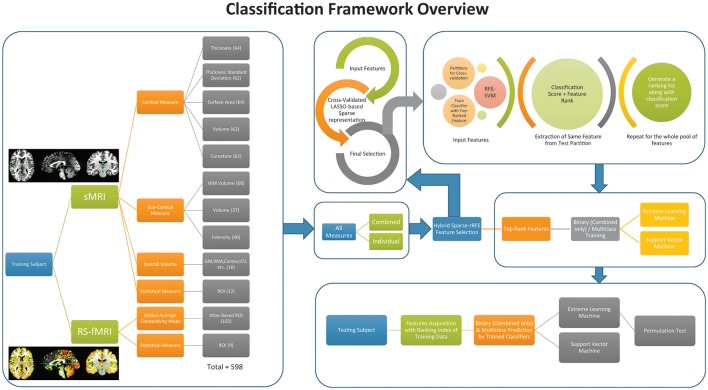
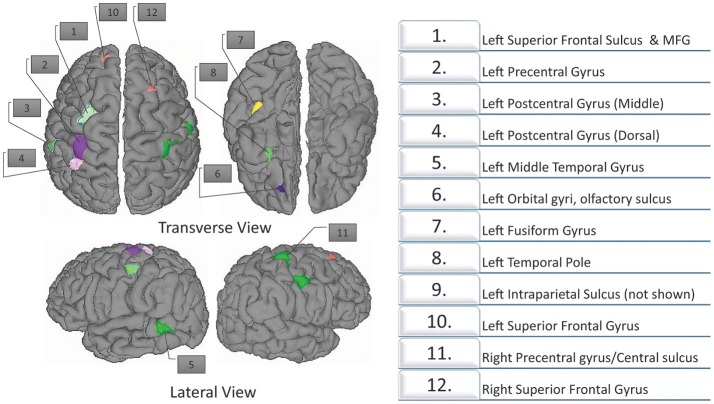
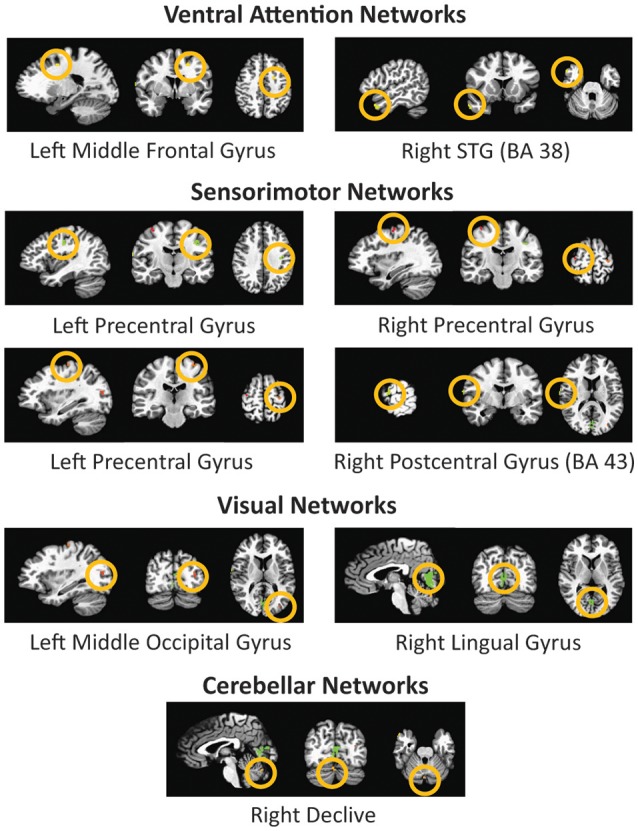
Structural and functional MRI unveil many hidden properties of the human brain. We performed this multi-class classification study on selected subjects from the publically available attention deficit hyperactivity disorder ADHD-200 dataset of patients and healthy children. The dataset has three groups, namely, ADHD inattentive, ADHD combined, and typically developing. We calculated the global averaged functional connectivity maps across the whole cortex to extract anatomical atlas parcellation based features from the resting-state fMRI (rs-fMRI) data and cortical parcellation based features from the structural MRI (sMRI) data. In addition, the preprocessed image volumes from both of these modalities followed an ANOVA analysis separately using all the voxels. This study utilized the average measure from the most significant regions acquired from ANOVA as features for classification in addition to the multi-modal and multi-measure features of structural and functional MRI data. We extracted most discriminative features by hierarchical sparse feature elimination and selection algorithm. These features include cortical thickness, image intensity, volume, cortical thickness standard deviation, surface area, and ANOVA based features respectively. An extreme learning machine performed both the binary and multi-class classifications in comparison with support vector machines. This article reports prediction accuracy of both unimodal and multi-modal features from test data. We achieved 76.190% (p < 0.0001) classification accuracy in multi-class settings as well as 92.857% (p < 0.0001) classification accuracy in binary settings. In addition, we found ANOVA-based significant regions of the brain that also play a vital role in the classification of ADHD. Thus, from a clinical perspective, this multi-modal group analysis approach with multi-measure features may improve the accuracy of the ADHD differential diagnosis.
Keywords: ADHD-200; ANOVA; extreme learning machine; global functional connectivity; hierarchical feature extraction; machine learning; neuroimaging; revised recursive feature elimination.
Figures
References
-
- Association AP (2013). Diagnostic and Statistical Manual of Mental Disorders. Washington, DC: APA.
LinkOut - more resources
Full Text Sources
Other Literature Sources