. 2017 Apr 3:8:447.
doi: 10.3389/fpls.2017.00447. eCollection 2017.

Using a Structural Root System Model to Evaluate and Improve the Accuracy of Root Image Analysis Pipelines

Affiliations

Using a Structural Root System Model to Evaluate and Improve the Accuracy of Root Image Analysis Pipelines

Guillaume Lobet et al. Front Plant Sci. .

Abstract

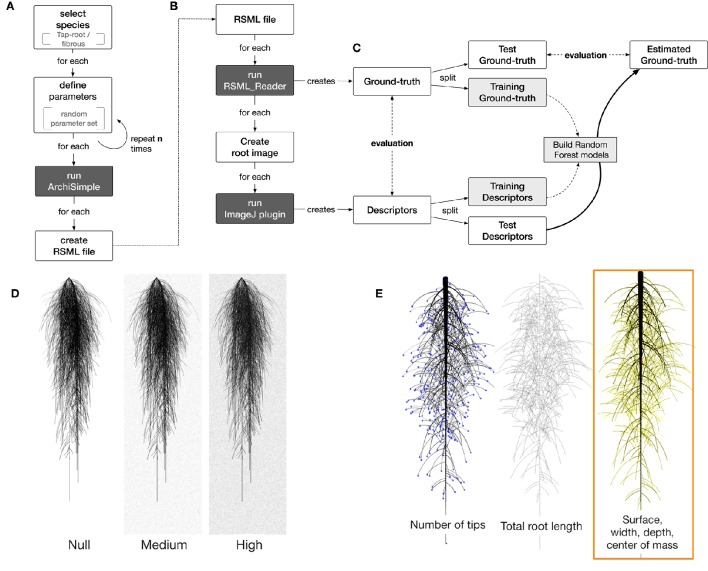
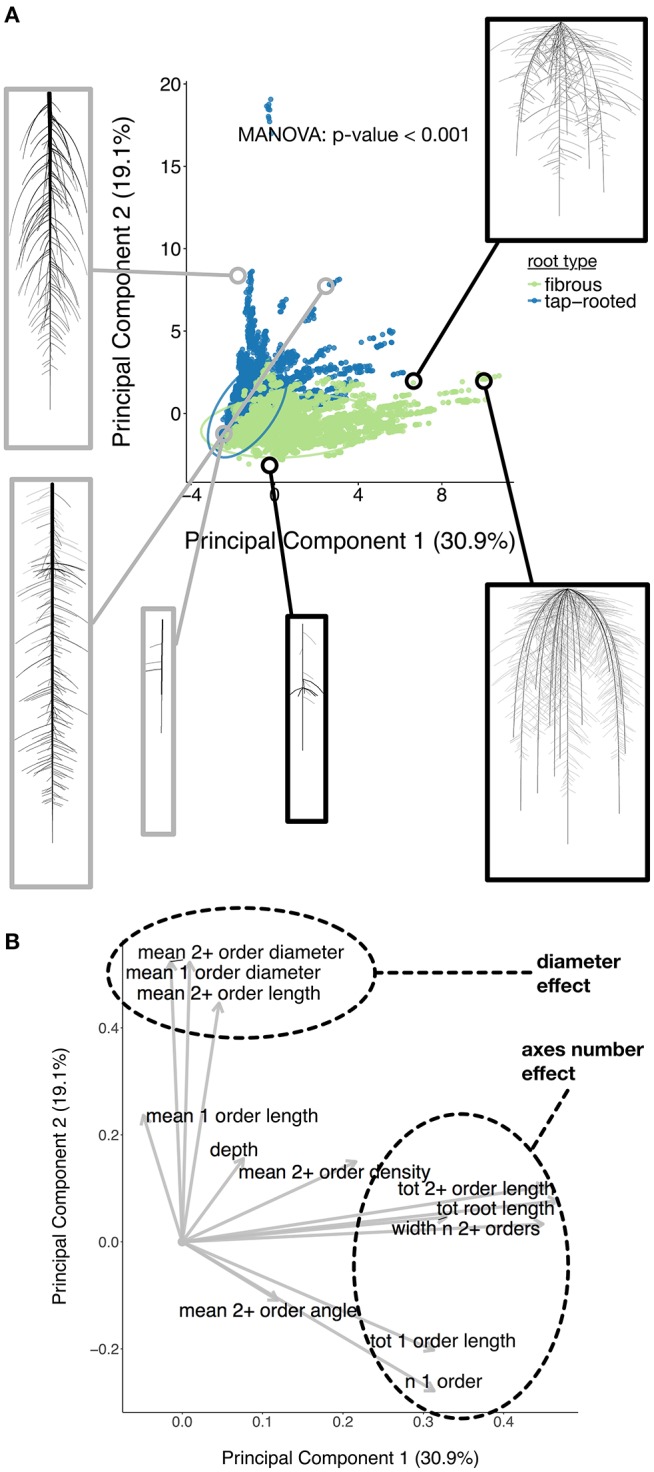
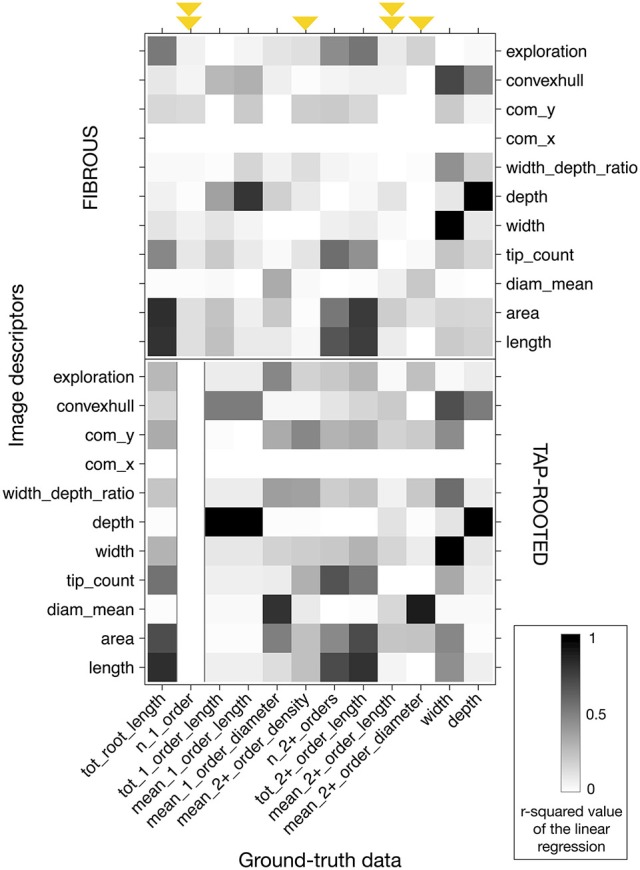
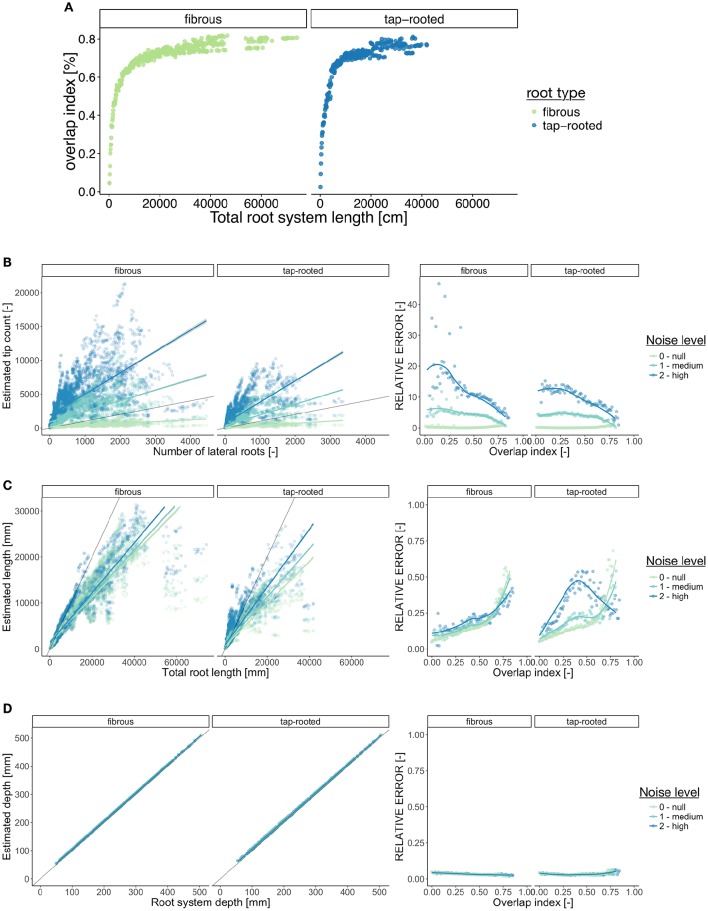
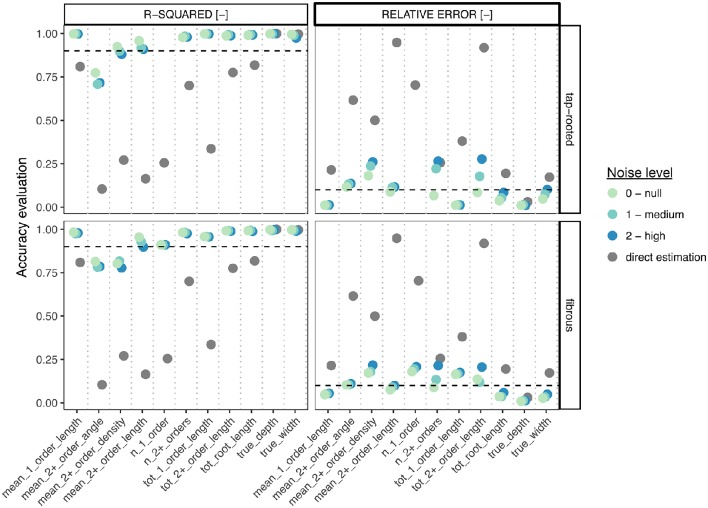
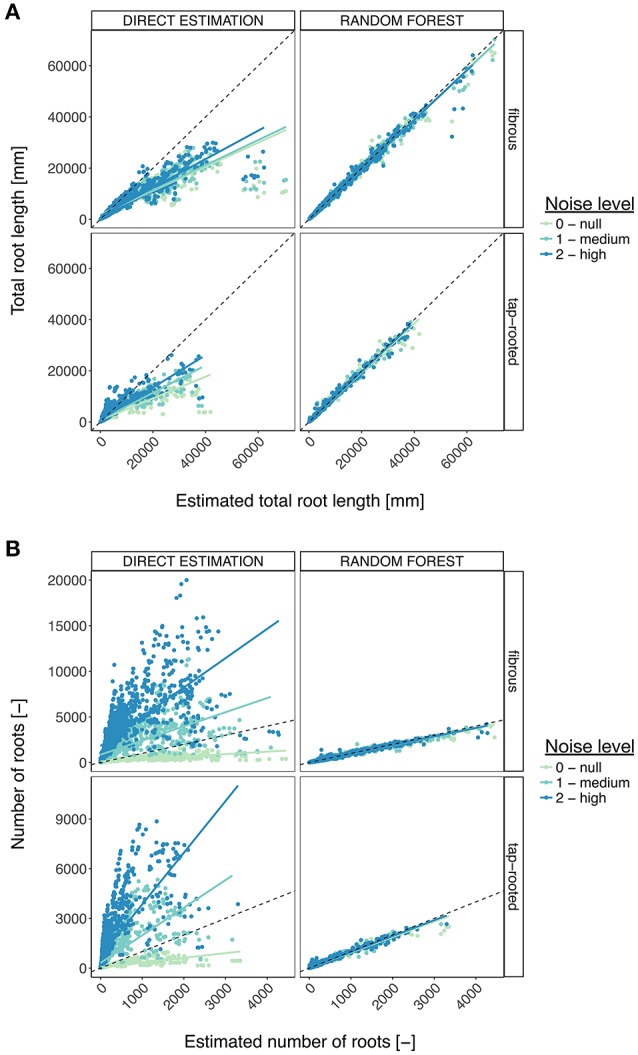
Root system analysis is a complex task, often performed with fully automated image analysis pipelines. However, the outcome is rarely verified by ground-truth data, which might lead to underestimated biases. We have used a root model, ArchiSimple, to create a large and diverse library of ground-truth root system images (10,000). For each image, three levels of noise were created. This library was used to evaluate the accuracy and usefulness of several image descriptors classically used in root image analysis softwares. Our analysis highlighted that the accuracy of the different traits is strongly dependent on the quality of the images and the type, size, and complexity of the root systems analyzed. Our study also demonstrated that machine learning algorithms can be trained on a synthetic library to improve the estimation of several root system traits. Overall, our analysis is a call to caution when using automatic root image analysis tools. If a thorough calibration is not performed on the dataset of interest, unexpected errors might arise, especially for large and complex root images. To facilitate such calibration, both the image library and the different codes used in the study have been made available to the community.

Keywords: benchmarking; image analysis; image library; machine learning; root structural model.


Figures

Figure 1
Figure 1
(A) Image of a 2-week old maize root system grown in rhizotron. (B) Close-up showing overlapping roots. (C) Close-up showing crossing roots.
Figure 2
Figure 2
Overview of the workflow used in this study. (A) Generation of root systems using Archisimple. (B) Creation and analysis of root images. (C) Use of Random Forest algorithms to better estimate root system ground-truths. (D) Illustration of the different noise levels used in the analysis. (E) Example of descriptors extracted with RIA-J.
Figure 3
Figure 3
(A) Principal Component Analysis of the root ground-truth dataset. Images of the selected root systems have been added for illustration. (B) Loadings of the Principal Component Analysis.
Figure 4
Figure 4
Heatmap of the r-squared values between the different image descriptors and the ground-truth values, for the images without any noise. Black represents an r-squared value of 1; white represents a value of 0. Upper panel: fibrous root dataset. Lower panel: tap-root dataset. Arrows highlight the ground-truth data that cannot be accurately described with the different descriptors. The arrows were doubled when it was the case for both fibrous and tap-rooted root systems.
Figure 5
Figure 5
Error estimation for three ground-truth parameters. (A) Evolution of the overlap index (proportion of root overlapping) with the root system size. (B–D) Left panel shows the relationship between the descriptors and the corresponding ground-truth variables. Right panels show the evolution of the Mean Relative Error (MRE) as a function of the overlap index. For the MRE calculations, the continuous variables were discretized in groups. (B) Number of lateral roots. (C) Total root length. (D) Root system depth. In the left panels, the gray line indicates the diagonal (1:1 relation).
Figure 6
Figure 6
Comparison between the direct trait and the Random Forest approach, for the different root system types and the different levels of noise. For each metric, we computed both the r-squared value from the linear regression between the estimation and the ground-truth (left panels), as well as the Mean Relative Error (right panel). The gray points represent the values obtained with the direct estimation (best descriptor, no noise). Color points represent the values obtained with the Random Forest approach, for different levels of noise. The dotted lines show the 0.9 (r-squared) and 0.1(MRE) thresholds.
Figure 7
Figure 7
Comparison between the direct trait estimation and the Random Forest approach, for the different root system types and the different levels of noise. (A) Comparison, for the total root length, of the accuracy of both approaches. The dotted line represents the diagonal. The plain line represents the linear regression. (B) Same, for the number of roots.

References

    1. Armengaud P., Zambaux P., Hills A., Sulpice R., Pattison R. J., Blatt M. R., et al. . (2009). EZ-Rhizo: integrated software for the fast and accurate measurement of root system architecture. Plant J. 57, 945–956. 10.1111/j.1365-313X.2008.03739.x - DOI - PubMed
    1. Benoit L., Rousseau D., Belin É., Demilly D., Chapeau-Blondeau F. (2014). Simulation of image acquisition in machine vision dedicated to seedling elongation to validate image processing root segmentation algorithms. Comput. Electron. Agric. 104, 84–92. 10.1016/j.compag.2014.04.001 - DOI
    1. Breiman L. (1996). Bagging predictors. Mach. Learn. 24, 123–140. 10.1007/BF00058655 - DOI
    1. Breiman L. (2001). Random Forests. Mach. Learn. 45, 5–32. 10.1023/A:1010933404324 - DOI
    1. Bucksch A., Burridge J., York L. M., Das A., Nord E., Weitz J. S., et al. . (2014). Image-based high-throughput field phenotyping of crop roots. Plant Physiol. 166, 470–486. 10.1104/pp.114.243519 - DOI - PMC - PubMed