

Chronic Hyperinsulinaemic Hypoglycaemia in Rats Is Accompanied by Increased Body Weight, Hyperleptinaemia, and Decreased Neuronal Glucose Transporter Levels in the Brain
- PMID: 28421113
- PMCID: PMC5379133
- DOI: 10.1155/2017/7861236
Chronic Hyperinsulinaemic Hypoglycaemia in Rats Is Accompanied by Increased Body Weight, Hyperleptinaemia, and Decreased Neuronal Glucose Transporter Levels in the Brain
Abstract
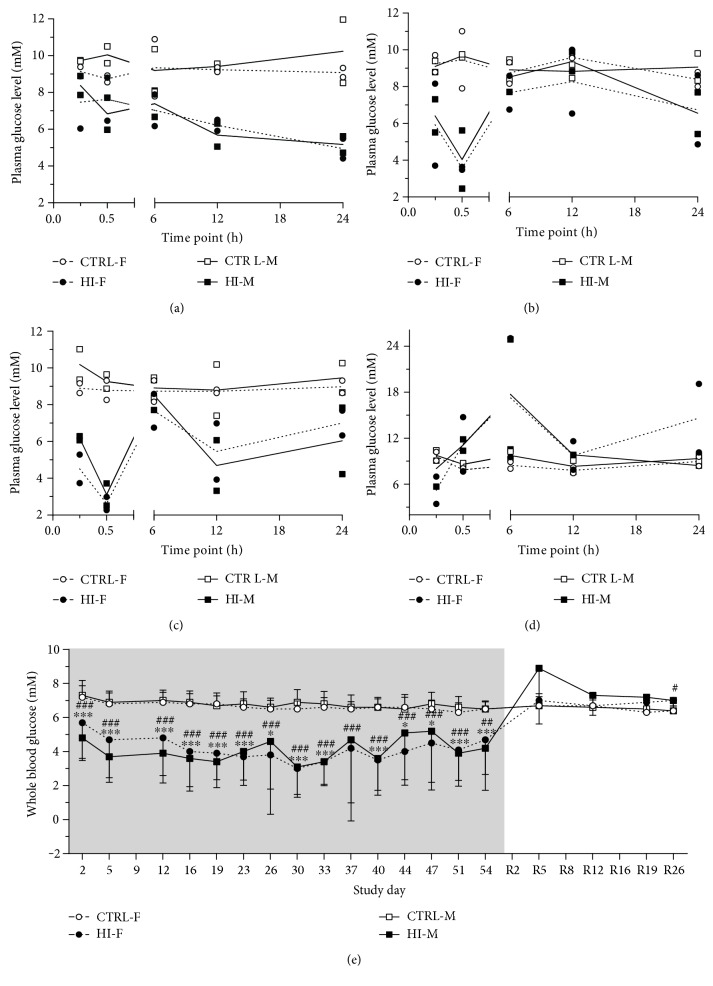
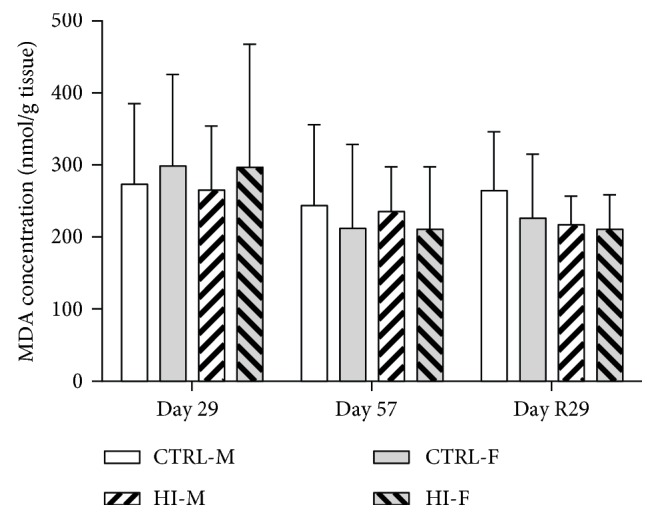
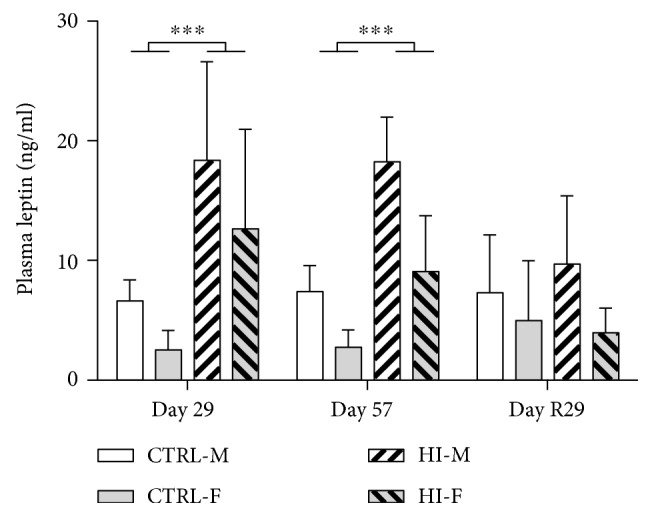
The brain is vulnerable to hypoglycaemia due to a continuous need of energy substrates to meet its high metabolic demands. Studies have shown that severe acute insulin-induced hypoglycaemia results in oxidative stress in the rat brain, when neuroglycopenia cannot be evaded despite increased levels of cerebral glucose transporters. Compensatory measures in the brain during chronic insulin-induced hypoglycaemia are less well understood. The present study investigated how the brain of nondiabetic rats copes with chronic insulin-induced hypoglycaemia for up to eight weeks. Brain level of different substrate transporters and redox homeostasis was evaluated. Hyperinsulinaemia for 8 weeks consistently lowered blood glucose levels by 30-50% (4-6 mM versus 7-9 mM in controls). The animals had increased food consumption, body weights, and hyperleptinaemia. During infusion, protein levels of the brain neuronal glucose transporter were decreased, whereas levels of lipid peroxidation products were unchanged. Discontinued infusion was followed by transient systemic hyperglycaemia and decreased food consumption and body weight. After 4 weeks, plasma levels of lipid peroxidation products were increased, possibly as a consequence of hyperglycaemia-induced oxidative stress. The present data suggests that chronic moderate hyperinsulinaemic hypoglycaemia causes increased body weight and hyperleptinaemia. This is accompanied by decreased neuronal glucose transporter levels, which may be leptin-induced.
Figures


Similar articles
-
Effect of insulin-induced hypoglycaemia on the central nervous system: evidence from experimental studies.J Neuroendocrinol. 2014 Mar;26(3):123-50. doi: 10.1111/jne.12133. J Neuroendocrinol. 2014. PMID: 24428753 Review.
-
Dysregulation of Glucose Homeostasis Following Chronic Exogenous Administration of Leptin in Healthy Sprague-Dawley Rats.J Clin Diagn Res. 2015 Dec;9(12):OF06-9. doi: 10.7860/JCDR/2015/15594.7003. Epub 2015 Dec 1. J Clin Diagn Res. 2015. PMID: 26816939 Free PMC article.
-
Maternal glucocorticoid treatment modulates placental leptin and leptin receptor expression and materno-fetal leptin physiology during late pregnancy, and elicits hypertension associated with hyperleptinaemia in the early-growth-retarded adult offspring.Eur J Endocrinol. 2001 Oct;145(4):529-39. doi: 10.1530/eje.0.1450529. Eur J Endocrinol. 2001. PMID: 11581014
-
Hormonal counterregulation failure in rats is related to previous hyperglycaemia-hyperinsulinaemia.Diabetes Metab. 1998 Feb;24(1):46-54. Diabetes Metab. 1998. PMID: 9534009
-
Impact of activated glucose counterregulation on insulin requirements in insulin-dependent diabetes mellitus.Horm Metab Res Suppl. 1990;24:87-96. Horm Metab Res Suppl. 1990. PMID: 2272633 Review.
Cited by
-
New Insight on Insulinoma Treatment in a Pet Rat-A Case Report.Animals (Basel). 2022 Oct 15;12(20):2783. doi: 10.3390/ani12202783. Animals (Basel). 2022. PMID: 36290169 Free PMC article.
-
Prolonged insulin-induced hypoglycaemia reduces ß-cell activity rather than number in pancreatic islets in non-diabetic rats.Sci Rep. 2022 Aug 18;12(1):14113. doi: 10.1038/s41598-022-18398-z. Sci Rep. 2022. PMID: 35982111 Free PMC article.
-
Implantable device actuated by manual button clicks for noninvasive self-drug administration.Bioeng Transl Med. 2022 Apr 5;8(1):e10320. doi: 10.1002/btm2.10320. eCollection 2023 Jan. Bioeng Transl Med. 2022. PMID: 36684080 Free PMC article.
References
LinkOut - more resources
Full Text Sources
Other Literature Sources
