

Prevalence of Sarcopenic Obesity in Adults with Class II/III Obesity Using Different Diagnostic Criteria
- PMID: 28421144
- PMCID: PMC5380855
- DOI: 10.1155/2017/7307618
Prevalence of Sarcopenic Obesity in Adults with Class II/III Obesity Using Different Diagnostic Criteria
Abstract
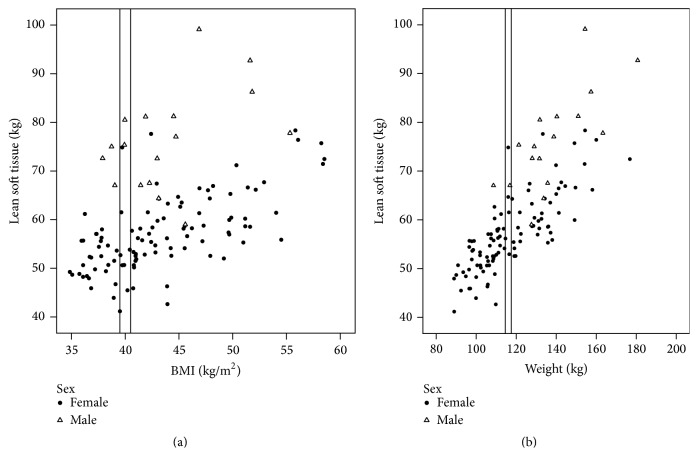
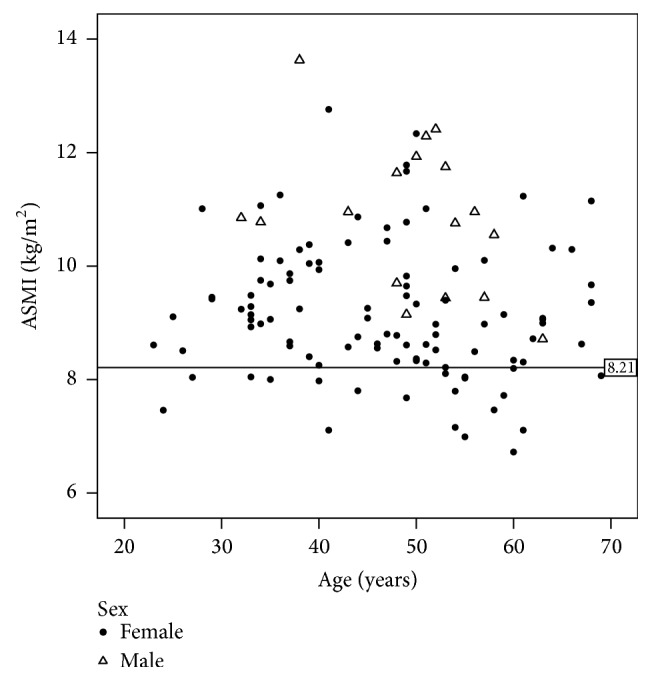
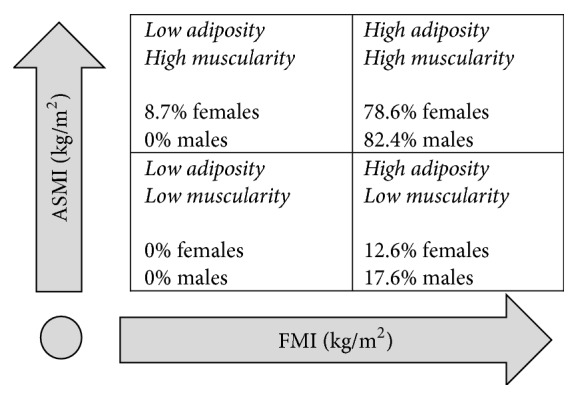
Background/Objective. Sarcopenic obesity (SO) is a hidden condition of reduced lean soft tissue (LST) in context of excess adiposity. SO is most commonly reported in older adults and both its risk and prevalence increase with age. A variety of body composition indices and cut points have been used to define this condition, leading to conflicting prevalence and risk prediction. Here, we investigate variability in the prevalence of SO in an adult sample of individuals with class II/III obesity (BMI ≥ 35 kg/m2) using different diagnostic criteria. Methods. SO definitions were identified from a literature review of studies using dual-energy X-ray absorptiometry (DXA) to assess LST. Demographics, anthropometrics, and body composition (by DXA) were measured in n = 120, 86% female (46.9 ± 11.1 years). Results. LST was extremely variable in individuals, even with similar body sizes, and observed across the age spectrum. The prevalence of SO ranged from 0 to 84.5% in females and 0 to 100% in males, depending upon the definition applied, with higher prevalence among definitions accounting for measures of body size or fat mass. Conclusion. SO is present, yet variable, in adults with class II/III obesity. Accounting for body mass or fat mass may identify a higher number of individuals with SO, although risk prediction remains to be studied.
Figures
Similar articles
-
A diagnostic proposal for sarcopenic obesity in adults based on body composition phenotypes.Clin Nutr ESPEN. 2022 Dec;52:119-130. doi: 10.1016/j.clnesp.2022.10.010. Epub 2022 Oct 21. Clin Nutr ESPEN. 2022. PMID: 36513443
-
Sarcopenic obesity assessed using dual energy X-ray absorptiometry (DXA) can predict cardiovascular disease in patients with type 2 diabetes: a retrospective observational study.Cardiovasc Diabetol. 2018 Apr 10;17(1):55. doi: 10.1186/s12933-018-0700-5. Cardiovasc Diabetol. 2018. PMID: 29636045 Free PMC article.
-
Poor Physical Function as a Marker of Sarcopenia in Adults with Class II/III Obesity.Curr Dev Nutr. 2017 Dec 18;2(3):nzx008. doi: 10.3945/cdn.117.001743. eCollection 2018 Mar. Curr Dev Nutr. 2017. PMID: 30377678 Free PMC article.
-
Critical appraisal of definitions and diagnostic criteria for sarcopenic obesity based on a systematic review.Clin Nutr. 2020 Aug;39(8):2368-2388. doi: 10.1016/j.clnu.2019.11.024. Epub 2019 Nov 27. Clin Nutr. 2020. PMID: 31813698
-
Body composition assessment in individuals with class II/III obesity: a narrative review.BMC Nutr. 2024 Oct 22;10(1):142. doi: 10.1186/s40795-024-00913-2. BMC Nutr. 2024. PMID: 39438968 Free PMC article. Review.
Cited by
-
Mitochondrial Dysfunction and Sarcopenic Obesity: The Role of Exercise.J Clin Med. 2023 Aug 29;12(17):5628. doi: 10.3390/jcm12175628. J Clin Med. 2023. PMID: 37685695 Free PMC article. Review.
-
Association between sarcopenic obesity and knee osteoarthritis: A narrative review.Osteoarthr Cartil Open. 2024 May 14;6(3):100489. doi: 10.1016/j.ocarto.2024.100489. eCollection 2024 Sep. Osteoarthr Cartil Open. 2024. PMID: 38832052 Free PMC article.
-
The Hidden Battle Within: Shedding Light on the Co-existence of Sarcopenia and Sarcopenic Obesity among Participants with Type 2 Diabetes in a Tertiary Care Hospital, Gujarat.Indian J Endocrinol Metab. 2024 Jan-Feb;28(1):80-85. doi: 10.4103/ijem.ijem_321_23. Epub 2024 Feb 26. Indian J Endocrinol Metab. 2024. PMID: 38533285 Free PMC article.
-
Osteosarcopenic Obesity: Current Knowledge, Revised Identification Criteria and Treatment Principles.Nutrients. 2019 Mar 30;11(4):747. doi: 10.3390/nu11040747. Nutrients. 2019. PMID: 30935031 Free PMC article. Review.
-
Prevalence of Sarcopenic Obesity Using Different Definitions and the Relationship With Strength and Physical Performance in the Canadian Longitudinal Study of Aging.Front Physiol. 2021 Jan 21;11:583825. doi: 10.3389/fphys.2020.583825. eCollection 2020. Front Physiol. 2021. PMID: 33551830 Free PMC article.
References
-
- De Luca M., Angrisani L., Himpens J., et al. Indications for surgery for obesity and weight-related diseases: position statements from the International Federation for the Surgery of Obesity and Metabolic Disorders (IFSO) Obesity Surgery. 2016;26(8):1659–1696. doi: 10.1007/s11695-016-2271-4. - DOI - PMC - PubMed
-
- World Health Organization Consultation on Obesity. Obesity: Preventing and Managing the Global Epidemic: A Report of the WHO Consultation on Obesity. Geneva, Switzerland: World Health Organization; 1998. - PubMed
-
- Statistics Canada. Table 105-0501- Health indicator profile, annual estimates, by age group and sex, Canada, provinces, territories, health regions (2013 boundaries) and peer groups, occasional, CANSIM (database) 2013 http://www5.statcan.gc.ca/cansim/a26?lang=eng&id=1050501.
-
- Navaneelan T., Janz T. Adjusting the scales: obesity in the Canadian population after correcting for respondent bias. 2014.
LinkOut - more resources
Full Text Sources
Other Literature Sources
Molecular Biology Databases
