

A numerical investigation on the effect of RF coil feed variability on global and local electromagnetic field exposure in human body models at 64 MHz
- PMID: 28421683
- PMCID: PMC5810925
- DOI: 10.1002/mrm.26703
A numerical investigation on the effect of RF coil feed variability on global and local electromagnetic field exposure in human body models at 64 MHz
Abstract
Purpose: This study aims to investigate how the positions of the feeding sources of the transmit radiofrequency (RF) coil, field orientation direction with respect to the patient, and patient dimensions affect the global and local electromagnetic exposure in human body models.
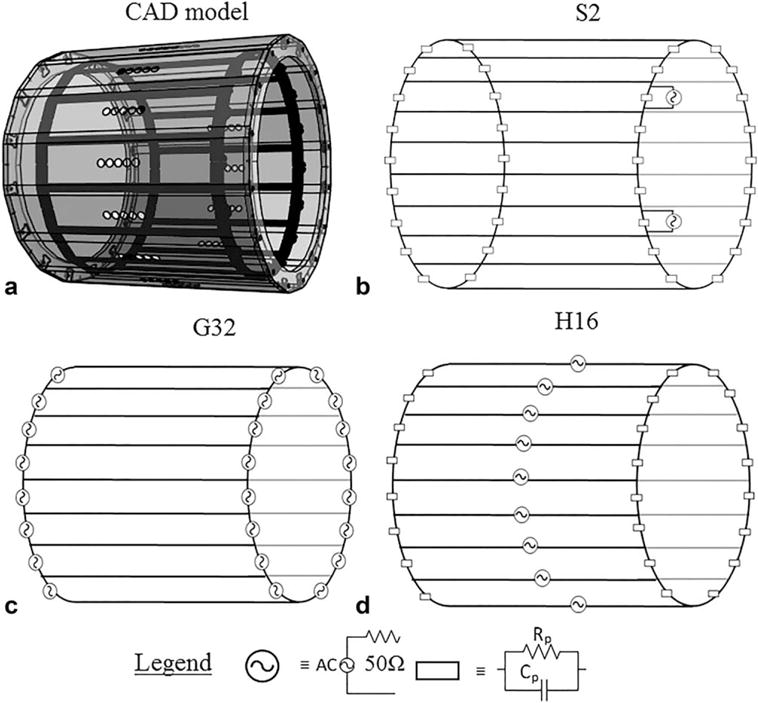
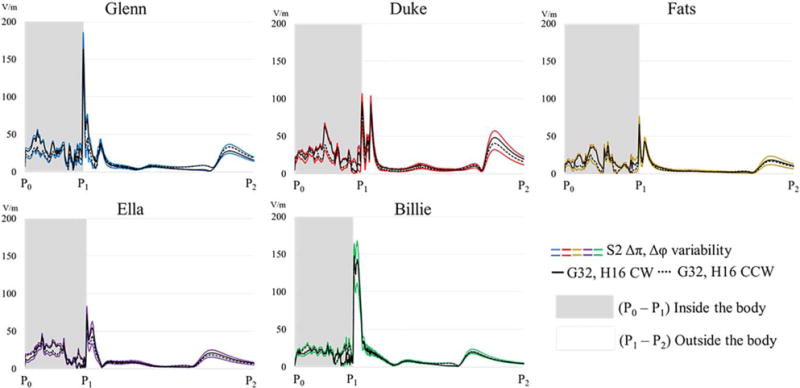
Methods: Three RF coil models were implemented, namely a specific two-source (S2) feed and two multisource feed configurations: generic 32-source (G32) and hybrid 16-source (H16). Thirty-two feeding conditions were studied for the S2, whereas two were studied for the G32 and H16. The study was performed using five human body models. Additionally, for two of the body models, the case of a partially implanted lead was evaluated.
Results: The results showed an overall variation due to coil feeding conditions of the whole-body specific absorption rate (SAR) of less than 20%, but deviations up to 98% of the magnitude of the electric field tangential to a possible lead path. For the analysis with the partially implanted lead, a variation of local SAR at the tip of the lead of up to 60% was observed with respect to feed position and field orientation direction.
Conclusion: The results of this study suggest that specific information about feed position and field orientation direction must be considered for an accurate evaluation of patient exposure. Magn Reson Med 79:1135-1144, 2018. © 2017 International Society for Magnetic Resonance in Medicine.
Keywords: SAR; finite difference time domain (FDTD); interventional MRI; partially implanted leads; virtual population.
© 2017 International Society for Magnetic Resonance in Medicine.
Figures


Similar articles
-
Effect of field strength on RF power deposition near conductive leads: A simulation study of SAR in DBS lead models during MRI at 1.5 T-10.5 T.PLoS One. 2023 Jan 26;18(1):e0280655. doi: 10.1371/journal.pone.0280655. eCollection 2023. PLoS One. 2023. PMID: 36701285 Free PMC article.
-
Assessing the Electromagnetic Fields Generated By a Radiofrequency MRI Body Coil at 64 MHz: Defeaturing Versus Accuracy.IEEE Trans Biomed Eng. 2016 Aug;63(8):1591-1601. doi: 10.1109/TBME.2015.2506680. Epub 2015 Dec 17. IEEE Trans Biomed Eng. 2016. PMID: 26685220 Free PMC article.
-
Experimental validation of hyperthermia SAR treatment planning using MR B1+ imaging.Phys Med Biol. 2004 Nov 21;49(22):5029-42. doi: 10.1088/0031-9155/49/22/001. Phys Med Biol. 2004. PMID: 15609556
-
SAR Simulations & Safety.Neuroimage. 2018 Mar;168:33-58. doi: 10.1016/j.neuroimage.2017.03.035. Epub 2017 Mar 20. Neuroimage. 2018. PMID: 28336426 Review.
-
Ultra-high field MRI: parallel-transmit arrays and RF pulse design.Phys Med Biol. 2023 Jan 18;68(2). doi: 10.1088/1361-6560/aca4b7. Phys Med Biol. 2023. PMID: 36410046 Review.
Cited by
-
Advancing Regulatory Science With Computational Modeling for Medical Devices at the FDA's Office of Science and Engineering Laboratories.Front Med (Lausanne). 2018 Sep 25;5:241. doi: 10.3389/fmed.2018.00241. eCollection 2018. Front Med (Lausanne). 2018. PMID: 30356350 Free PMC article.
-
Effect of field strength on RF power deposition near conductive leads: A simulation study of SAR in DBS lead models during MRI at 1.5 T-10.5 T.PLoS One. 2023 Jan 26;18(1):e0280655. doi: 10.1371/journal.pone.0280655. eCollection 2023. PLoS One. 2023. PMID: 36701285 Free PMC article.
-
Machine learning-based prediction of MRI-induced power absorption in the tissue in patients with simplified deep brain stimulation lead models.IEEE Trans Electromagn Compat. 2021 Oct;63(5):1757-1766. doi: 10.1109/temc.2021.3106872. Epub 2021 Sep 30. IEEE Trans Electromagn Compat. 2021. PMID: 34898696 Free PMC article.
-
Patient Orientation Affects Lead-Tip Heating of Cardiac Active Implantable Medical Devices during MRI.Radiol Cardiothorac Imaging. 2019 Aug 29;1(3):e190006. doi: 10.1148/ryct.2019190006. Radiol Cardiothorac Imaging. 2019. PMID: 32076667 Free PMC article.
-
RF-induced heating in tissue near bilateral DBS implants during MRI at 1.5 T and 3T: The role of surgical lead management.Neuroimage. 2019 Jan 1;184:566-576. doi: 10.1016/j.neuroimage.2018.09.034. Epub 2018 Sep 19. Neuroimage. 2019. PMID: 30243973 Free PMC article.
References
-
- IEC 60601-2-33 ed3. Particular requirements for the basic safety and essential performance of magnetic resonance equipment for medical diagnosis. 2010
-
- Yeung CJ, Susil RC, Atalar E. RF heating due to conductive wires during MRI depends on the phase distribution of the transmit field. Magn Reson Med. 2002;48:1096–1098. - PubMed
-
- ISO, TS 10974 Assessment of the safety of magnetic resonance imaging for patients with an active implantable medical device. 2012 - PubMed
-
- Park S-M, Kamondetdacha R, Nyenhuis JA. Calculation of MRI-induced heating of an implanted medical lead wire with an electric field transfer function. J Magn Reson Imaging. 2007;26:1278–1285. - PubMed
-
- Langman DA, Goldberg IB, Finn JP, Ennis DB. Pacemaker lead tip heating in abandoned and pacemaker-attached leads at 1.5 Tesla MRI. J Magn Reson Imaging. 2011;33:426–431. - PubMed
Publication types
MeSH terms
Grants and funding
LinkOut - more resources
Full Text Sources
Other Literature Sources
Medical
Miscellaneous
