. 2017 Sep;57(3):294-306.
doi: 10.1165/rcmb.2017-0061OC.

Cell Origin Dictates Programming of Resident versus Recruited Macrophages during Acute Lung Injury

Affiliations

Cell Origin Dictates Programming of Resident versus Recruited Macrophages during Acute Lung Injury

Kara J Mould et al. Am J Respir Cell Mol Biol. 2017 Sep.

Abstract

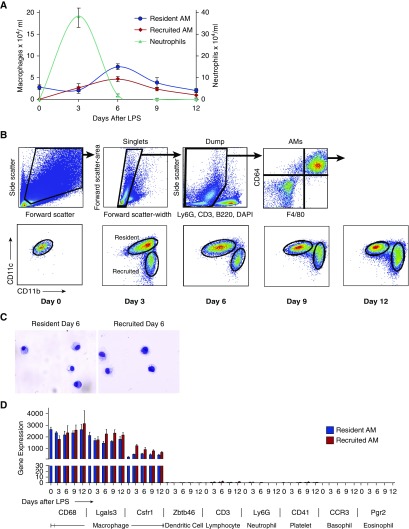
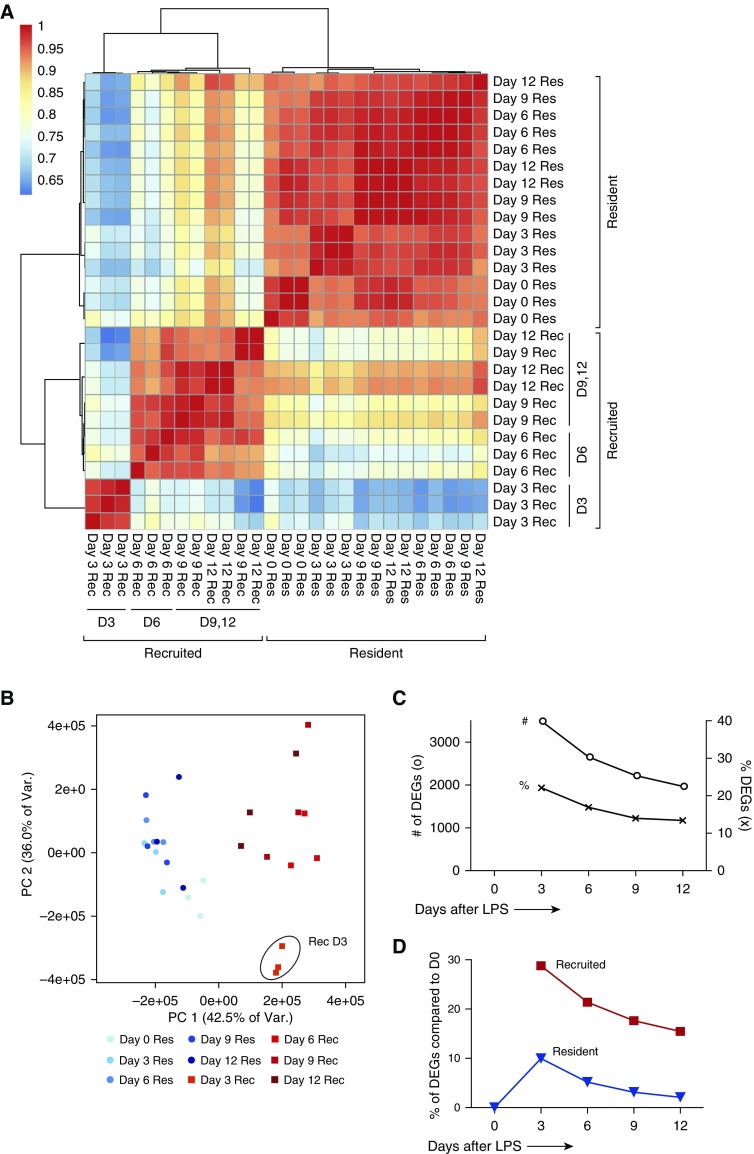
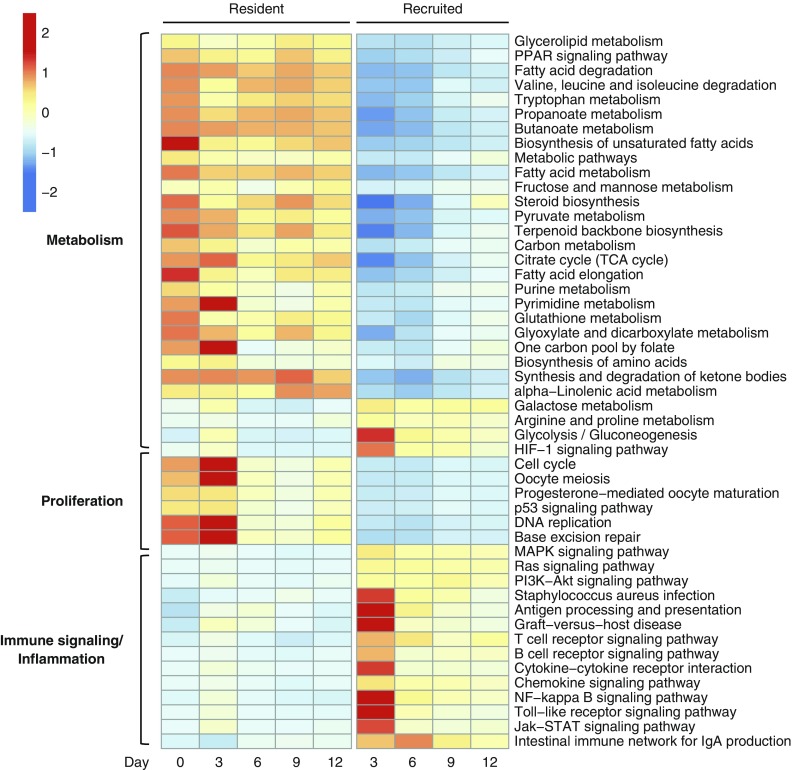
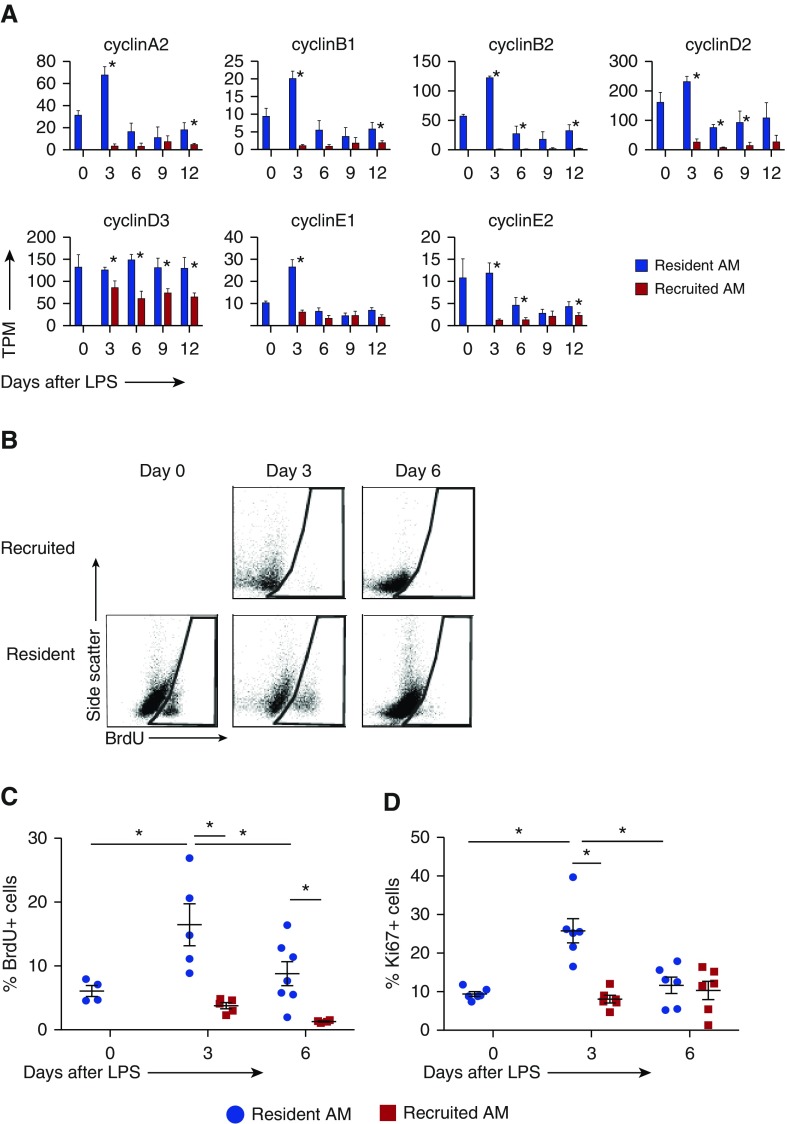
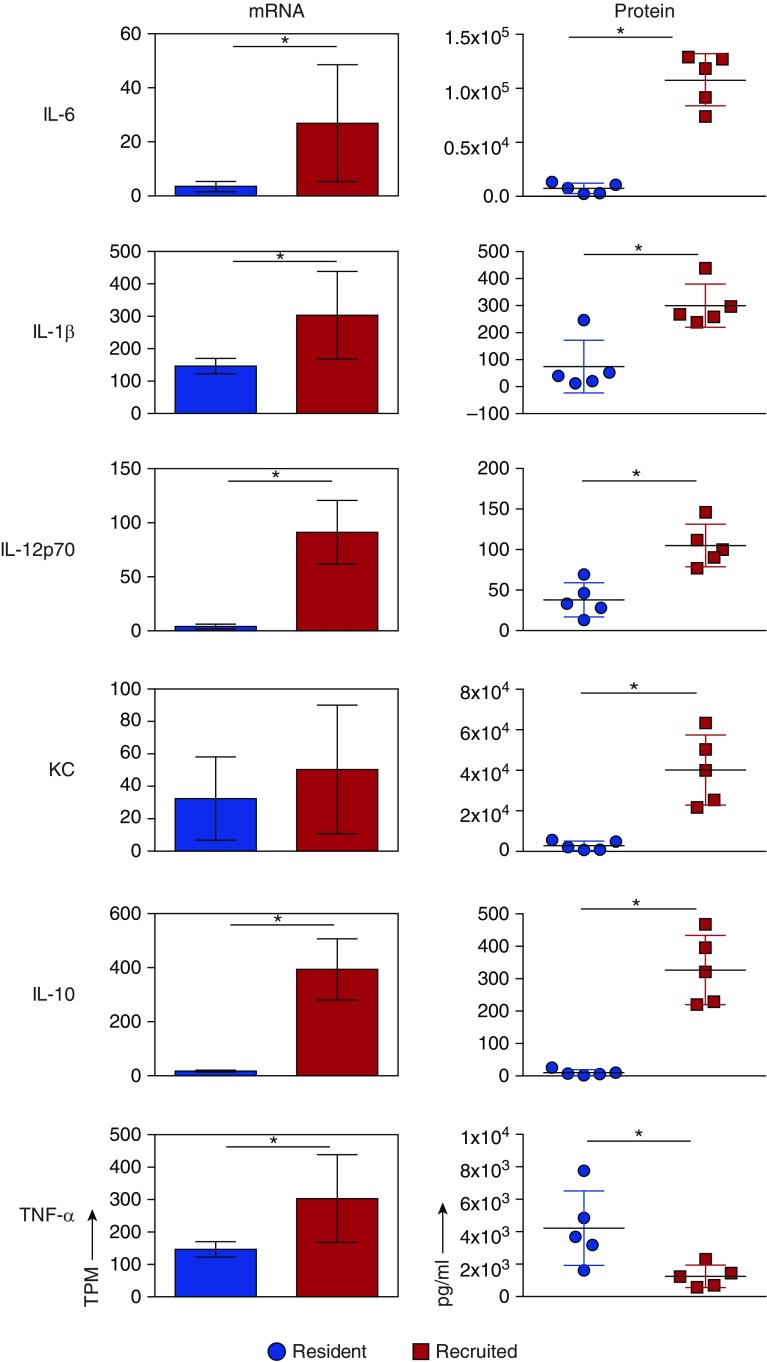
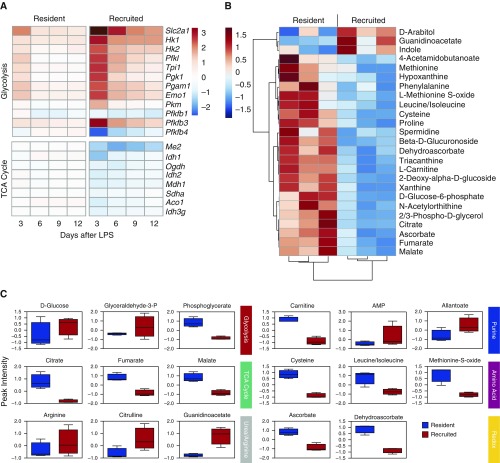
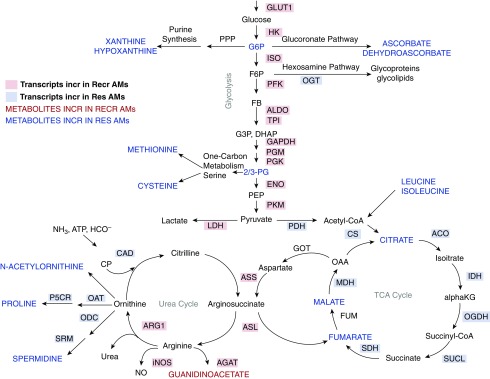
Two populations of alveolar macrophages (AMs) coexist in the inflamed lung: resident AMs that arise during embryogenesis, and recruited AMs that originate postnatally from circulating monocytes. The objective of this study was to determine whether origin or environment dictates the transcriptional, metabolic, and functional programming of these two ontologically distinct populations over the time course of acute inflammation. RNA sequencing demonstrated marked transcriptional differences between resident and recruited AMs affecting three main areas: proliferation, inflammatory signaling, and metabolism. Functional assays and metabolomic studies confirmed these differences and demonstrated that resident AMs proliferate locally and are governed by increased tricarboxylic acid cycle and amino acid metabolism. Conversely, recruited AMs produce inflammatory cytokines in association with increased glycolytic and arginine metabolism. Collectively, the data show that even though they coexist in the same environment, inflammatory macrophage subsets have distinct immunometabolic programs and perform specialized functions during inflammation that are associated with their cellular origin.

Keywords: acute lung injury; macrophage metabolism; macrophage programming.


Figures

Figure 1.
Figure 1.
Sort strategy and validation of RNA sequencing (RNAseq) data. Mice were treated with intratracheal LPS and macrophages were isolated from bronchoalveolar lavage (BAL). (A) Leukocyte counts from BAL after LPS-induced lung injury. Error bars represent SEM, n = 4–7 animals per time point. (B) Forward scatter and side scatter were used to exclude lymphocytes and monocytes (smaller and with lower side scatter than macrophages), and doublets were excluded using the pulse width. Dead and contaminating cells were further eliminated using DAPI, CD3, NK1.1, B220, and Ly6G. Alveolar macrophages (AMs) were further identified by high expression of CD64 and F4/80. AMs were then divided into resident (CD11chigh, CD11blow) or recruited (CD11clow, CD11bhigh) populations. (C) Sorted resident (left) and recruited (right) AMs were examined using light microscopy to ensure purity. (D) Gene transcript profiles of resident (blue bars) and recruited (red bars) AMs were evaluated for genes highly expressed by macrophages (CD68, Lgals3, and Csfr1) and for genes expressed by potential contaminating cells, including lymphocytes (CD3), neutrophils (Ly6G), eosinophils (Prg2), basophils (CCR3), dendritic cells (Zbtb46), and platelets (CD41).
Figure 2.
Figure 2.
Global analysis of resident and recruited AM transcriptomes after LPS treatment. (A) Individual replicates of resident (Res, blue) and recruited (Rec, red) AM transcriptomes were clustered based on pairwise Pearson correlation coefficients using the Ward method of the hclust function in R version 3.1.0. (B) Principal component (PC) analysis of Res and Rec samples at each time point. Day 3 recruited samples are circled. (C) Pairwise comparisons of resident and recruited AM transcriptomes at each time point expressed as the percentage of the genes that differed between cell types (x), and the number of differentially expressed genes (o) between cell types. Qualifying genes had at least a 2-fold change and an adjusted P value ≤ 0.1. (D) Pairwise comparison of resident AMs (blue triangle) or recruited AMs (red square) with naive resident AMs (same criteria as in C). # of DEGs, number of differentially expressed genes; % of DEGs, percent differentially expressed genes.
Figure 3.
Figure 3.
Pathway analysis of RNAseq. Selected KEGG pathways demonstrate enrichment of differentially expressed genes (compared with naive resident AMs). The median expression profile (transcripts per million [TPM]) of all differentially expressed genes in the pathway is scaled relative to the row mean. Differentially expressed genes are defined as those with at least a 2-fold change in either direction and adjusted P value ≤ 0.1.
Figure 4.
Figure 4.
Proliferation of resident versus recruited AMs. (A) Expression levels of classical cyclins from RNAseq data, shown as TPM. Error bars represent SD between replicates. (B–D) Proliferation of resident and recruited AMs measured by BrdU incorporation and Ki67 staining via flow cytometry. BrdU was injected 24 h before harvest. (B) Representative flow plots of BrdU-positive cells. Positive gates were drawn based on fluorescence minus one controls at each time point. (C and D) Percent BrdU-positive and Ki67-positive resident (blue circle) versus recruited (red square) AMs in BAL. Error bars represent SD. n = 4–7 animals per time point. *P < 0.05.
Figure 5.
Figure 5.
Inflammatory cytokine profiles of resident and recruited AMs. Resident and recruited AMs were isolated 3 days after LPS treatment. Right panel: cytokine concentrations (in pg/ml) were measured in conditioned media after 24 h of culture. Left panel: gene expression of proinflammatory cytokines using freshly isolated macrophages. mRNA levels are expressed as TPM. IL-12α mRNA levels are shown. There was no significant difference in IL-12β transcript levels between resident and recruited AMs. n = 3 per group, mean and SD shown. KC, chemokine ligand 1. Error bars represent SD. Significance testing was done using Student’s t test for protein levels and the Wald test in DESeq2 (adjusted for multiple testing) for RNAseq. *P < 0.05.
Figure 6.
Figure 6.
Metabolic profiles of resident and recruited AMs. (A) Base-2 log fold-change expression of transcripts involved in glycolytic and TCA-cycle metabolism in resident and recruited AMs after LPS treatment relative to naive AMs is shown as a heat map. (B) Hierarchical clustering of the top 25 metabolites differentially detected in resident and recruited AMs at Day 3 (the relative abundance is shown). (C) Peak intensity of select metabolites from major metabolic pathways in resident (blue) and recruited (red) AMs at Day 3. The box represents the 25th–75th percentile of peak intensity (atomic units), n = 3. The horizontal line represents the median value. Error bars represent minimum and maximum values. TCA, tricarboxylic acid.
Figure 7.
Figure 7.
Integration of RNAseq and metabolomics data. Major metabolic pathways are illustrated. Gene transcripts and metabolite levels were compared between Res and Recr AMs at Day 3 after LPS treatment. Transcripts differentially upregulated (at least a 2-fold change and adjusted P value ≤ 0.1) in resident AMs are highlighted in blue, and those increased in recruited AMs are highlighted in red. Metabolites detected at higher levels in resident AMs are in blue font and those elevated in recruited AMs are in red font. 2/3-PG, 2/3-phosophoglycerate; ACO, aconitase; AGAT, arginine:glycine amidinotransferase; ALDO, aldolase; αKG, α-ketoglutarate; ARG1, arginase 1; ASL, arginosuccinate lyase; ASS, arginosuccinate synthase; CAD, carbamoyl phosphate synthetase; CP, carbamoyl phosphate; CS, citrate synthase; DHAP, dihydroxyacetone phosphate; ENO, enolase; F6P, fructose 6-phosphate; FB, fructose 1,6-bisphosphate; FUM, fumarase; G3P, glyceraldehyde 3-phosphate; G6P, glucose 6-phosphate; GLUT1, solute carrier family 2, facilitated glucose transporter 1; GOT, aspartate aminotransferase; HK, hexokinase; IDH, isocitrate dehydrogenase; iNOS, inducible nitric oxide synthase; ISO, phosphoglucose isomerase; LDH, lactate dehydrogenase; MDH, malate dehydrogenase; NO, nitric oxide; OAA, oxaloacetic acid; OAT, ornithine aminotransferase; ODC, ornithine decarboxylase; OGDH, α-ketoglutarate dehydrogenase; OGT, O-linked N-acetylglucosamine transferase; P5CR, pyrroline-5-carboxylate reductase; PDH, pyruvate dehydrogenase; PEP, phosphoenolpyruvate; PFK, phosphofructokinase; PGM, phosphoglycerate mutase; PGK, phosphoglycerate kinase; PKM, pyruvate kinase; PPP, pentose phosphate shunt; SDH, succinate dehydrogenase; SRM, spermine synthase; SUCL, succinate-CoA ligase; TPI, triose phosphate isomerase.

Similar articles

Cited by

References

    1. Cakarova L, Marsh LM, Wilhelm J, Mayer K, Grimminger F, Seeger W, Lohmeyer J, Herold S. Macrophage tumor necrosis factor-alpha induces epithelial expression of granulocyte-macrophage colony-stimulating factor: impact on alveolar epithelial repair. Am J Respir Crit Care Med. 2009;180:521–532. - PubMed
    1. Herold S, Tabar TS, Janssen H, Hoegner K, Cabanski M, Lewe-Schlosser P, Albrecht J, Driever F, Vadasz I, Seeger W, et al. Exudate macrophages attenuate lung injury by the release of IL-1 receptor antagonist in gram-negative pneumonia. Am J Respir Crit Care Med. 2011;183:1380–1390. - PubMed
    1. Maus UA, Waelsch K, Kuziel WA, Delbeck T, Mack M, Blackwell TS, Christman JW, Schlöndorff D, Seeger W, Lohmeyer J. Monocytes are potent facilitators of alveolar neutrophil emigration during lung inflammation: role of the CCL2-CCR2 axis. J Immunol. 2003;170:3273–3278. - PubMed
    1. Narasaraju T, Ng HH, Phoon MC, Chow VT. MCP-1 antibody treatment enhances damage and impedes repair of the alveolar epithelium in influenza pneumonitis. Am J Respir Cell Mol Biol. 2010;42:732–743. - PMC - PubMed
    1. Huynh ML, Fadok VA, Henson PM. Phosphatidylserine-dependent ingestion of apoptotic cells promotes TGF-beta1 secretion and the resolution of inflammation. J Clin Invest. 2002;109:41–50. - PMC - PubMed

Publication types

MeSH terms