. 2017 Apr 19:6:e25827.
doi: 10.7554/eLife.25827.

Synaptic input sequence discrimination on behavioral timescales mediated by reaction-diffusion chemistry in dendrites

Affiliations

Synaptic input sequence discrimination on behavioral timescales mediated by reaction-diffusion chemistry in dendrites

Upinder Singh Bhalla. Elife. .

Abstract

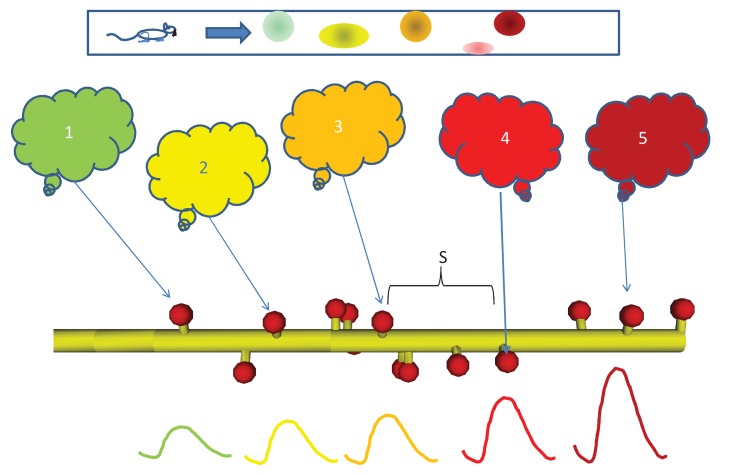
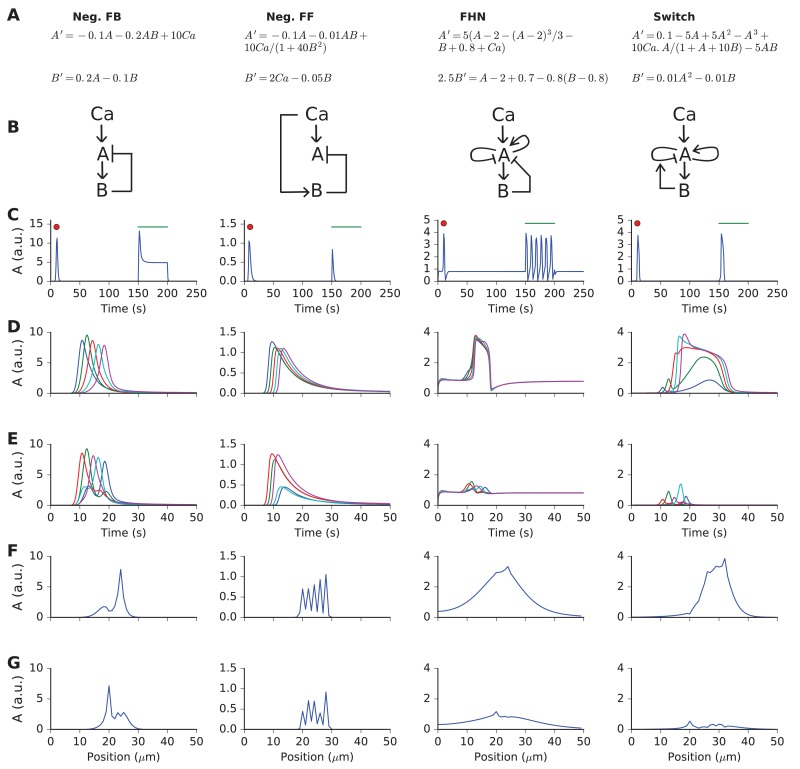
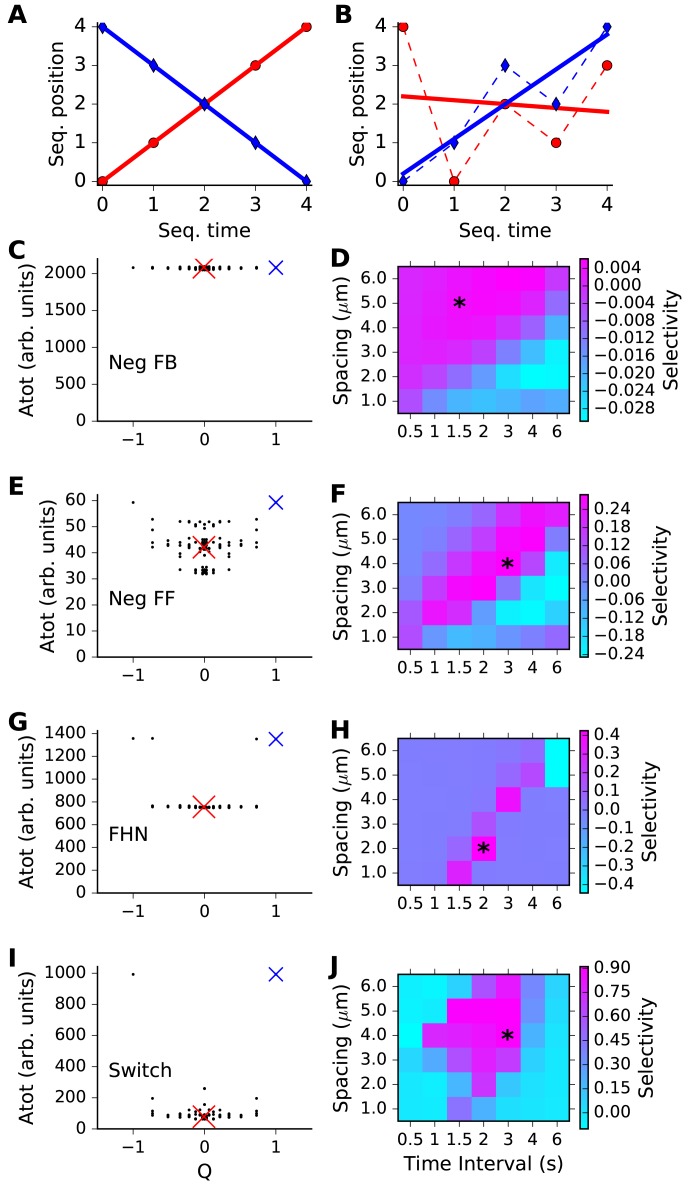
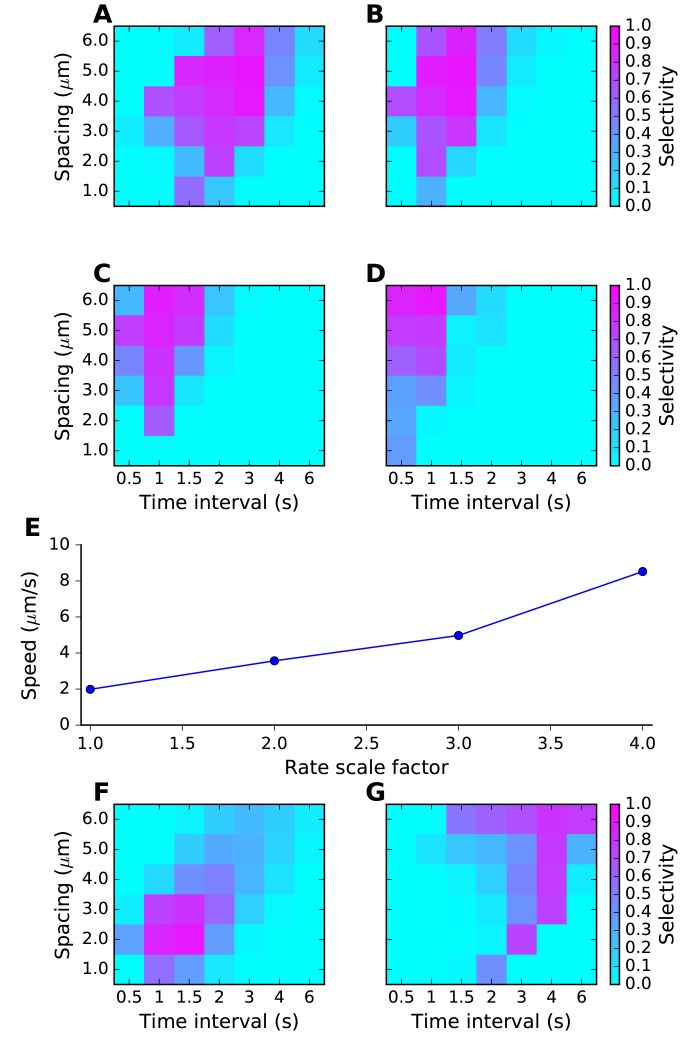
Sequences of events are ubiquitous in sensory, motor, and cognitive function. Key computational operations, including pattern recognition, event prediction, and plasticity, involve neural discrimination of spatio-temporal sequences. Here, we show that synaptically-driven reaction-diffusion pathways on dendrites can perform sequence discrimination on behaviorally relevant time-scales. We used abstract signaling models to show that selectivity arises when inputs at successive locations are aligned with, and amplified by, propagating chemical waves triggered by previous inputs. We incorporated biological detail using sequential synaptic input onto spines in morphologically, electrically, and chemically detailed pyramidal neuronal models based on rat data. Again, sequences were recognized, and local channel modulation downstream of putative sequence-triggered signaling could elicit changes in neuronal firing. We predict that dendritic sequence-recognition zones occupy 5 to 30 microns and recognize time-intervals of 0.2 to 5 s. We suggest that this mechanism provides highly parallel and selective neural computation in a functionally important time range.

Keywords: CICR; MAPK; multiscale model; neuroscience; pattern recognition; rat; reaction-diffusion; signaling.


Conflict of interest statement

USB: Reviewing editor, eLife.

Figures

Figure 1.
Figure 1.. Sequential activity, from behavior to dendrite.
Top: Linear arena in which a rat moves, with indicated locations of 5 place cells (color coded green, yellow, orange, red, and maroon in order.). The place cells are representatives of 5 neuronal ensembles (colored clouds), each active in one of the five locations on the arena. The neuronal ensembles each send a single axonal projection in spatial order to a small dendritic segment on a postsynaptic neuron, with an average spacing S between connected spines. Note that spines need not be immediately adjacent to each other. Below, buildup of reactant following input activity with the appropriate timing, corresponding to the rat moving at a speed which the dendritic chemistry recognizes. DOI: http://dx.doi.org/10.7554/eLife.25827.002
Figure 2.
Figure 2.. Responses and sequence selectivity of four abstract models involving molecules A and B.
Columns are the respective models. (A) Model equations. (B) Model schematics. Arrows indicate excitation, plungers indicate inhibition. In the FHN model, A has a fast self-excitation and a slow self-inhibition. In the Switch model, we indicate a multiplicative inhibition of A by an arrow from B onto the self-inhibition arrow of A. (C) Response of point (non-spatial) model to a 1 s wide Gaussian input of Ca2+ (red dot) and a steady pulse of Ca2+ (green line). Input amplitudes: 1, 10, 0.4, and 1 respectively. (D-G) Response of molecule A in one-dimensional reaction-diffusion form of model to sequential input at five locations. (D) Time-course of response at five locations to ordered input. Locations are color-coded in the sequential order blue, green, red, cyan, purple. (E) Time-course of response at five locations to scrambled input. Note that the FHN and Switch models have much lower responses to scrambled as compared to ordered input. The Neg. FF model has a lower response at two of its locations. (F, G) Snapshot of spatial profile of response to ordered (F) and scrambled (G) input. Snapshot is at time 18.4, 14.2, 16.3 and 18.4 s respectively. DOI: http://dx.doi.org/10.7554/eLife.25827.003
Figure 3.
Figure 3.. Sequence selectivity for different models.
(A, B) Regression plots for sample sequences. (A) Perfect forward sequence [0,1,2,3,4] (red, Q = 1) and reverse sequence [4,3,2,1,0] (blue, Q = −1). (B) Scrambled sequence [4,0,2,1,3] (red, Q = −0.001) and [0,1,3,2,4] (blue, Q = 0.729). (C, E, G, I) Scatter plots of chemical system selectivity (measured as total activation of molecule A over time and space) against Q. There are 5! = 120 points, each being the outcome of a single simulation with a different sequence. In each plot the blue cross is the perfect forward sequence (whose timeseries is shown in Figure 2D), and the red cross is the scrambled sequence [2,1,4,3,0], whose timeseries is shown in Figure 2E. (D, F, H, J) Matrix of selectivity as a function of total length of stimulus zone and interval time between successive stimuli. In each plot, the asterisk is placed on the matrix entry obtained from the spacing and interval parameters used for the scatter plot to its left. In other words, the selectivity value for that matrix entry is obtained from Equation 3 using the Atot scores from the scatter plot. (C,D) Feedback model. This shows no selectivity. (E, F) Inhibitory feedforward model. Scatter plot in E represents calculations performed at time/distance values of (3 s, 4 mm). This shows low selectivity, as seen by slightly higher Atot for Q values of +1 and −1. (G,H) FitzHugh-Nagumo, scatter plot at (2 s, 2 mm). The model is selective in a narrow, diagonal range of time and distance. Its score is somewhat reduced because of the high baseline of Atot. (I,J) Switching model, scatter plot at (3 s, 4 mm). This is highly selective over a wide range of time and distance. Only the perfect forward and reverse sequences have high values of Atot. DOI: http://dx.doi.org/10.7554/eLife.25827.008
Figure 4.
Figure 4.. Sequence tuning ranges in space and time.
(A-D) tuning for rates of 1, 2, 3 and 4 times basal, respectively. (E) Plot of speed of sequence as a function of the rate scale factor. (F, G) Preferred space/time of tuning shifts with stimulus amplitude. (F) 90% basal. (G) 110% basal. DOI: http://dx.doi.org/10.7554/eLife.25827.009
Figure 4—figure supplement 1.
Figure 4—figure supplement 1.. Parameter sensitivity for FHN (FitzHugh-Nagumo) reaction-diffusion model.
In each plot, the blue trace is the summed concentration of A for the sequential stimulus, and the green plot is the mean of summed A over all permutations of the stimulus. A is summed over time since start of stimulus till end of simulation, and also summed over all five stimulus points. In each plot, the red trace is the selectivity metric (Equation 3). Note that the selectivity is largest when the ratio of blue to green traces is largest. Because of the high baseline in the FHN model, as seen in the blue and green traces, the selectivity (red traces) remains under 0.5. In each plot the x axis is scale factor of selected parameter with respect to the default model. Panel (A) Stimulus amplitude. (B) stimulus width. (C) Diffusion constant of molecule A. (D) Diffusion constant of molecule B. (E) rate constant for ‘t’ variable in FHN equations. (F) rate constant a. (G) rate constant b. (H) Offset term for variable A. (I) Offset term for variable B. Most parameters give good tuning for a range of ±10% around reference (1.0), but k_a is still more sensitive. DOI: http://dx.doi.org/10.7554/eLife.25827.010
Figure 4—figure supplement 2.
Figure 4—figure supplement 2.. Parameter sensitivity for switch (Propagating bistable switch) reaction-diffusion model.
Plot traces are as in Figure 4—figure supplement 1. Panel (A) Stimulus amplitude. (B) stimulus width. (C) Diffusion constant of molecule A. (D) Diffusion constant of molecule B. (E-L) Rate constants used in model. The model was sensitive to stimulus amplitude, and the rate terms k1a, k2a and k4a, and less sensitive for the rest. We classified sensitive parameters as those where selectivity fell below 0.5 for a parameter range of ±10% or less. DOI: http://dx.doi.org/10.7554/eLife.25827.011
Figure 5.
Figure 5.. Mass action model of a MAPK switch exhibits sequence selectivity.
(A) Schematic of model chemistry. Black arrows indicate binding or activation reactions, plunger indicates inhibition, and bent arrow indicates enzyme activity. Broad cyan arrows indicate diffusion of Ca2+ and CaM between PSD, spine head, and dendrite. CaM buffers the incoming Ca2+ from the PSD. (B) Ca2+ responses seen at the dendrite, to input delivered at PSD. PSD stimulus was two pulses of 1 s, 160 mM Ca2+, separated by 50 s. After a delay of 100 s, a step of 160 mM Ca2+ was delivered for 50 s. (C) MAPK-P response to the Ca2+ stimulus. Note strong inhibition of the response to the second pulse, and rapid decline of response to the 50 step stimulus. (D) Geometry of 1-D reaction-diffusion model, with 49 spines. Dendrite diameter was 1 μm and length was 60 μm. The five stimulated spines are in red, each identified by a color coded number. (E) Response of system to sequential input [0,1,2,3,4] on indicated spines spaced ~3 μm apart, at intervals of 3 s. Each input was delivered to the PSD of the stimulated spine, at 160 μM, for 2.9 s. MAPK-P was recorded from the dendrite subdivision attached to each of the stimulated spines. Plot colors indicate stimulated spine from D. (F) Response to scrambled input, in the order [4,0,3,1,2]. The response to scrambled input had a smaller amplitude and lasted for a shorter time. Plot colors are as per spine numbers in D. DOI: http://dx.doi.org/10.7554/eLife.25827.012
Figure 6.
Figure 6.. Sequence selectivity in detailed electrical+chemical signaling model.
(A) Morphology of model. Dendrite diameters are scaled up by 2, and spine diameters and lengths by four for visualization. Stimulus was given in four zones on the cell, indicated in red and by diameters scaled up by 10x. (B) Example somatic intracellular potential and spike train of model neuron. (C) Ca2+ responses to Poisson synaptic volley at mean rate 20 Hz, measured in PSD (blue), spine head (green) and dendrite (red). (D) Sequence selectivity in the distal apical zone. Heavy solid lines are P-MAPK-P levels under the stimulated spines, for sequential input. Strong buildup occurs for three of the spines. Dashed lines are corresponding MAPK-P levels for scrambled input. Only the sequential input responses lead to build up. (E-G) Matrix of sequence selectivity in basal dendrite zone, for different input spacing in time and space. Three different runs are shown, with the same morphology but different random number seeds for the background and stimulus synaptic input. (H) Selectivity in proximal oblique dendrite zone, using 40% larger spine dimensions. (I) Selectivity in distal apical dendrite using 20% larger spines. (J) Selectivity matrix in proximal primary apical dendrite shows no sequence selectivity even with 40% larger spines. DOI: http://dx.doi.org/10.7554/eLife.25827.013
Figure 6—figure supplement 1.
Figure 6—figure supplement 1.. In each plot, the blue trace is the summed concentration of MAPK-P for the sequential stimulus, and the green plot is the mean of summed MAPK-P over 12 permutations of the stimulus.
MAPK-P is summed over time since start of stimulus till end of simulation, and also summed over all five stimulus points. In each plot, the red trace is the selectivity metric (Equation 3, Materials and methods). (A) Stimulus spike rate. (B) Spatial density of LCa channel over basal and apical dendrites. Somatic LCa was held uniform at 40 S/m^2. (C) Diffusion constant for Ca2+. (D) Forward rate constant for Ca2+ activation of Raf, which acts as input to the signaling pathway. DOI: http://dx.doi.org/10.7554/eLife.25827.014
Figure 7.
Figure 7.. Firing rate changes in response to channel modulation in small zones on the dendritic tree.
Error bars are standard deviation. (A) Modulation of Na current. (B) Adding nonselective Leak current. (C) Modulation of GluR in the presence of the same synaptic input as was used as a stimulus for the sequential input. (D) Schematic of convergence of inputs from different ensembles onto one dendritic zone. The numbered clouds represent input ensembles from which a single neuron projects to the indicated location on the dendrite. DOI: http://dx.doi.org/10.7554/eLife.25827.018

Similar articles

Cited by

References

    1. Abeles M. Local Cortical Circuits: An Electrophysiological Study. Berlin: Springer; 1982.
    1. Ascoli GA, Donohue DE, Halavi M. NeuroMorpho.Org: a central resource for neuronal morphologies. Journal of Neuroscience. 2007;27:9247–9251. doi: 10.1523/JNEUROSCI.2055-07.2007. - DOI - PMC - PubMed
    1. Barak O, Tsodyks M. Recognition by variance: learning rules for spatiotemporal patterns. Neural Computation. 2006;18:2343–2358. doi: 10.1162/neco.2006.18.10.2343. - DOI - PubMed
    1. Bhalla US, Iyengar R. Emergent properties of networks of biological signaling pathways. Science. 1999;283:381–387. doi: 10.1126/science.283.5400.381. - DOI - PubMed
    1. Bhalla US. Mechanisms for temporal tuning and filtering by postsynaptic signaling pathways. Biophysical Journal. 2002;83:740–752. doi: 10.1016/S0006-3495(02)75205-3. - DOI - PMC - PubMed

Publication types

LinkOut - more resources