

ZeGlobalTox: An Innovative Approach to Address Organ Drug Toxicity Using Zebrafish
- PMID: 28422076
- PMCID: PMC5412445
- DOI: 10.3390/ijms18040864
ZeGlobalTox: An Innovative Approach to Address Organ Drug Toxicity Using Zebrafish
Abstract
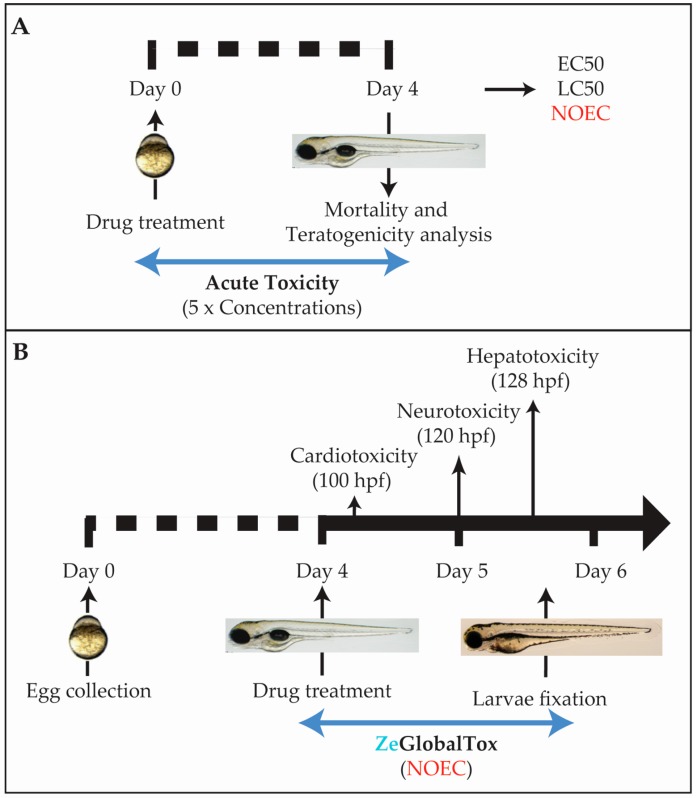
Toxicity is one of the major attrition causes during the drug development process. In that line, cardio-, neuro-, and hepatotoxicities are among the main reasons behind the retirement of drugs in clinical phases and post market withdrawal. Zebrafish exploitation in high-throughput drug screening is becoming an important tool to assess the toxicity and efficacy of novel drugs. This animal model has, from early developmental stages, fully functional organs from a physiological point of view. Thus, drug-induced organ-toxicity can be detected in larval stages, allowing a high predictive power on possible human drug-induced liabilities. Hence, zebrafish can bridge the gap between preclinical in vitro safety assays and rodent models in a fast and cost-effective manner. ZeGlobalTox is an innovative assay that sequentially integrates in vivo cardio-, neuro-, and hepatotoxicity assessment in the same animal, thus impacting strongly in the 3Rs principles. It Reduces, by up to a third, the number of animals required to assess toxicity in those organs. It Refines the drug toxicity evaluation through novel physiological parameters. Finally, it might allow the Replacement of classical species, such as rodents and larger mammals, thanks to its high predictivity (Specificity: 89%, Sensitivity: 68% and Accuracy: 78%).
Keywords: ZeGlobalTox; adverse drug reaction; cardiotoxicity; drug toxicity; hepatotoxicity; high-throughput; neurotoxicity; zebrafish.
Conflict of interest statement
The authors declare the following conflict of interest: All authors, except Els van Doornmalen, Helma Rutjes, and Thierry Savy, are currently employed by Zeclinics.
Figures
Similar articles
-
Zebrafish: An emerging whole-organism screening tool in safety pharmacology.Indian J Pharmacol. 2020 Nov-Dec;52(6):505-513. doi: 10.4103/ijp.IJP_482_19. Indian J Pharmacol. 2020. PMID: 33666192 Free PMC article. Review.
-
Validation of the use of zebrafish larvae in visual safety assessment.J Pharmacol Toxicol Methods. 2008 Jul-Aug;58(1):50-8. doi: 10.1016/j.vascn.2008.04.002. Epub 2008 May 2. J Pharmacol Toxicol Methods. 2008. PMID: 18541443
-
Editor's Highlight: Transgenic Zebrafish Reporter Lines as Alternative In Vivo Organ Toxicity Models.Toxicol Sci. 2017 Mar 1;156(1):133-148. doi: 10.1093/toxsci/kfw250. Toxicol Sci. 2017. PMID: 28069987
-
Validation of a larval zebrafish locomotor assay for assessing the seizure liability of early-stage development drugs.J Pharmacol Toxicol Methods. 2008 May-Jun;57(3):176-87. doi: 10.1016/j.vascn.2008.01.004. Epub 2008 Feb 9. J Pharmacol Toxicol Methods. 2008. PMID: 18337127
-
The use of in vivo zebrafish assays in drug toxicity screening.Expert Opin Drug Metab Toxicol. 2009 Apr;5(4):393-401. doi: 10.1517/17425250902882128. Expert Opin Drug Metab Toxicol. 2009. PMID: 19368493 Review.
Cited by
-
Zebrafish as a New Tool in Heart Preservation Research.J Cardiovasc Dev Dis. 2021 Apr 8;8(4):39. doi: 10.3390/jcdd8040039. J Cardiovasc Dev Dis. 2021. PMID: 33917701 Free PMC article. Review.
-
Combining Zebrafish and CRISPR/Cas9: Toward a More Efficient Drug Discovery Pipeline.Front Pharmacol. 2018 Jul 3;9:703. doi: 10.3389/fphar.2018.00703. eCollection 2018. Front Pharmacol. 2018. PMID: 30018554 Free PMC article. Review.
-
Safety Assessment of Compounds after In Vitro Metabolic Conversion Using Zebrafish Eleuthero Embryos.Int J Mol Sci. 2019 Apr 6;20(7):1712. doi: 10.3390/ijms20071712. Int J Mol Sci. 2019. PMID: 30959884 Free PMC article.
-
Zebrafish: An Attractive Model to Study Staphylococcus aureus Infection and Its Use as a Drug Discovery Tool.Pharmaceuticals (Basel). 2021 Jun 21;14(6):594. doi: 10.3390/ph14060594. Pharmaceuticals (Basel). 2021. PMID: 34205723 Free PMC article. Review.
-
Adult and Developing Zebrafish as Suitable Models for Cardiac Electrophysiology and Pathology in Research and Industry.Front Physiol. 2021 Jan 13;11:607860. doi: 10.3389/fphys.2020.607860. eCollection 2020. Front Physiol. 2021. PMID: 33519514 Free PMC article. Review.
References
-
- Waring M.J., Arrowsmith J., Leach A.R., Leeson P.D., Mandrell S., Owen R.M., Pairaudeau G., Pennie W.D., Pickett S.D., Wang J., et al. An analysis of the attrition of drug candidates from four major pharmaceutical companies. Nat. Rev. Drug Discov. 2015;14:475–486. doi: 10.1038/nrd4609. - DOI - PubMed
MeSH terms
LinkOut - more resources
Full Text Sources
Other Literature Sources
Medical
Molecular Biology Databases
Miscellaneous
