. 2017 Apr 19:8:15057.
doi: 10.1038/ncomms15057.

Hierarchical assembly of centriole subdistal appendages via centrosome binding proteins CCDC120 and CCDC68

Affiliations

Hierarchical assembly of centriole subdistal appendages via centrosome binding proteins CCDC120 and CCDC68

Ning Huang et al. Nat Commun. .

Abstract

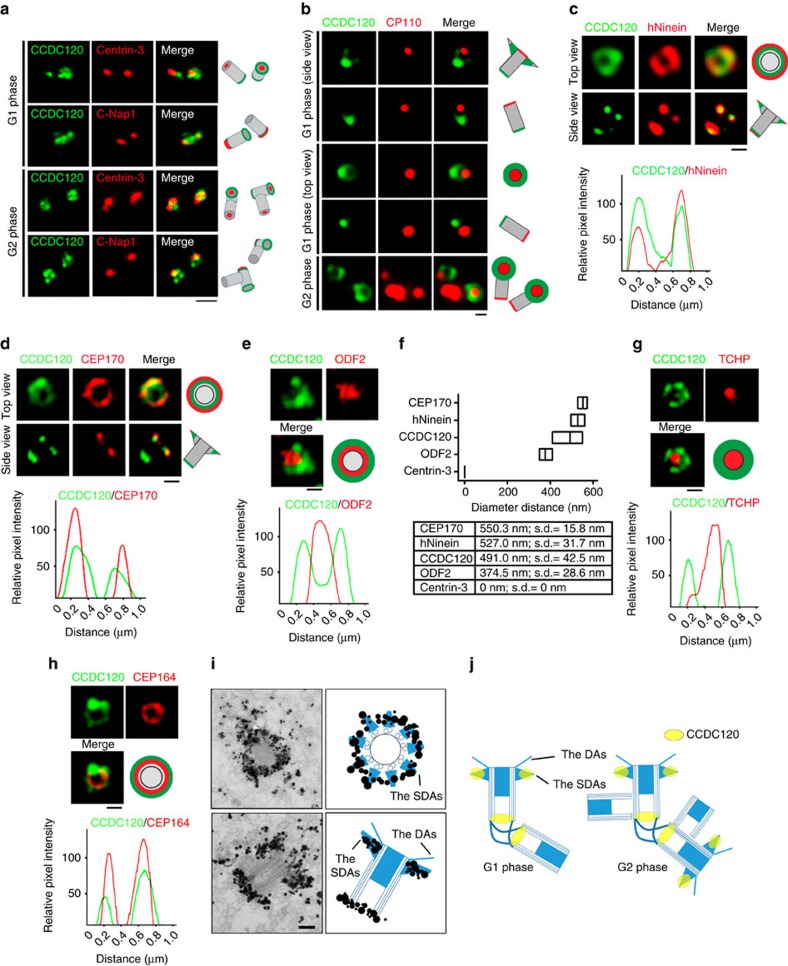
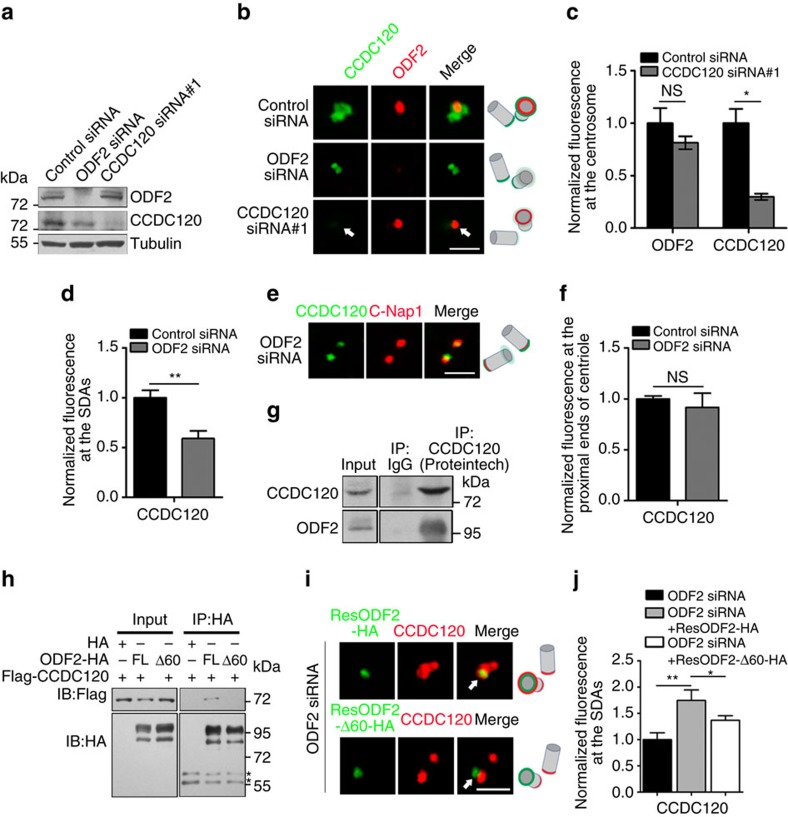
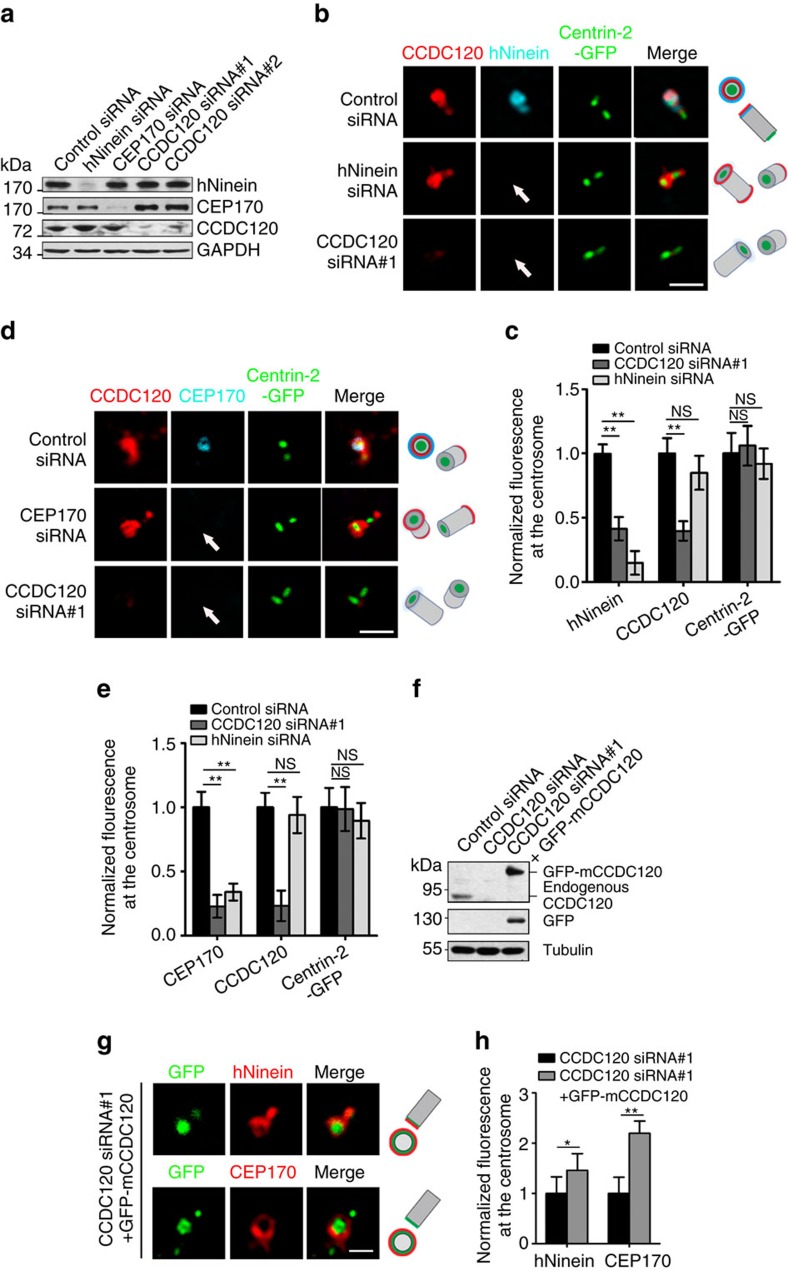
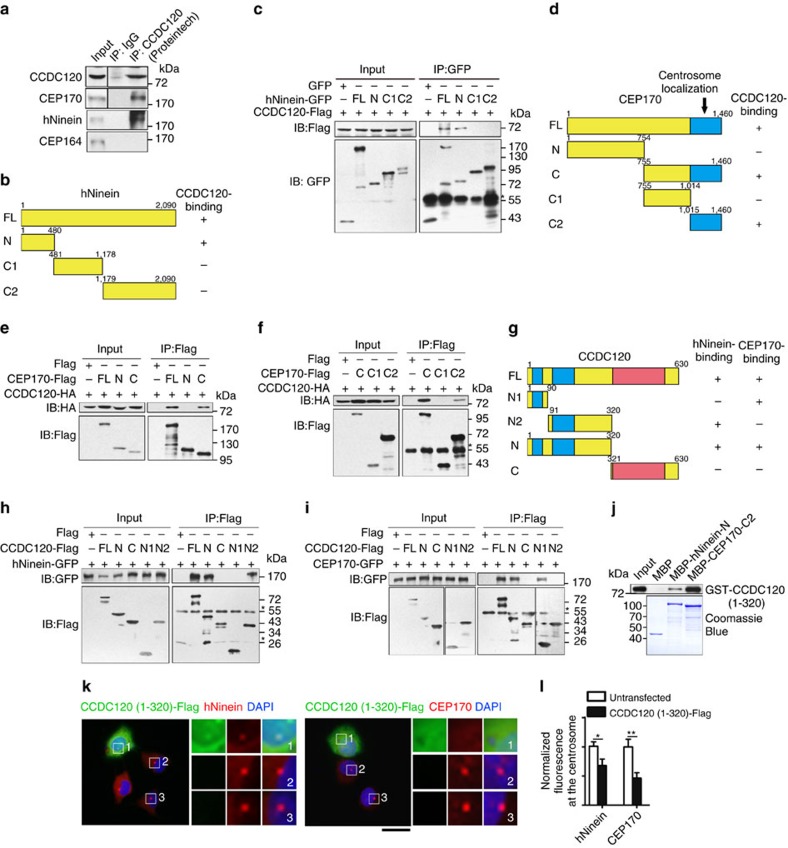
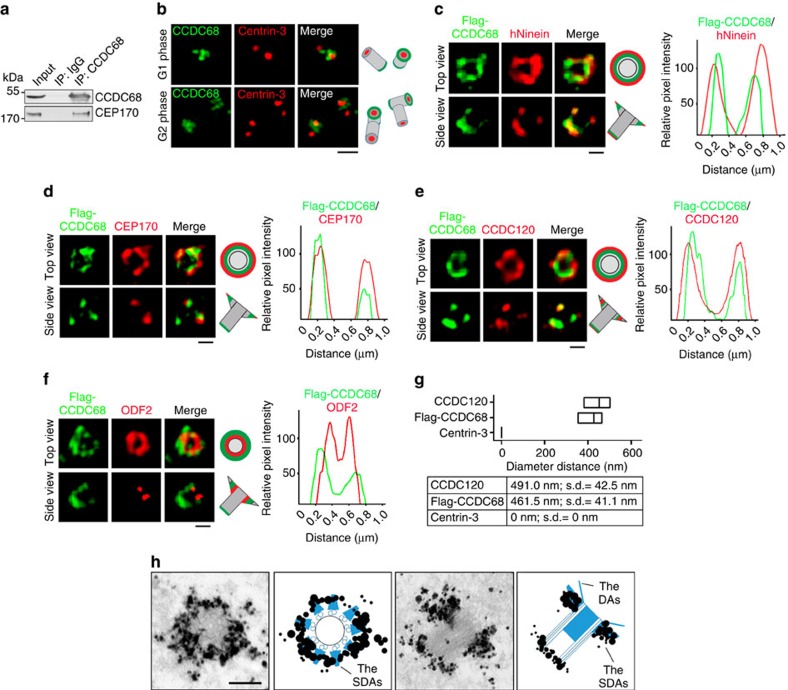
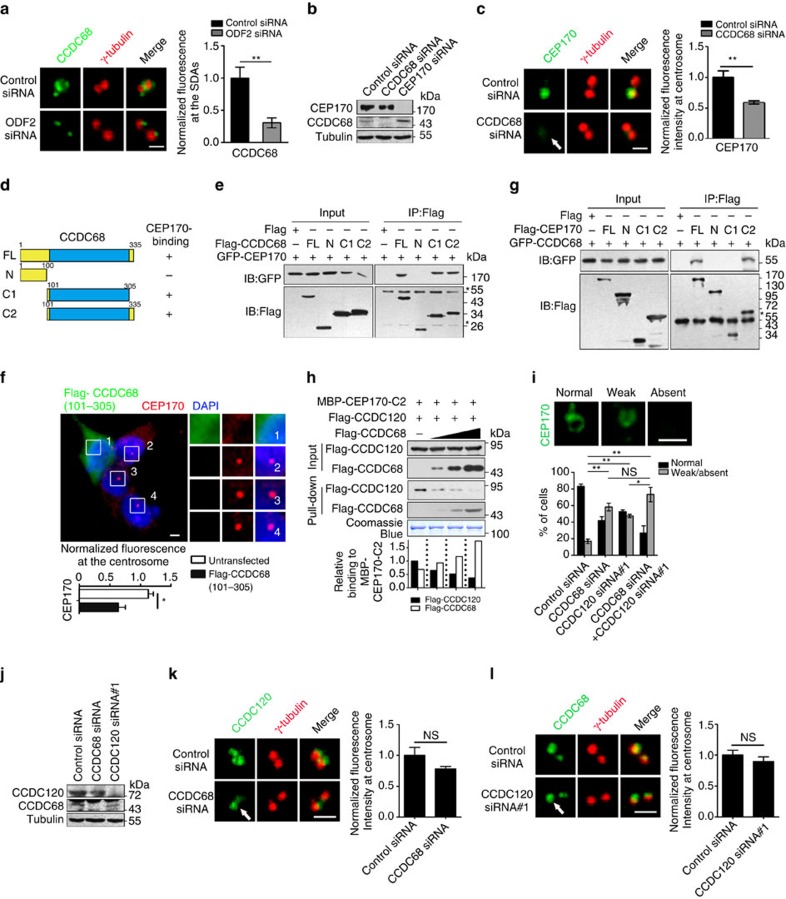
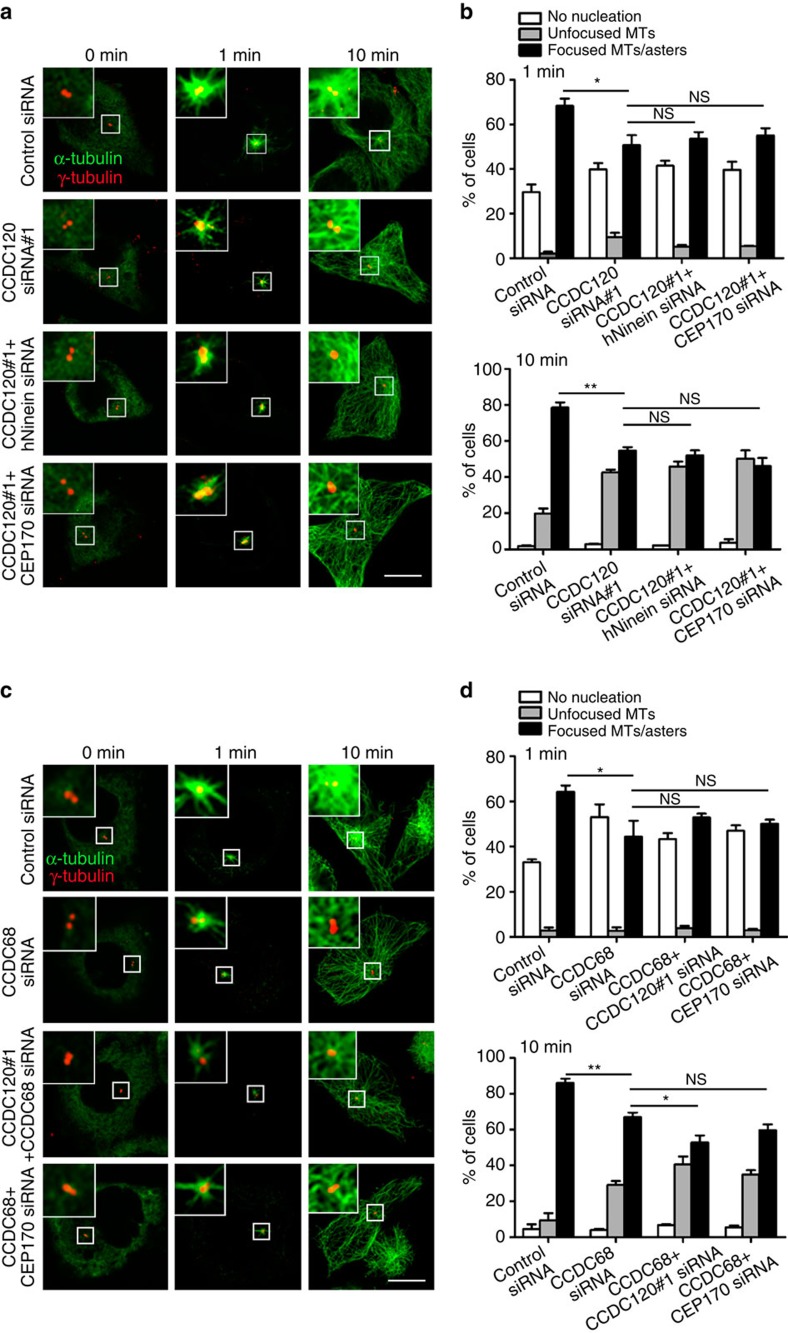
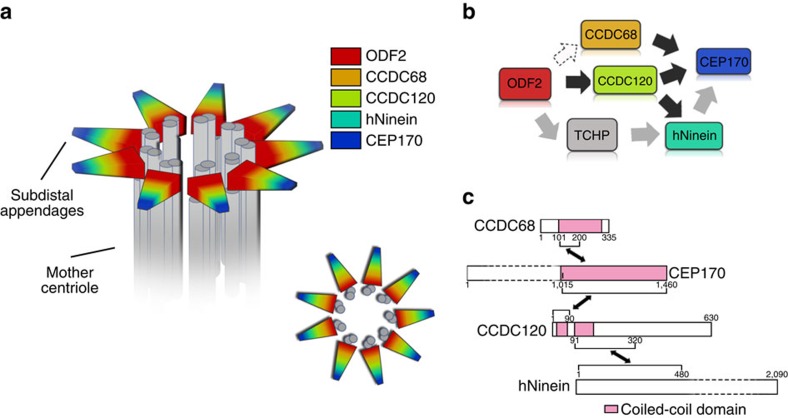
In animal cells, the centrosome is the main microtubule-organizing centre where microtubules are nucleated and anchored. The centriole subdistal appendages (SDAs) are the key structures that anchor microtubules in interphase cells, but the composition and assembly mechanisms of SDAs are not well understood. Here, we reveal that centrosome-binding proteins, coiled-coil domain containing (CCDC) 120 and CCDC68 are two novel SDA components required for hierarchical SDA assembly in human cells. CCDC120 is anchored to SDAs by ODF2 and recruits CEP170 and Ninein to the centrosome through different coiled-coil domains at its N terminus. CCDC68 is a CEP170-interacting protein that competes with CCDC120 in recruiting CEP170 to SDAs. Furthermore, CCDC120 and CCDC68 are required for centrosome microtubule anchoring. Our findings elucidate the molecular basis for centriole SDA hierarchical assembly and microtubule anchoring in human interphase cells.


Conflict of interest statement

The authors declare no competing financial interests.

Figures

Figure 1
Figure 1. CCDC120 is localized at the centrosome.
(a) Immunofluorescence of CCDC120 (green) and Centrin-3 (red), or C-Nap1 (red) in U2OS cells. Scale bar, 1 μm. (be) 3D-SIM images of U2OS cells double-immunostained with antibodies against CCDC120 (green) and CP110 (b, red), hNinein (c, red), CEP170 (d, red) or ODF2 (e, red). Scale bars, 500 nm. The intensity plots of the rings in ce are, respectively, shown below. (f) Average diameter of the ring-like structure formed by listed proteins. The low-high bars (horizontal) show the range of the diameter and the vertical lines indicate the mean. From the bottom to the top: n=10; 15; 28; 19; and 24. (g,h) 3D-SIM images of U2OS cells double-immunostained with antibodies against CCDC120 (green) and TCHP (g, red) or CEP164 (h, red). Scale bars, 500 nm. The intensity plots of the rings are, respectively, shown below. (i) Immuno-EM images. U2OS cells were labelled with anti-CCDC120 antibody followed by nanogold-coupled secondary antibody. Schematics of immuno-EM images are shown. Scale bar, 200 nm. (j) Schematic of CCDC120 localization at centrosomes. CCDC120 localization is shown in yellow.
Figure 2
Figure 2. ODF2 recruits CCDC120 to SDAs.
(a) Immunoblots showing depletion of ODF2 or CCDC120 by siRNA in U2OS cells. Tubulin was used as a loading control. (b) Immunostaining of CCDC120 (green) and ODF2 (red) in control-, ODF2- or CCDC120-siRNA-transfected U2OS cells. The arrows show centrosome localization. Scale bar, 1 μm. (c) Quantification of the fluorescence intensity of ODF2 and CCDC120 at the centrosomes from b (n>100 cells from three individual experiments). (d) Quantification of the fluorescence intensity of CCDC120 at the SDAs from b (n>100 cells from three individual experiments). (e) Immunostaining of CCDC120 (green) and C-Nap1 (red) in control- or ODF2-siRNA-transfected U2OS cells. Scale bar, 1 μm. (f) Quantification of the fluorescence intensity of CCDC120 at the proximal ends of the centrioles from e (n>100 cells from three individual experiments). (g) ODF2 and CCDC120 co-immunoprecipitated (IP) with anti-CCDC120 antibody (Proteintech) in lysates of HeLa cells. (h) Lysates of HEK293T cells co-overexpressing CCDC120-Flag and ODF2-HA full-length (FL) or those of the 1–60 aa deletion mutant (Δ60) were subjected to immunoprecipitation (IP) and immunoblotted (IB) with anti-HA and anti-Flag antibodies. The asterisks mark IgG bands. (i) Immunostaining of CCDC120 (red) and siRNA-resistant ODF2-HA (ResODF2-HA, green) or ResODF2-Δ60-HA (green) in ODF2-depleted U2OS cells. The arrows indicate SDA localization. Scale bar, 1 μm. (j) Quantification of the fluorescence intensity of CCDC120 at the SDAs from i (n>100 cells from three individual experiments). Data in c,d,f and j are the mean±s.e.m. Statistical significance was determined by a two-sided Student's t-test. *P<0.05, **P<0.01; NS, not significant. Unprocessed original scans of immunoblots are shown in Supplementary Fig. 7.
Figure 3
Figure 3. CCDC120 recruits CEP170 and hNinein to SDAs.
(a) Immunoblots showing depletion of hNinein, CEP170 or CCDC120 by siRNA in U2OS cells. GAPDH was used as a loading control. (b) Immunostaining of CCDC120 (red) and hNinein (blue) in control-, hNinein- and CCDC120-siRNA-transfected Centrin-2-GFP (green)-overexpressed U2OS cells. The arrows indicate centrosome localization. Scale bar, 1 μm. (c) Quantification of the fluorescence intensity of hNinein, CCDC120 and Centrin-2-GFP at centrosomes from b (n>100 cells from three individual experiments). (d) Immunostaining of CCDC120 (red) and CEP170 (blue) in control-, CEP170- or CCDC120-siRNA-transfected Centrin-2-GFP (green)-overexpressed U2OS cells. The arrow indicates centrosome localization. Scale bar, 1 μm. (e) Quantification of the fluorescence intensity of CEP170, CCDC120 and Centrin-2-GFP at centrosomes from d (n>100 cells from three individual experiments). (f) Immunoblots show the siRNA-induced decrease of CCDC120, and rescued by GFP-tagged mouse CCDC120 (GFP-mCCDC120). Tubulin was used as a loading control. (g) Immunostaining of hNinein (red, upper) or CEP170 (red, lower) in CCDC120-depleted U2OS cells after transfection with GFP-mCCDC120. Scale bar, 500 nm. (h) Quantification of the fluorescence intensity of hNinein and CEP170 at centrosomes from g (n>100 cells from three individual experiments). Data in c,e and h are the mean±s.e.m. Statistical significance was determined by a two-sided Student's t-test. *P<0.05, **P<0.01; NS, not significant. Unprocessed original scans of immunoblots are shown in Supplementary Fig. 7.
Figure 4
Figure 4. CCDC120 interacts with hNinein and CEP170 through two different coiled-coil domains.
(a) Immunoprecipitation (IP) of CCDC120 with hNinein, CEP170 and CEP164 by anti-CCDC120 antibody (Proteintech) in lysates of HeLa cells. (b) Schematic of full-length (FL) hNinein and its truncates (N, C1 and C2). CCDC120-binding ability: +, positive; −, negative. (c) Lysates of HEK293T cells co-overexpressing CCDC120-Flag and hNinein-GFP truncates were subjected to IP and immunoblotted (IB) with anti-GFP and anti-Flag antibodies. The asterisk marks IgG band. (d) Schematic of FL CEP170 and its truncates (N, C, C1 and C2). The centrosome localization region is indicated in blue. CCDC120-binding ability: +, positive; −, negative. (e,f) Lysates of HEK293T cells co-overexpressing CCDC120-HA and the indicated CEP170-Flag truncates were subjected to IP and IB with anti-HA and anti-Flag antibodies. The asterisk marks IgG band. (g) Schematic of FL CCDC120 and its truncates (N1, N2, N and C). Coiled-coil domains, blue; proline-rich domains, red. CEP170- and/or hNinein-binding activity: +, positive; −, negative. (h,i) Lysates of HEK293T cells co-overexpressing hNinein-GFP (h) or CEP170-GFP (i) with the indicated CCDC120-Flag truncates were subjected to IP and IB with anti-GFP and anti-Flag antibodies. The asterisks mark IgG band. (j) In vitro binding assay. Purified GST-tagged CCDC120 (1–320 aa) was incubated with amylose resin beads coated with MBP, MBP-hNinein-N or MBP-CEP170-C2, and immunoblotted with anti-GST antibody. (k) Immunostaining of Flag (green), hNinein (red; left) or CEP170 (red; right) in U2OS cells overexpressing Flag-tagged CCDC120 (1–320 aa). DNA was stained with 4,6-diamidino-2-phenylindole (DAPI; blue). The centrosome localizations are magnified. Scale bars, 5 μm. (l) Quantification of the fluorescence intensity of hNinein and CEP170 at centrosomes from k (n>100 cells from three individual experiments). Data are the mean±s.e.m. Statistical significance was determined by a two-sided Student's t-test. *P<0.05, **P<0.01; NS, not significant. Unprocessed original scans of immunoblots are shown in Supplementary Fig. 7.
Figure 5
Figure 5. CCDC68 interacts with CEP170 and is localized at the centrosomes.
(a) Immunoprecipitation (IP) of CCDC68 with CEP170 in lysates of HeLa cells. (b) Immunofluorescence of CCDC68 (green) and Centrin-3 (red) in U2OS cells. Scale bar, 500 nm. (cf) 3D-SIM images of Flag-CCDC68-overexpressing U2OS cells double-immunostained with antibodies against Flag (green) and hNinein (c; red), CEP170 (d, red), CCDC120 (e, red) or ODF2 (f, red). Scale bars, 500 nm. The intensity plots of the rings are, respectively, shown at right. (g) Average diameter of the ring-like structure formed by the listed proteins. The low-high bars (horizontal) show the range of the diameter and the vertical lines indicate the mean. From the bottom to the top: n=10; 36; and 28. (h) Immuno-EM images. U2OS cells were labelled with anti-CCDC68 antibody followed by nanogold-coupled secondary antibody. Schematics of immuno-EM images are shown. Scale bar, 200 nm. Supplementary Table 1 lists the CEP170-interacting proteins.
Figure 6
Figure 6. CCDC68 and CCDC120 competitively interact with CEP170.
(a) Immunostaining of CCDC68 (green) and γ-tubulin (red) in control- or ODF2-siRNA-transfected U2OS cells. Quantification of CCDC68 at the SDAs are shown at right. (b) Immunoblots show depletion of CCDC68 and CEP170 by siRNA in U2OS cells. (c) Immunostaining of CEP170 (green) and γ-tubulin (red) in control- or CCDC68-siRNA-transfected U2OS cells. Arrow, centrosome localization. Quantification of CEP170 at centrosomes are shown at right. (d) Schematic of CCDC68. FL, full-length; coiled-coil domains, blue; +, positive; −, negative. (e) Lysates of HEK293T cells co-overexpressing GFP-CEP170 and Flag-CCDC68 truncates were subjected to immunoprecipitation (IP) and immunoblotted (IB) with the indicated antibodies. Asterisks, IgG bands. (f) Immunostaining of U2OS cells overexpressing Flag-CCDC68 (101–305 aa) with anti-Flag (green) and anti-CEP170 (red) antibodies. DNA, 4,6-diamidino-2-phenylindole (DAPI; blue). Centrosomes are magnified. Quantification of CEP170 at centrosomes is shown below. (g) Lysates of HEK293T cells co-overexpressing GFP-CEP170 and Flag-CCDC68 truncates were subjected to IP and IB with anti-GFP and anti-Flag antibodies. Asterisk, IgG. (h) Lysates of HEK293T cells overexpressing Flag-CCDC120 or Flag-CCDC68 were subjected to pull-down assays with MBP-CEP170-C2 (1,015–1,460 aa). Quantification of the Flag-CCDC68 and Flag-CCDC120 band intensity (normalized to MBP-CEP170-C2) in three independent experiments are shown on the graph. (i) Quantification of the fluorescence intensity of CEP170 at centrosomes in the indicated siRNA-transfected U2OS cells. (j) Immunoblots show depletion of CCDC68 and CCDC120 by siRNA in U2OS cells. (k) Immunostaining of CCDC120 (green) and γ-tubulin (red) in control- or CCDC68-siRNA-transfected U2OS cells. Arrow, centrosome localization. Quantification of CCDC120 at centrosomes are shown at right. (l) Immunostaining of CCDC68 (green) and γ-tubulin (red) in control- or CCDC120-siRNA-transfected U2OS cells. Arrow, centrosome localization. Quantification of CCDC68 at centrosomes are shown at right. For a,c,f,i,k and l scale bars, 1 μm. Data in a,c,f,i,k and l are the mean±s.e.m. n>100 cells from three individual experiments, Statistical significance was determined by a two-sided Student's t-test. *P<0.05, **P<0.01; NS, not significant. Unprocessed original scans of immunoblots are shown in Supplementary Fig. 7.
Figure 7
Figure 7. Depletion of CCDC120 and CCDC68 impairs microtubule anchoring in interphase cells.
(a) Immunostaining of α-tubulin (green) and γ-tubulin (red) in control-, CCDC120-, CCDC120/hNinein- or CCDC120/CEP170-siRNA-transfected HeLa cells after microtubule regrowth for the indicated time periods. Scale bar, 5 μm. (b) Quantification of cells with different microtubule regrowth statuses from a (n>100 cells from three individual experiments). (c) Immunostaining of α-tubulin (green) and γ-tubulin (red) in control-, CCDC68-, CCDC68/CCDC120- or CCDC68/CEP170-siRNA-transfected HeLa cells after microtubule regrowth for the indicated time periods. Scale bar, 5 μm. (d) Quantification of cells with different microtubule regrowth statuses from c (n>100 cells from three individual experiments). Data in b and d are the mean±s.e.m. Statistical significance was determined by a two-sided Student's t-test. *P<0.05, **P<0.01; NS, not significant.
Figure 8
Figure 8. Schematic model of the roles of CCDC120 and CCDC68 in hierarchical SDA assembly in interphase cells.
(a) Schematic model of SDAs. SDA components ODF2, CCDC68, CCDC120, hNinein and CEP170 formed a ring-like structure at SDAs of the mother centrioles in interphase cells. (b) Schematic model of SDA assembly. ODF2 acts upstream to initiate SDA assembly. TCHP mediates the interaction between ODF2 and hNinein. CEP170 can be recruited by hNinein. CCDC120 is recruited to SDAs by ODF2 and recruits both CEP170 and hNinein to SDAs through two distinct domains. CCDC68 competes with CCDC120 in recruiting CEP170. (c) Schematic model of the interactions of CCDC68, CEP170, CCDC120 and hNinein, and their binding domains.

Similar articles

Cited by

References

    1. Doxsey S. Re-evaluating centrosome function. Nat. Rev. Mol. Cell Biol. 2, 688–698 (2001). - PubMed
    1. Bettencourt-Dias M. & Glover D. M. Centrosome biogenesis and function: centrosomics brings new understanding. Nat. Rev. Mol. Cell Biol. 8, 451–463 (2007). - PubMed
    1. Nigg E. A. & Raff J. W. Centrioles, centrosomes, and cilia in health and disease. Cell 139, 663–678 (2009). - PubMed
    1. Tanos B. E. et al.. Centriole distal appendages promote membrane docking, leading to cilia initiation. Genes Dev. 27, 163–168 (2013). - PMC - PubMed
    1. Piel M., Nordberg J., Euteneuer U. & Bornens M. Centrosome-dependent exit of cytokinesis in animal cells. Science 291, 1550–1553 (2001). - PubMed

Publication types

MeSH terms