. 2017 Sep;66(3):953-968.
doi: 10.1002/hep.29215. Epub 2017 Jul 18.

Pentraxin-3 modulates lipopolysaccharide-induced inflammatory response and attenuates liver injury

Affiliations

Pentraxin-3 modulates lipopolysaccharide-induced inflammatory response and attenuates liver injury

Luis Perea et al. Hepatology. 2017 Sep.

Abstract

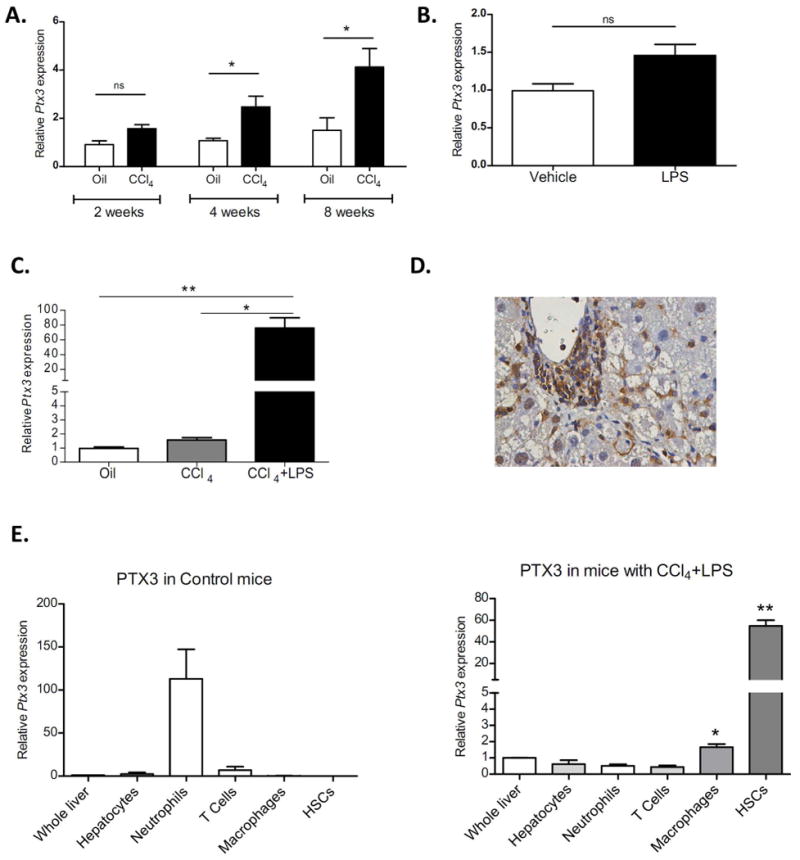
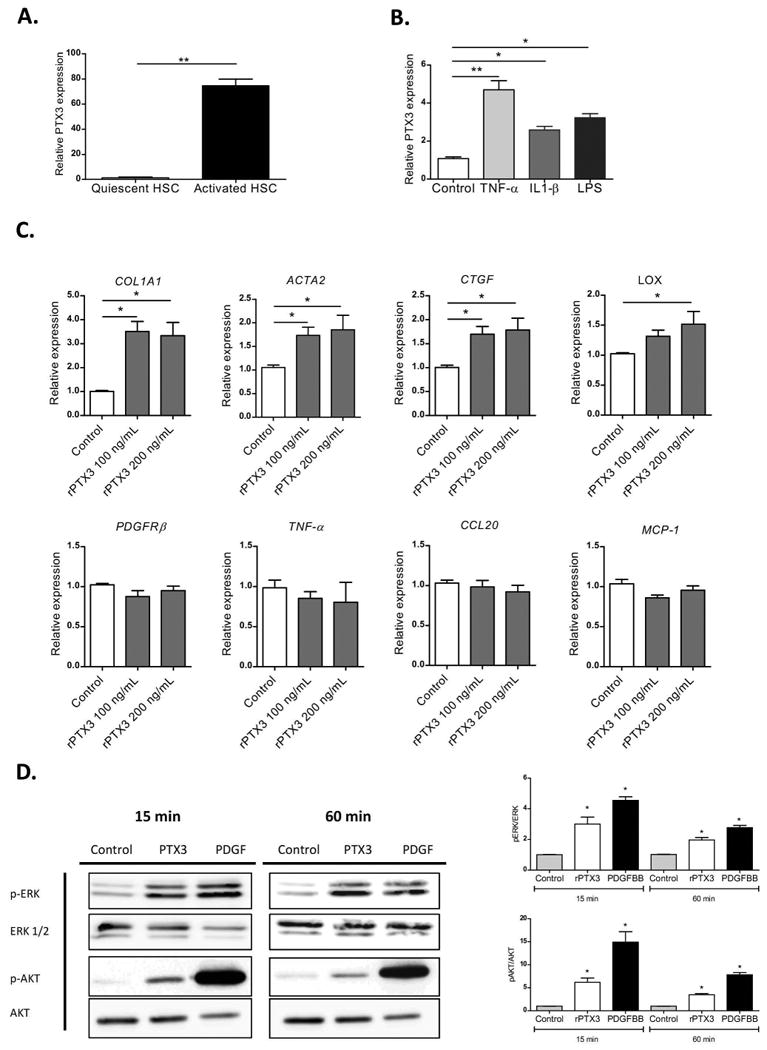
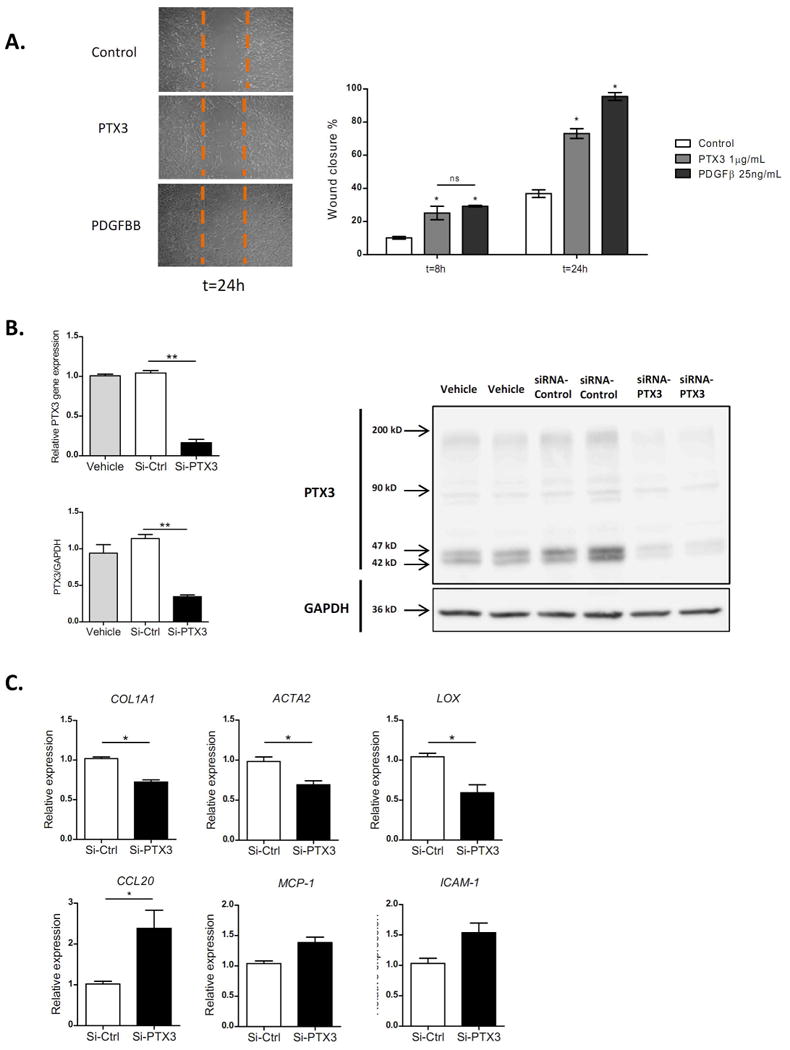
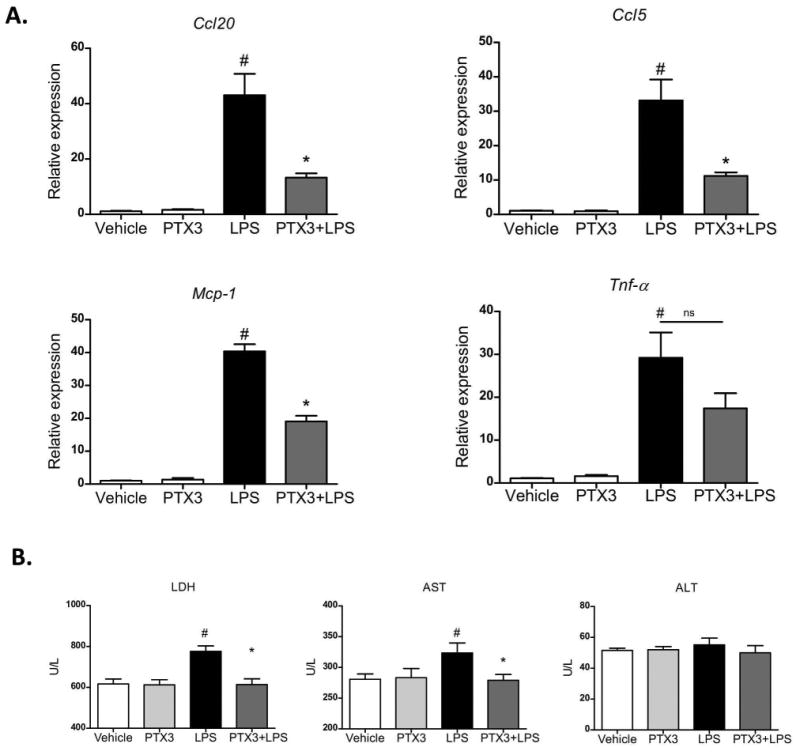
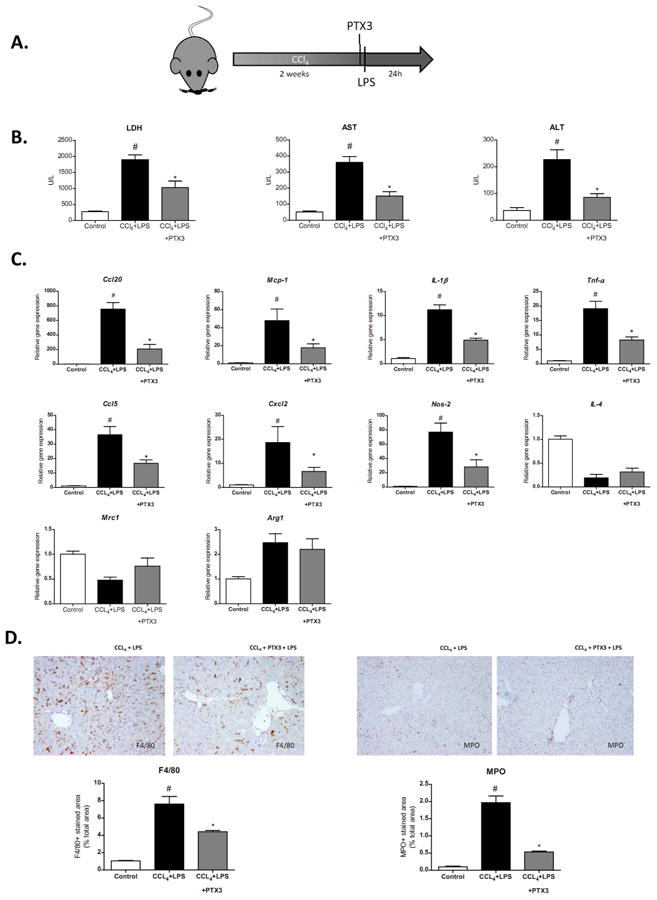
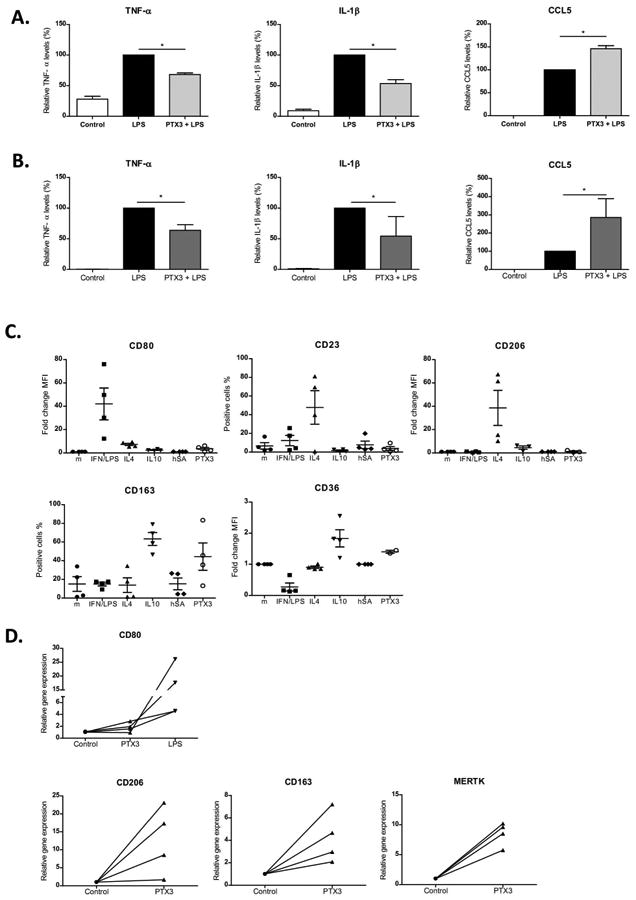
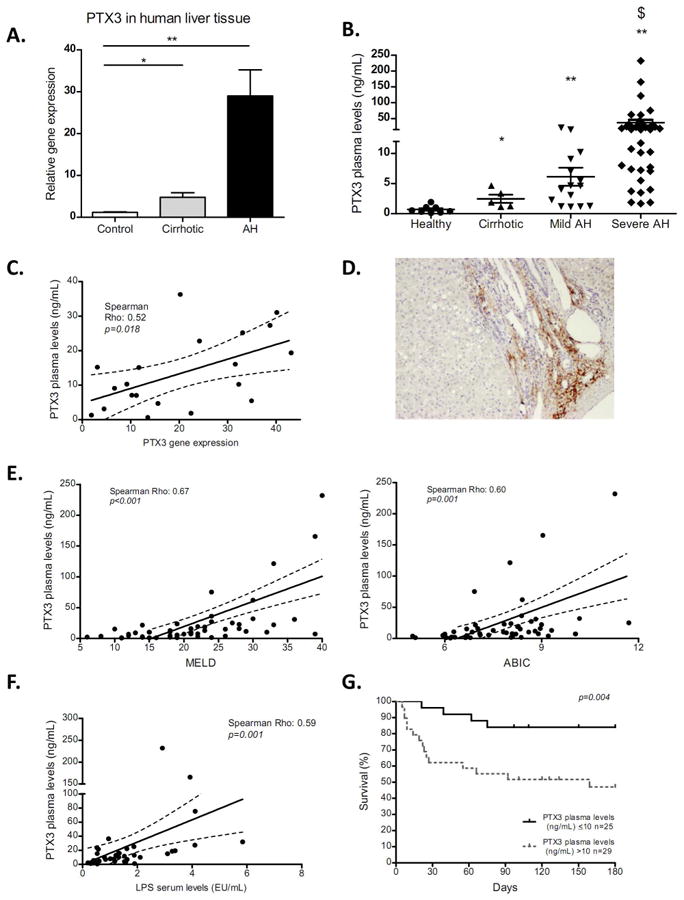
Acute-on-chronic liver injury is characterized by an important inflammatory response frequently associated with endotoxemia. In this context, acute-phase proteins such as Pentraxin-3 (PTX3) are released; however, little is known about their role in chronic liver disease. The aim of this study was to elucidate the role of PTX3 in liver injury. The role of PTX3 was evaluated in cultured human cells, liver tissue slices, and mice with acute-on-chronic liver injury. PTX3 expression was assessed in tissue and serum samples from 54 patients with alcoholic hepatitis. PTX3 expression was up-regulated in animal models of liver injury and strongly induced by lipopolysaccharide (LPS). Liver cell fractionation showed that macrophages and activated hepatic stellate cells were the main cell types expressing PTX3 in liver injury. Ex vivo and in vivo studies showed that PTX3 treatment attenuated LPS-induced liver injury, inflammation, and cell recruitment. Mechanistically, PTX3 mediated the hepatic stellate cell wound-healing response. Moreover, PTX3 modulated LPS-induced inflammation in human primary liver macrophages and peripheral monocytes by enhancing a TIR domain-containing adapter-inducing interferon-dependent response and favoring a macrophage interleukin-10-like phenotype. Additionally, hepatic and plasma PTX3 levels were increased in patients with alcoholic hepatitis, a prototypic acute-on-chronic condition; and its expression correlated with disease severity scores, endotoxemia, infections, and short-term mortality, thus suggesting that expression of PTX3 found in patients could be a counterregulatory response to injury.

Conclusion: Experimental and human evidence suggests that, in addition to being a potential biomarker for alcoholic hepatitis, PTX3 participates in the wound-healing response and attenuates LPS-induced liver injury and inflammation; therefore, administration of PTX3 could be a promising therapeutic strategy in acute-on-chronic conditions, particularly those associated with endotoxemia. (Hepatology 2017;66:953-968).


Conflict of interest statement

Disclosures: authors declare that they have no competing interests.

Figures

Figure 1
Figure 1. Ptx3 expression and cell source in experimental models of chronic and acute-on-chronic liver injury
a) Hepatic gene expression of Ptx3 in mice treated with carbon tetrachloride (CCl4) during two weeks (n=4), four weeks (n=6) and eight weeks (n=4) (*p<0,05 compared with their appropriate oil treated control group mice). b) Hepatic expression of PTX3 in mice treated with LPS (10mg/Kg) (n=4) or vehicle (DPBS) (n=4). c) Hepatic gene expression of Ptx3 in mice treated with oil+vehicle, CCL4 and CCL4+LPS (n=6 per group) (**p<0,01 compared with control and CCL4 mice groups). d) Immunostaining of liver sections (x200 magnification) from CCL4+LPS treated mice show that PTX3 is expressed in inflammatory and non-parenchymal cells. e) Ptx3 gene expression in FACS-sorted hepatic cells population by immunoselection: neutrophils (Ly6G+), macrophages (F4/80+), T cells (CD3+), hepatocytes, and HSC (VitA+). Hepatic cells were compared with whole liver of oil control or CCl4+LPS respectively (*p<0,05; **p<0,01 compared with whole liver) (hepatic cells sorted from mice n=3).
Figure 2
Figure 2. Expression and role of PTX3 in hepatic stellate cells
a) PTX3 gene expression in freshly isolated human quiescent HSC and after activation in vitro (n=4) (**p<0,01). b) Induction of PTX3 by pro-inflammatory mediators: cultured HSC incubated for 24h with tumor necrosis factor α (TNF-α) 20 ng/mL and interleukin 1β (IL-1β) 20 ng/mL and lipopolysaccharide (LPS) 100 ng/mL, (**p<0,01; *p<0,05 compared with control). c) Expression of HSC markers of activation, pro-inflammatory and pro-fibrogenic mediators in HSC after stimulation with rPTX3 100 ng/mL and 200 ng/mL. (*p<0,05 compared with control). d) Representative western blot of phosphorylated and total ERK and AKT in HSC stimulated with rPTX3 200 ng/mL and platelet derived growth factor (PDGFBB) (25 ng/mL) as positive control.
Figure 3
Figure 3. Biological effect of PTX3 in hepatic stellate cells
a) Representative pictures of Wound-healing assay (x200 magnification), with a dotted line indicating the wound size at time 0. Effect of PTX3 on HSC wound-healing response, incubated both rPTX3 (1 μg/mL) and PDGFBB (25 ng/mL). Wound closure is expressed as wound closure percentage with respect to time 0 after scratch (*p<0.01). b) Evaluation of siRNA efficiency. Expression of PTX3 mRNA in HSC transfected with siRNA (**p<0,001 compared with siRNA-Control). Representative image of western blot of three independent experiments, siRNA-PTX3 decreased PTX3 protein expression at predicted molecular weight (42-47 kD) and at multimeric forms of PTX3 with a molecular ranging from 42 to 200 kD. Proteins from total cell lysate of HSC treated for 48 hours with vehicle, siRNA negative Control and siRNA for PTX3. c) Expression of HSC activation markers in HSC transfected with siRNA-PTX3 and si-control for 24h.
Figure 4
Figure 4. Effect of PTX3 in high precision-cut liver slices
Liver slices from mice treated with CCl4 were incubated with or without PTX3 and stimulated with LPS. a) Gene expression of Ccl20, Ccl5, Mcp-1 and Tnf-α in liver slices after incubation for 1 hour with rPTX3 (500 ng/mL) (n=4) or vehicle with or without addition of LPS (25 μg/mL) (n=4) for an additional 6 hours. #p<0,05 compared with control; *p<0,05 compared with LPS induction. b) Tissue culture supernatant levels of lactate dehydrogenase (LDH), aspartate aminotransferase (AST), and alanine aminotransferase (ALT) in (n=4) from cultures of liver slices pre-incubated with rPTX3 or vehicle for 1 hour before LPS stimulation for 6 hours #p<0,05 compared with control; *p<0,05 compare with liver slices treated with LPS.
Figure 5
Figure 5. Effect of PTX3 treatment in acute-on-chronic experimental model
a) Scheme of experimental procedure. CCl4 treated mice were treated with rPTX3 two hours before the infusion of LPS. Mice were sacrificed 24h after LPS infusion. b) Lactate dehydrogenase (LDH), aspartate aminotransferase (AST) and alanine aminotransferase (ALT) serum levels in control mice and in mice treated with CCl4+LPS (n=5) or CCl4+rPTX3+LPS (n=5) #p<0,01 compared with control group; *p<0,05 compared with CCl4+LPS treated group. c) Hepatic gene expression of Ccl20, Mcp-1, IL-1β, Tnf-α, Ccl5, Cxcl2, Nos-2, IL-4, Mrc1, and Arg1 in mice treated with CCl4+LPS (2,5mg/kg) (n=5) or CCl4+rPTX3 (5mg/kg)+LPS (n=5) #p<0,05 compared with control mice group; *p<0,05 compared with CCl4+LPS treated mice. d) Representative pictures of F4/80 and myeloperoxidase (MPO) immunostaining of liver sections of mice treated with CCl4+LPS or CCl4+rPTX3+LPS (×200 magnification). The graphs show quantification of the percentage of positive stained area.
Figure 6
Figure 6. Effect of PTX3 on monocytes and macrophages
Peripheral blood monocytes isolated from healthy donors and human liver macrophages were incubated with rPTX3 followed by stimulation with LPS. a) human monocytes and b) human liver macrophages relative TNF-α, IL-1β and CCL5 levels in supernatant in the presence of LPS (10 ng/mL) and rPTX3 (1 μg/mL) compared with LPS (10 ng/mL) alone; n≥3 donors and patients. For normalization, cytokine production induced by stimulation with LPS of each experiment was set at 100; and relative cytokine production in the presence of rPTX3 or controls was calculated (*p<0,05). Peripheral blood monocytes isolated from four healthy donors were incubated (106 cells/well) during 3 days with INF/LPS (50/100 ng/mL), IL4 (40 ng/mL), IL10 (50 ng/mL), human albumin (hSA, 1 μg/mL) and rPTX3 (1 μg/mL) separately in RPMI with 5% FBS. c) Expression of macrophage polarization cell markers (CD80, CD23, CD206, CD163 and CD36) analyzed by flow cytometry (n=4). d) Human liver macrophages isolated from patients were incubated with rPTX3 (1 μg/mL). Gene expression of macrophages cell markers (CD80, CD206, CD163, Mertk) analyzed 24h after stimulation by real time PCR (n=4). As a positive control of CD80 (M1) induction liver macrophages were incubated with LPS (10 ng/mL).
Figure 7
Figure 7. PTX3 expression and correlation with clinical parameters in patients with liver disease
a) PTX3 hepatic gene expression in cirrhotic alcoholic liver disease patients (Cirrhotic) (n=5), patients with alcoholic hepatitis (AH) (n=30) compared with healthy controls (n=5) (*p<0,05; **p<0,01). b) PTX3 plasma levels were significantly increased in patients with compensated cirrhosis (n=5) and both mild (n=15) and severe AH (n=39), compare with healthy patients (n=8); *p<0,05 compare with controls; **p<0,01 compare with controls; $ p<0,01 compare with other groups. c) correlation of PTX3 plasma levels and hepatic gene expression in patients with AH (n=23). d) Representative picture of PTX3 immunohistochemistry in liver sections of cirrhotic alcoholic liver disease patients (x200 magnification). Correlation of PTX3 plasma level with disease severity score, e) Model for End-stage Liver Disease (MELD) score, f) Age, serum Bilirubin, INR, and serum Creatinine (ABIC) score in patients with AH (n=54). g) Correlation of LPS serum level and PTX3 plasma levels in patients with AH (n=40). h) Kaplan-Meier analysis showing prognostic 180 day mortality based on PTX3 plasma level in patients with AH (n=54). The cut-off with better sensitivity and specificity was identified as 10 ng/mL (p=0,004). Severe AH was defined as a MELD >21 and or ABIC >8.99.

References

    1. Bataller R, Brenner D. Liver fibrosis. J Clin Invest. 2005;115:209–218. - PMC - PubMed
    1. Fujimoto M, Uemura M, Nakatani Y, Tsujita S, Hoppo K, Tamagawa T, et al. Plasma endotoxin and serum cytokine levels in patients with alcoholic hepatitis: relation to severity of liver disturbance. Alcohol Clin Exp Res [Internet] 2000;24:48S–54S. Available from: http://www.ncbi.nlm.nih.gov/pubmed/10803780. - PubMed
    1. Rao R. Endotoxemia and gut barrier dysfunction in alcoholic liver disease. Hepatology. 2009;50:638–644. - PMC - PubMed
    1. Michelena J, Altamirano J, Abraldes JG, Affò S, Morales-Ibanez O, Sancho-Bru P, et al. Systemic inflammatory response and serum lipopolysaccharide levels predict multiple organ failure and death in alcoholic hepatitis. Hepatology. 2015;62:762–772. - PMC - PubMed
    1. Arvaniti V, D'Amico G, Fede G, Manousou P, Tsochatzis E, Pleguezuelo M, et al. Infections in patients with cirrhosis increase mortality four-fold and should be used in determining prognosis. Gastroenterology [Internet] 2010;139:1246–1256.e5. Available from: http://dx.doi.org/10.1053/j.gastro.2010.06.019. - DOI - PubMed

Publication types

MeSH terms