. 2017 May 23;8(21):34844-34857.
doi: 10.18632/oncotarget.16758.

Multi-omics study revealing the complexity and spatial heterogeneity of tumor-infiltrating lymphocytes in primary liver carcinoma

Affiliations

Multi-omics study revealing the complexity and spatial heterogeneity of tumor-infiltrating lymphocytes in primary liver carcinoma

Lijun Shi et al. Oncotarget. .

Abstract

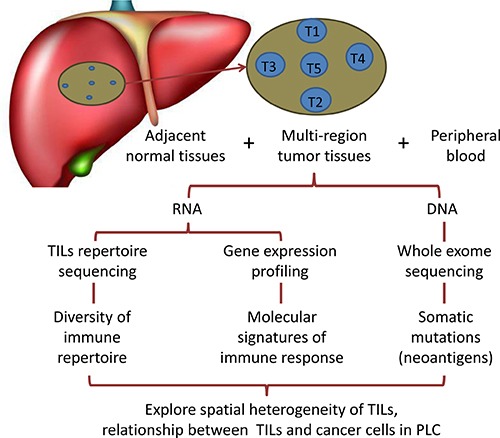
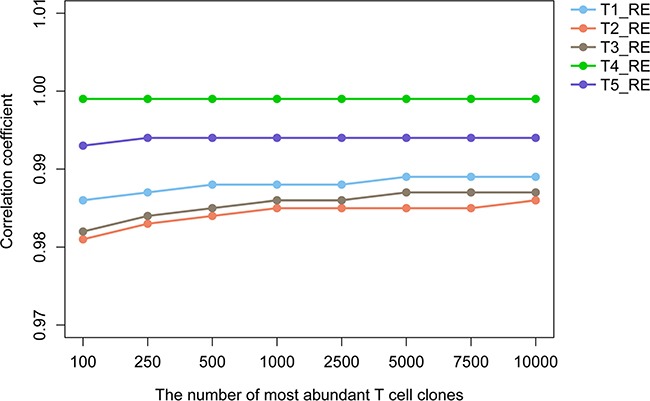
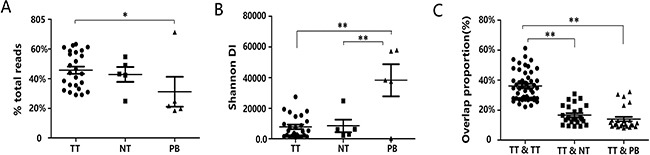
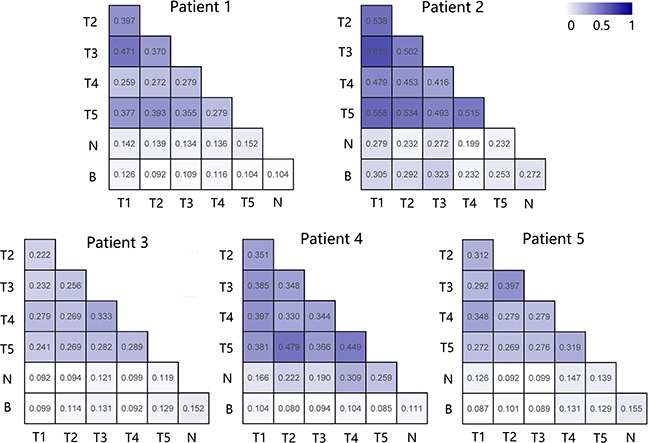
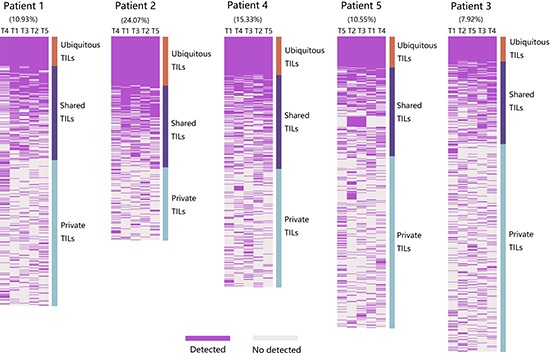
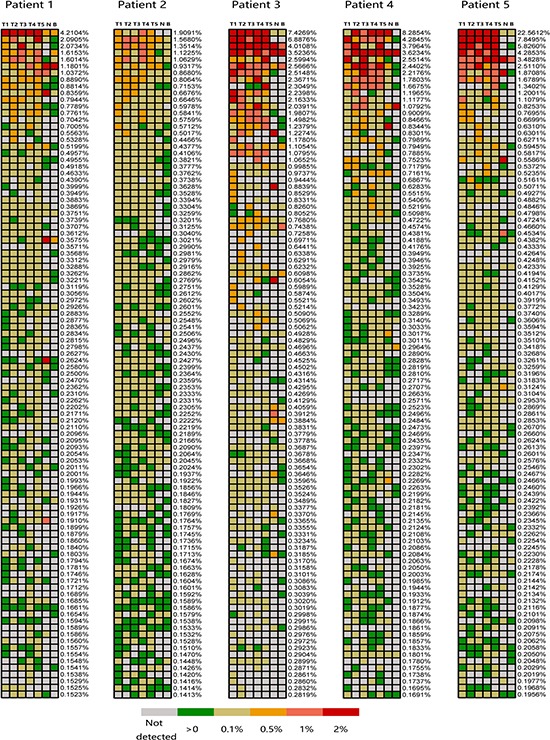
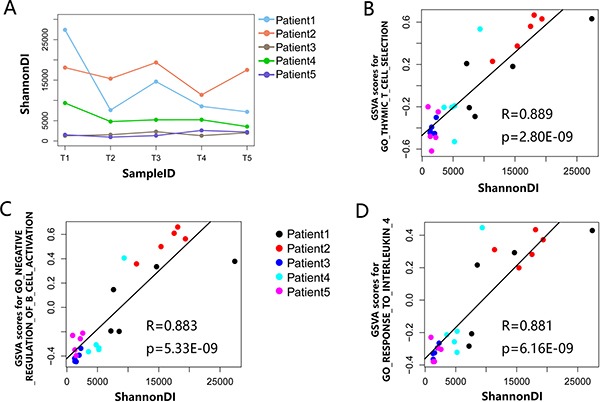
Intratumoral heterogeneity has been revealed in primary liver carcinoma (PLC). However, spatial heterogeneity of tumor-infiltrating lymphocytes (TILs), which reflects one dimension of a tumor's spatial heterogeneity, and the relationship between TIL diversity, local immune response and mutation burden remain unexplored in PLC. Therefore, we performed immune repertoire sequencing, gene expression profiling analysis and whole-exome sequencing in parallel on five regions of each tumor and on matched adjacent normal tissues and peripheral blood from five PLC patients. A significantly higher cumulative frequency of the top 250 most abundant TIL clones was observed in tumors than in peripheral blood. Besides, overlap rates of T cell receptor (TCR) repertoire for intratumor comparisons, significant higher than those for tumor-adjacent normal tissue comparisons and tumor-blood comparisons, which provide evidence for antigen-driven clonal expansion in PLC. Analysis of the percentage of ubiquitous TCR sequences, regional frequencies of each clone and TIL diversity suggested TIL clones varying between distinct regions of the same tumor, which indicated weak TCR repertoire similarity within a single tumor. Furthermore, correlation analysis revealed that TIL diversity significantly correlated with the expression of immune response genes rather than the mutation load. We conclude that intratumoural T-cell clones are spatially heterogeneous, which can lead to underestimate the immune profile of PLC from a single biopsy sample and may present challenge to adoptive cell therapy using autologous TILs. TIL diversity provides a reasonable explanation for the degree of immune response, implied TIL diversity can serve as a surrogate marker to monitor the effect of immunotherapy.

Keywords: gene expression profiling; next generation sequencing; somatic mutation; spatial heterogeneity; tumor-infiltrating lymphocytes.


Conflict of interest statement

CONFLICTS OF INTEREST

The authors have declared no competing interests.

Figures

Figure 1
Figure 1. Schematic diagram of study design
The brown circle on behalf of the lesions, and the position of blue circles represent spatial distribution of five tumor specimens (T1–T5) from the same tumor.
Figure 2
Figure 2. The correlation coefficient of the duplicate sample of each tumor region from patient 4
The y-axis shows the specific numerical of correlation coefficient, x-axis shows the group with various amounts of abundant T cell clones.
Figure 3
Figure 3. The distribution characteristics of the TCRβ repertoires in tumor tissues, adjacent normal tissues and peripheral blood
(A) The cumulative frequency of the TOP250 in tumor tissues, adjacent normal tissues and peripheral blood. Data points represent the cumulative frequency of the TOP250 of each sample from five patients, and bars depict the mean (± SEM) of the groups. Differences between groups were compared using one-way ANOVA. *P = 0.039. TT, NT and PB represent tumor tissues, adjacent normal tissues and peripheral blood, respectively. (B) Data show the distribution of TCR diversity by measuring the shannonDI. Each dot represents the shannonDI of each sample, and bars show the mean (± SEM) of the groups. Differences between groups were compared using one-way ANOVA. **P < 0.001. (C) Data show the overlap of clonotypes between sample groups, TT and TT, TT and NT, TT and PB. Each dot represents the overlap rate between any two samples, and bars show the mean (± SEM) of the groups. Differences between groups were compared using one-way ANOVA. **P < 0.001.
Figure 4
Figure 4. Comparison of the pairwise overlap of TCRβ repertoire between different samples of each patient
For each patient we computed pairwise overlaps among all samples, the high overlap rate obtain a darker shade of blue in the heat map. Sample names T, N and B represent tumor tissues, adjacent normal tissues and peripheral blood, respectively.
Figure 5
Figure 5. Spatial heterogeneity of TIL clones in five PLC patients
Heat maps show the regional distribution of TOP250 from all tumor samples of each patient. T cell clones identified in its original regions showed purple, otherwise light grey. Column close to heat map show three categories of TIL populations: TILs present in all regions were defined as ubiquitous (salmon), in more than one but not all regions were considered as shared (modena) and in one region was regarded as private (light-blue). Both shared and private TILs were heterogeneous. Patient identification is showed on the top of figure. Then, the percentage of ubiquitous TIL clones of each patient is indicated. Next, lesion names in the form of regional identification.
Figure 6
Figure 6. Regional frequencies of the 100 most abundant T cell clones in different samples of the five PLC patients
The 100 most abundant TIL clones showed in heat maps identified as the highest regional frequencies throughout five regions of each tumor. Frequencies that listed on the right of each heat map represent the corresponding T cell clones. The color of cell check indicates different frequency of T cell clone, the corresponding relationship between color and clone abundances are indicated by figure legend presents on the bottom of figure. Patient identifications and lesion names are showed on the top of figure.
Figure 7
Figure 7. The relationship between local TCR clone diversity and the immune status
(A) The ShannonDI for each tumor sample of five PLC patients. (BD) Correlations between ShannonDI values and GSVA score of three GO gene sets list in Table 2 that achieved the largest correlation coefficient in the tumor samples of five PLC patients. The best-fit lines are indicated on each panel, each dot represents an individual tumor region.

References

    1. Ferlay J, Soerjomataram I, Dikshit R, Eser S, Mathers C, Rebelo M, Parkin DM, Forman D, Bray F. Cancer incidence and mortality worldwide: sources, methods and major patterns in GLOBOCAN 2012. Int J Cancer. 2015;136:E359–E86. - PubMed
    1. Chen W, Zheng R, Baade PD, Zhang S, Zeng H, Bray F, Jemal A, Yu XQ, He J. Cancer statistics in China, 2015. CA Cancer J Clin. 2016;66:115–132. - PubMed
    1. McGlynn KA, Petrick JL, London WT. Global epidemiology of hepatocellular carcinoma: an emphasis on demographic and regional variability. Clin Liver Dis. 2015;19:223–238. - PMC - PubMed
    1. Kishi Y, Hasegawa K, Sugawara Y, Kokudo N. Hepatocellular carcinoma: current management and future development-improved outcomes with surgical resection. Int J Hepatol. 2011;2011:728103. - PMC - PubMed
    1. Poon RT, Fan ST, Lo CM, Liu CL, Wong J. Long-term survival and pattern of recurrence after resection of small hepatocellular carcinoma in patients with preserved liver function: implications for a strategy of salvage transplantation. Ann Surg. 2002;235:373–382. - PMC - PubMed

Substances