. 2017 Apr 20;2(8):e92281.
doi: 10.1172/jci.insight.92281.

Cannabinoid CB1 receptor overactivity contributes to the pathogenesis of idiopathic pulmonary fibrosis

Affiliations

Cannabinoid CB1 receptor overactivity contributes to the pathogenesis of idiopathic pulmonary fibrosis

Resat Cinar et al. JCI Insight. .

Abstract

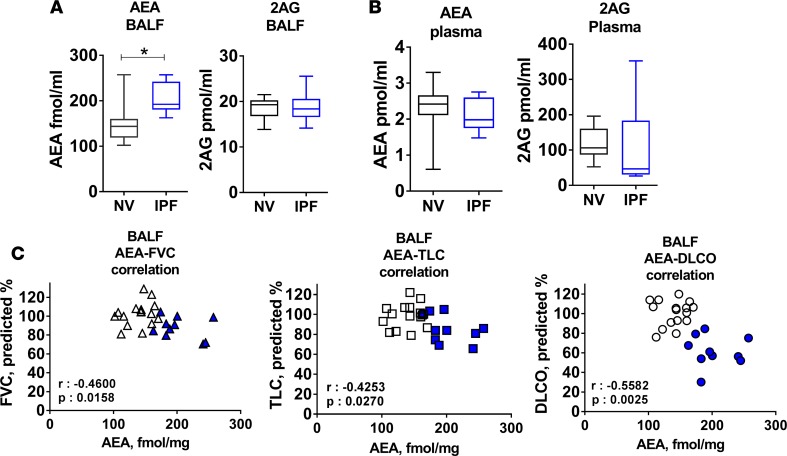
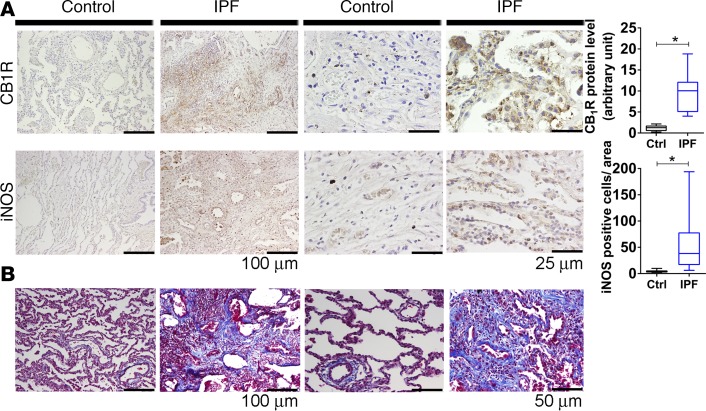
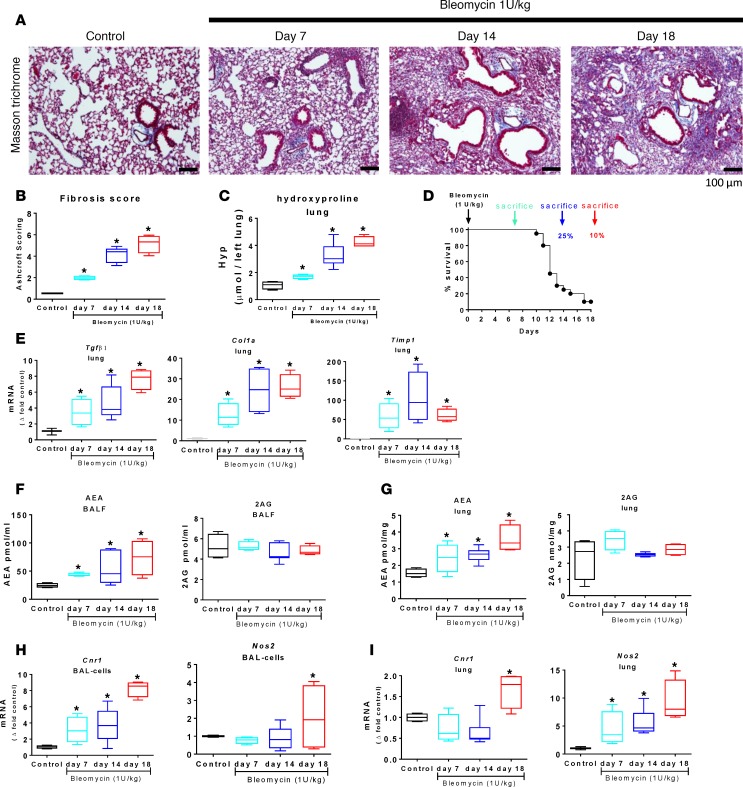
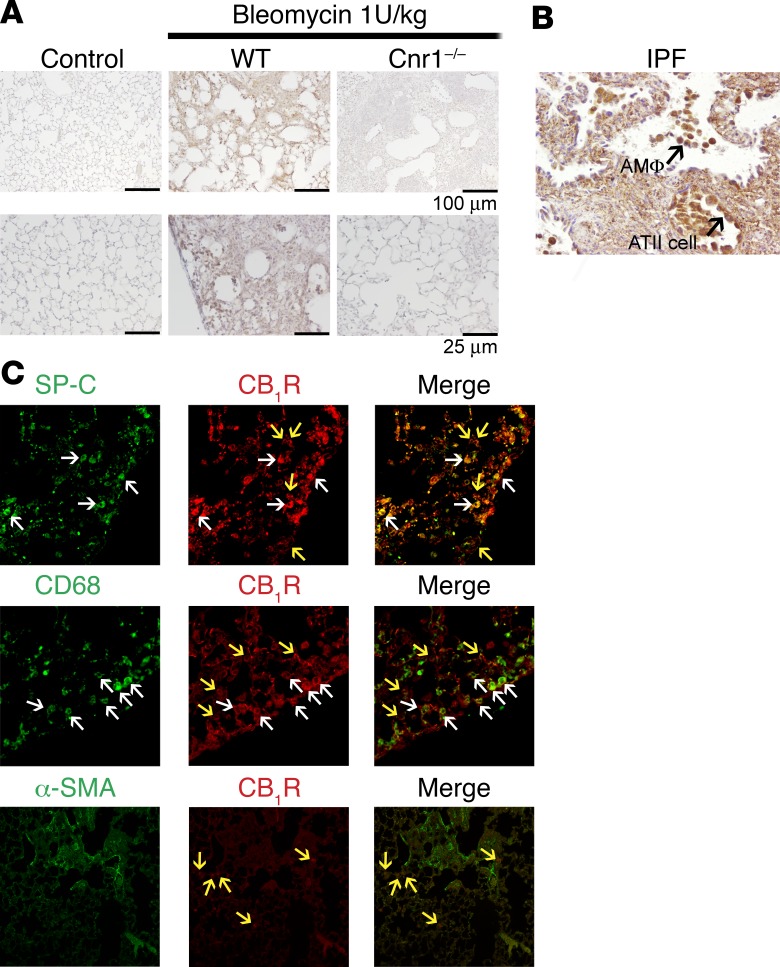
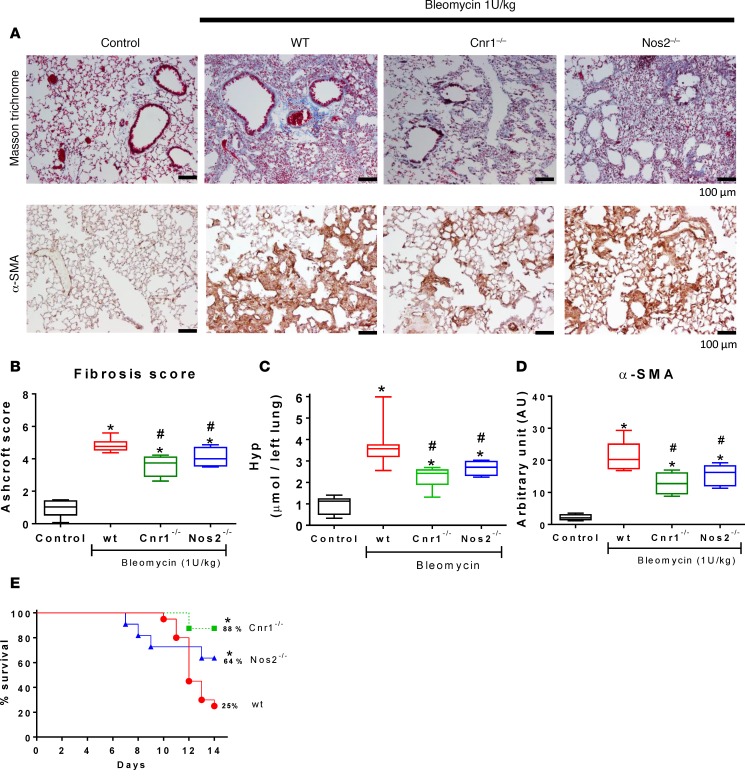
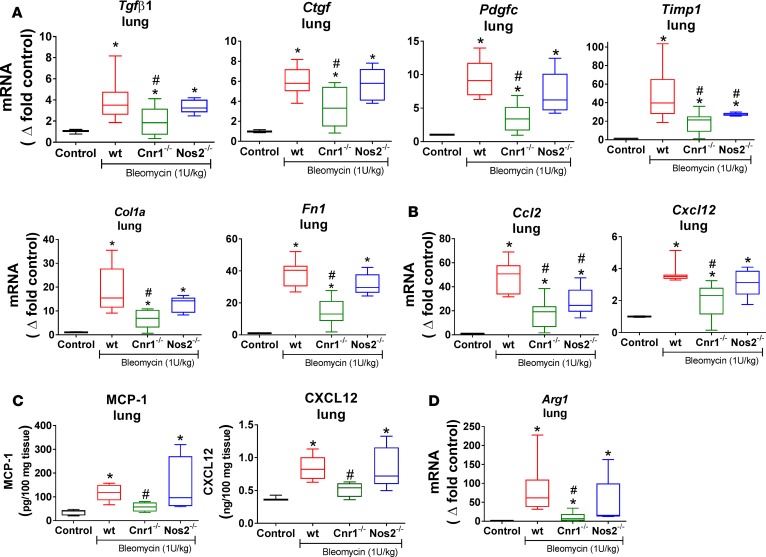
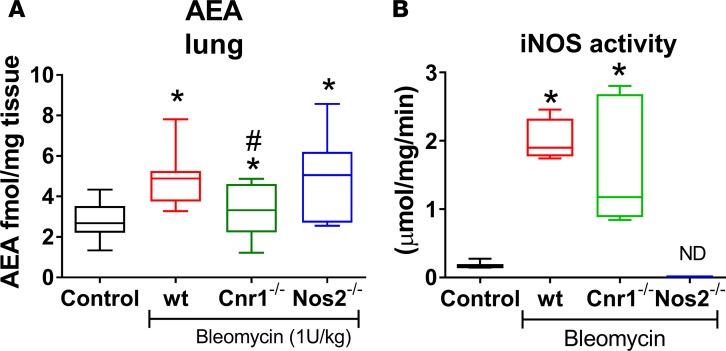
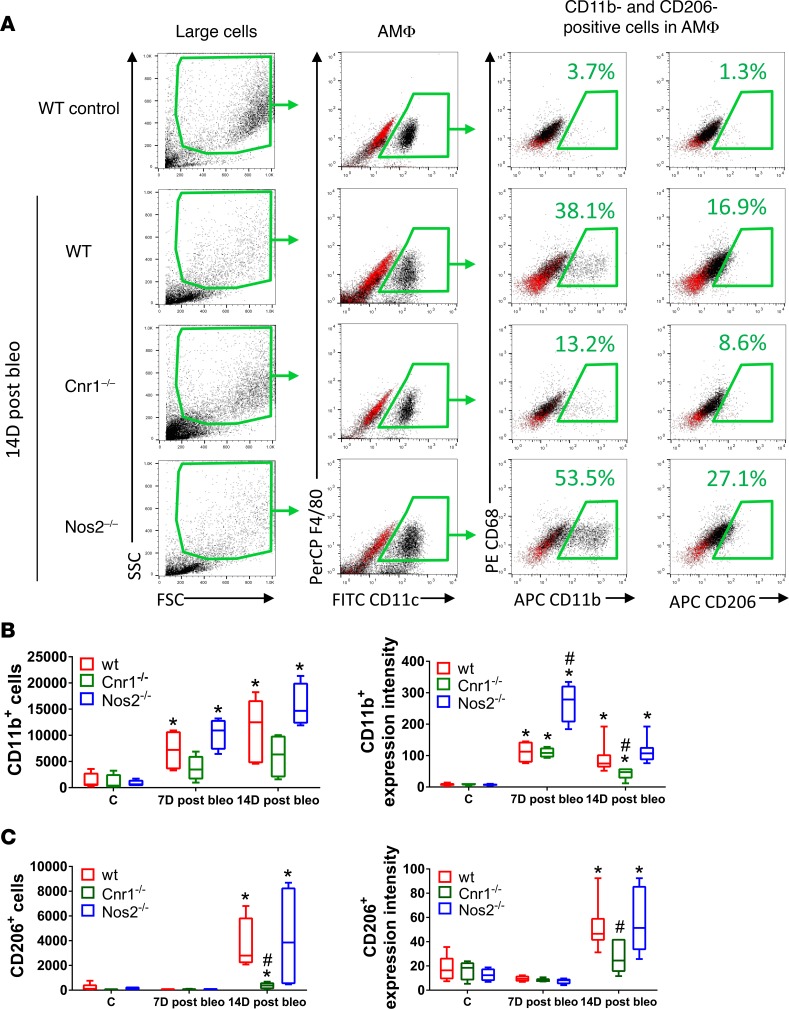
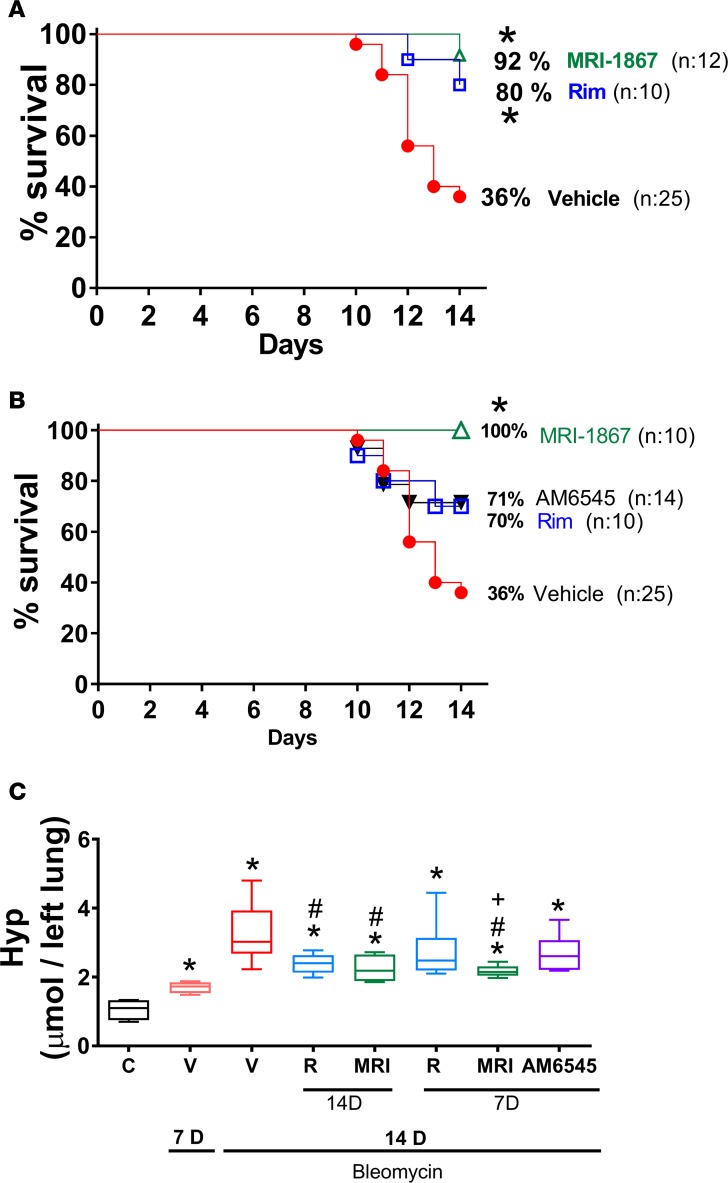
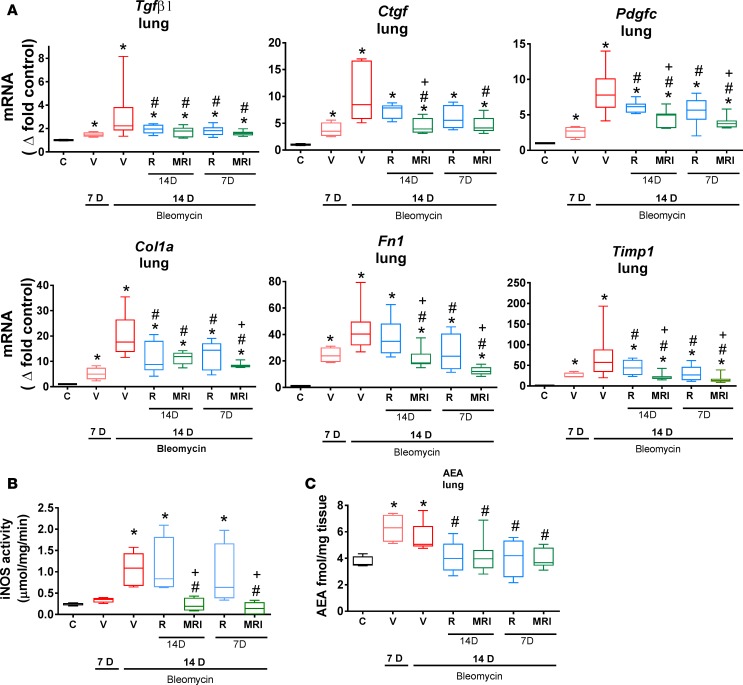
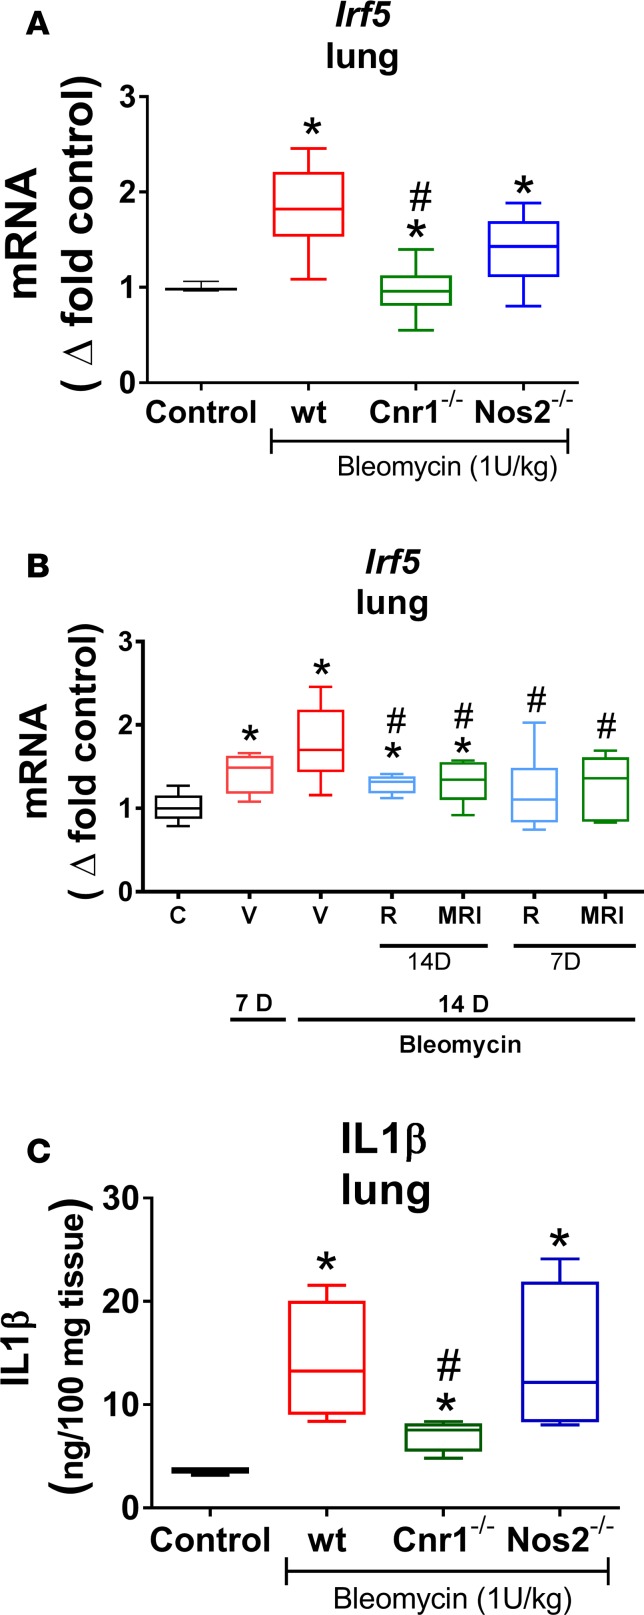
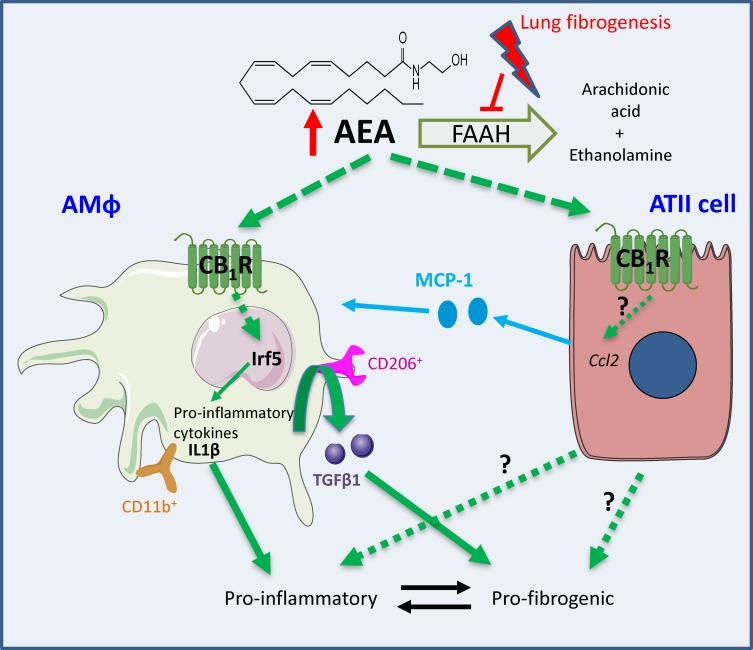
Idiopathic pulmonary fibrosis (IPF) is a life-threatening disease without effective treatment, highlighting the need for identifying new targets and treatment modalities. The pathogenesis of IPF is complex, and engaging multiple targets simultaneously might improve therapeutic efficacy. To assess the role of the endocannabinoid/cannabinoid receptor 1 (endocannabinoid/CB1R) system in IPF and its interaction with inducible nitric oxide synthase (iNOS) as dual therapeutic targets, we analyzed lung fibrosis and the status of the endocannabinoid/CB1R system and iNOS in mice with bleomycin-induced pulmonary fibrosis (PF) and in lung tissue and bronchoalveolar lavage fluid (BALF) from patients with IPF, as well as controls. In addition, we investigated the antifibrotic efficacy in the mouse PF model of an orally bioavailable and peripherally restricted CB1R/iNOS hybrid inhibitor. We report that increased activity of the endocannabinoid/CB1R system parallels disease progression in the lungs of patients with idiopathic PF and in mice with bleomycin-induced PF and is associated with increased tissue levels of interferon regulatory factor-5. Furthermore, we demonstrate that simultaneous engagement of the secondary target iNOS by the hybrid CB1R/iNOS inhibitor has greater antifibrotic efficacy than inhibition of CB1R alone. This hybrid antagonist also arrests the progression of established fibrosis in mice, thus making it a viable candidate for future translational studies in IPF.

Keywords: Pulmonology.


Conflict of interest statement

Conflict of interest: R. Cinar, M.R. Iyer, and G. Kunos are listed as coinventors on a US patent application (PCT/US2013/069686) covering MRI-1867 and related compounds.

Figures

Figure 1
Figure 1. Negative correlation between anandamide content of BALF and pulmonary function tests in IPF patients.
Anandamide (AEA) and 2-AG levels in BALF (A) and plasma samples (B) from normal volunteers (NV) and patients with idiopathic pulmonary fibrosis (IPF). Correlation with pulmonary function tests (PFT) and AEA in BALF in the same group (C). NV, white symbols; IPF, blue symbols. Correlation was calculated by using Pearson correlation coefficients. FVC, forced vital capacity; TLC, total lung capacity; DLCO, diffusion capacity. Data represent box-and-whisker plots; horizontal lines represent the median and 25th to 75th percentiles, and whiskers represent minimum and maximum values from 10 NV and 10 IPF subjects for plasma and 17 NV and 10 IPF subjects for BALF and PFT. Differences between the two groups were analyzed by t test. *P < 0.05 indicates significant difference relative to NV group.
Figure 2
Figure 2. Increased CB1R and iNOS protein in lung samples from IPF patients.
CB1R and iNOS immunohistochemistry in human lung tissue sections from idiopathic pulmonary fibrosis (IPF) patients and controls without fibrotic lung disease (A). Fibrosis visualized by Masson trichrome–stained sections from the same subjects (B). Data represent box-and-whisker plots; horizontal lines represent the median and 25th to 75th percentiles, and whiskers represent minimum and maximum values from 5 normal volunteers or 10 IPF subjects. Data were analyzed by t test. *P < 0.05 indicates significant difference relative to control group. Scale bar: 25 μm (A, right columns); 50 μm (B, right columns); 100 μm (A and B, left columns).
Figure 3
Figure 3. Increased tissue levels of anandamide, CB1R, and iNOS during progression of bleomycin-induced fibrosis in mice.
Masson trichrome staining (A), fibrosis grade assessed by Ashcroft scoring (B) or by lung hydroxyproline content (C), and survival curve (D). Gene expression of fibrosis markers Tgfβ1, collagen 1a (Col1a), and tissue inhibitor of metalloproteinase-1 (Timp1) (E). Endocannabinoid levels in BALF (F) and lung (G). Gene expression of Cnr1 and Nos2 in BALF cells (H) and lung (I). Data represent box-and-whisker plots; horizontal lines represent the median and 25th to 75th percentiles, and whiskers represent minimum and maximum values from 4 (control), 5 (day 7), 10 (day 14), and 4 mice (day 18). Data were analyzed by 1-way ANOVA followed by Dunnett’s multiple comparisons test. *P < 0.05 indicates significant difference from control group. Scale bar: 100 μm.
Figure 4
Figure 4. Cellular localization of CB1Rs after bleomycin induction in fibrotic mouse lung.
CB1R immunohistochemistry in mouse lung tissue sections from WT control, WT BL-PF, and Cnr1–/– BL-PF at 14 days after bleomycin challenge (A). CB1R immunohistochemistry in human idiopathic pulmonary fibrosis (IPF) lung tissue, showing CB1R expression in alveolar macrophages (AMΦ) and alveolar epithelial type 2 (ATII) cells. Original magnification: ×40 (B). CB1R/SP-C, CB1R/CD68, and CB1R/α-SMA double immunohistochemistry and imaging by confocal microscopy in lung tissue from WT BL-PF mice. Colocalization marked by white arrows, with distinct localization marked in yellow. Original magnification, ×40 (C). Scale bar: 25 μm (A, bottom row); 100 μm (A, top row).
Figure 5
Figure 5. Effect of Cnr1 and Nos2 gene deletion on fibrosis development and survival in mice.
Collagen deposition and myofibroblast activation in lung visualized by Masson trichrome staining and α-SMA immunostaining at 14 days after bleomycin challenge (A), as quantified by Ashcroft scoring (B), hydroxyproline (hyp) content (C), and α-SMA staining (D). Survival curve of mice after bleomycin challenge. Survival by day 18 was analyzed by using log-rank (Mantel-Cox) test comparing WT, Cnr1–/–, and Nos2–/– mice (E). Data represent box-and-whisker plots; horizontal lines represent the median and 25th to 75th percentiles, and whiskers represent minimum and maximum values from n = 5 (control), 20 (WT), 9 (Cnr1–/–), and 11 (Nos2–/–) mice. Data were analyzed by 1-way ANOVA followed by Dunnett’s multiple comparisons test. *P < 0.05 indicates significant difference from control group in WT. #P < 0.05 indicates significant effect of gene deletion relative to WT in the bleomycin-challenged group. Scale bar: 100 μm.
Figure 6
Figure 6. Effect of Cnr1 and Nos2 gene deletion on the expression in the lung of fibrogenic markers.
Tgfβ1, connective tissue growth factor (Ctgf), platelet-derived growth factor c (Pdgfc), collagen 1a (Col1a), fibronectin 1 (Fn1), and tissue inhibitor of metalloproteinase-1 (Timp1) (A). Chemokine C-C motif ligand 2 (Ccl2) and C-X-X motif chemokine 12 (Cxcl12) (B). Protein levels of MCP-1 and CXCL12 (C) and gene expression of arginase 1 (Arg1) (D) in lung tissue at 14 days after bleomycin challenge from control mice and bleomycin-treated WT, Cnr1–/–, and Nos2–/– mice. Data represent box-and-whisker plots; horizontal lines represent the median and 25th to 75th percentiles, and whiskers represent minimum and maximum values from n = 5 (control), 20 (WT), 9 (Cnr1–/–), and 11 (Nos2–/–) mice. Data were analyzed by 1-way ANOVA followed by Dunnett’s multiple comparisons test. *P < 0.05 indicates significant difference from control group. #P < 0.05 indicates significant effect of gene deletion relative to WT in the bleomycin-challenged group.
Figure 7
Figure 7. Distinct pattern of activation of iNOS and AEA in pulmonary fibrosis.
AEA levels (A) and iNOS enzyme activity (B) in lung tissue at 14 days after bleomycin challenge from control mice and bleomycin-treated WT, Cnr1–/–, and Nos2–/– mice. Data represent box-and-whisker plots; horizontal lines represent the median and 25th to 75th percentiles, and whiskers represent minimum and maximum values from n = 5 (control), 20 (WT), 9 (Cnr1–/–), and 11 (Nos2–/–) mice. Data were analyzed by 1-way ANOVA followed by Dunnett’s multiple comparisons test. *P < 0.05 indicates significant difference from control group. #P < 0.05 indicates significant effect of gene deletion relative to WT in the bleomycin-challenged group.
Figure 8
Figure 8. Effect of Cnr1 and Nos2 gene deletion on alveolar macrophage activation status for CD11b and CD206 expression.
Gating strategy in flow cytometry experiment, with representative histograms for defining CD11b+ and CD206+ cells in the alveolar macrophage (AMΦ) population using BAL cells from WT, Cnr1–/–, and Nos2–/– mice from either the control group or mice after 14-day bleomycin treatment (14D post bleo) (A). CD11b+ and CD206+ cells were defined by gating to exclude >99.5% of unstained, autofluorescent cells. Unstained cells are shown as red dots. Cell number and surface expression intensity of CD11b+ cells (B) and CD206+ cells (C), isolated from control mice, after 7-day bleomycin treatment (7D post bleo) or after 14-day bleomycin treatment (14D post bleo). Data represent box-and-whisker plots; horizontal lines represent the median and 25th to 75th percentiles, and whiskers represent minimum and maximum values from n = 6 (WT), 4 (Cnr1–/–), and 5 (Nos2–/–) mice. *P < 0.05 indicates significant difference from corresponding control group. #P < 0.05 indicates significant difference from values in WT mice within the same treatment group (2-way ANOVA followed by multiple comparisons test).
Figure 9
Figure 9. Effects of rimonabant, MRI-1867, or AM6545 treatment on survival and lung fibrosis development in bleomycin-treated mice.
Survival curves for the fibrosis prevention (A) and regression (B) treatment paradigms in bleomycin-instilled mice following chronic treatment with vehicle, rimonabant (Rim), MRI-1867, both rimonabant and MRI-1867 at 10 mg/kg, PO, or AM6545 at 10 mg/kg, intraperitoneally. Survival was analyzed by using log-rank (Mantel-Cox) test. *P < 0.05 indicates significant difference from bleomycin-treated vehicle group. Hydroxyproline levels in lung (C). Data represent box-and-whisker plots; horizontal lines represent the median and 25th to 75th percentiles, and whiskers represent minimum and maximum values from 4 mice (control and Post-bleo 7D vehicle) and 10–25 mice for other groups, as indicated in the figure. The length of vehicle treatment (starting at day 0 or 7) did not significantly affect survival; therefore, these data were merged and used as control for both treatment paradigms, as shown in A and B. Data were analyzed by 1-way ANOVA followed by Dunnett’s multiple comparisons test. *P < 0.05 indicates significant difference from control group. #P < 0.05 indicates significant difference from the vehicle group 14 days after bleomycin. +P < 0.05 indicates significant difference from the rimonabant-treated group. Hyp, hydroxyproline; C, control; V, vehicle; R, rimonabant; MRI, MRI-1867.
Figure 10
Figure 10. Effect of CB1R blockade (with rimonabant) or CB1R/iNOS dual inhibition (with MRI-1867) on gene expression profiles of fibrosis in WT mice following treatment from day 1–14 or day 7–14 after bleomycin treatment with vehicle, rimonabant, or MRI-1867 (10 mg/kg, PO).
Gene expression of fibrogenic markers Tgfβ1, Ctgf, Pdgfc, Col1a, Fn1, and Timp1 (A). iNOS activity in lung (B). Level of AEA in lung (C). Data represent box-and-whisker plots; horizontal lines represent the median and 25th to 75th percentiles, and whiskers represent minimum and maximum values from 4–9 mice per group. Data were analyzed by 1-way ANOVA followed by Dunnett’s multiple comparisons test. *P < 0.05 indicates significant difference from control group. #P < 0.05 indicates significant difference from 14D vehicle group. +P < 0.05 indicates significant difference from the rimonabant-treated group. C, control; V, vehicle; R, rimonabant; MRI, MRI-1867; 7D, treatment from day 7–14; 14D, treatment from day 1–14.
Figure 11
Figure 11. Effect of Cnr1 and Nos2 gene deletion or pharmacological inhibition on Irf5 expression in the lung.
Irf5 expression in lung tissue from control mice (n = 5) 14 days after bleomycin treatment in WT (n = 20), Cnr1–/– (n = 9), and Nos2–/– mice (n = 11) (A). Irf5 expression in bleomycin-challenged WT mice treated from day 1–14 (14D) or day 7–14 (7D) with vehicle (V), rimonabant (R), MRI-1867 (MRI), or both rimonabant and MRI-1867 at 10 mg/kg, PO. Data from n = 5 (control), 5 (V, 7D), 12 (V, 14D), and 8 mice (rimonabant and MRI-1867 treatments groups) are shown (B). C, control. IL1β protein levels in lung tissue lysates from control mice (n = 4) 14 days after bleomycin treatment in WT (n = 6), Cnr1–/– (n = 5), and Nos2–/– mice (n = 5) (C). Data represent box-and-whisker plots; horizontal lines represent the median and 25th to 75th percentiles, and whiskers represent minimum and maximum values, and were analyzed by 1-way ANOVA followed by Dunnett’s multiple comparisons test. *P < 0.05 indicates significant difference from control group. #P < 0.05 indicates significant effect of either gene deletion or pharmacological inhibition relative to WT vehicle in the bleomycin-challenged group.
Figure 12
Figure 12. Schematic representation of the overactive endocannabinoid/CB1R system and the proposed mechanisms of its proinflammatory and profibrotic functions in the lung.
This figure was prepared using a template on ChemDraw Professional 15 (PerkinElmer Informatics) and the Servier medical art website (http://www.servier.fr/servier-medical-art). AEA, anandamide; AMφ, alveolar macrophage; ATII, alveolar type 2 epithelial cell.

References

    1. Friedman SL, Sheppard D, Duffield JS, Violette S. Therapy for fibrotic diseases: nearing the starting line. Sci Transl Med. 2013;5(167):167sr1. - PubMed
    1. Lu JJ, Pan W, Hu YJ, Wang YT. Multi-target drugs: the trend of drug research and development. PLoS One. 2012;7(6):e40262. doi: 10.1371/journal.pone.0040262. - DOI - PMC - PubMed
    1. Idiopathic Pulmonary Fibrosis Clinical Research Network, Raghu G, Anstrom KJ, King TE, Lasky JA, Martinez FJ. Prednisone, azathioprine, and N-acetylcysteine for pulmonary fibrosis. N Engl J Med. 2012;366(21):1968–1977. doi: 10.1056/NEJMoa1113354. - DOI - PMC - PubMed
    1. King TE, et al. A phase 3 trial of pirfenidone in patients with idiopathic pulmonary fibrosis. N Engl J Med. 2014;370(22):2083–2092. doi: 10.1056/NEJMoa1402582. - DOI - PubMed
    1. Richeldi L, et al. Efficacy and safety of nintedanib in idiopathic pulmonary fibrosis. N Engl J Med. 2014;370(22):2071–2082. doi: 10.1056/NEJMoa1402584. - DOI - PubMed