. 2017 Apr 20;2(8):e90299.
doi: 10.1172/jci.insight.90299.

Silencing SMOC2 ameliorates kidney fibrosis by inhibiting fibroblast to myofibroblast transformation

Affiliations

Silencing SMOC2 ameliorates kidney fibrosis by inhibiting fibroblast to myofibroblast transformation

Casimiro Gerarduzzi et al. JCI Insight. .

Abstract

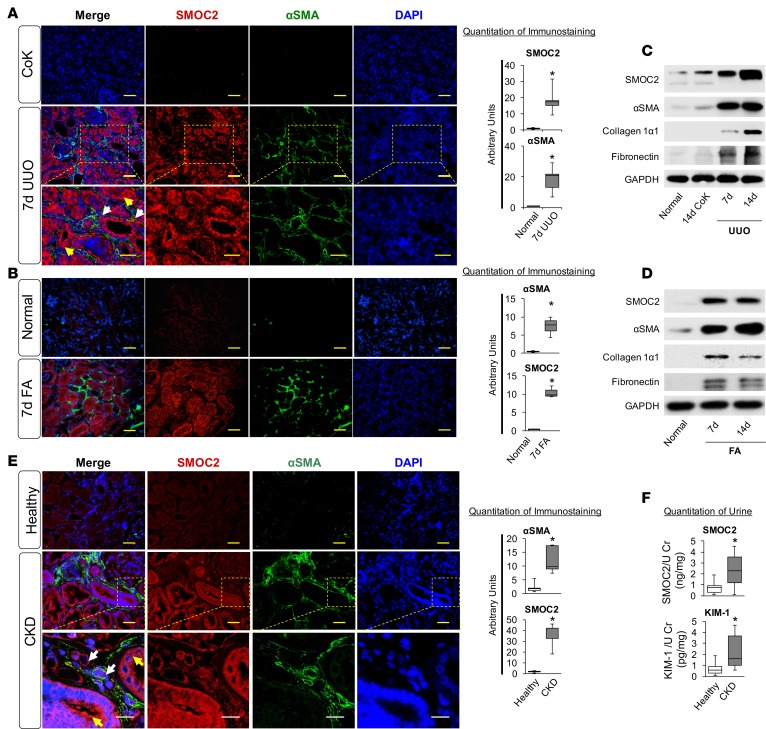
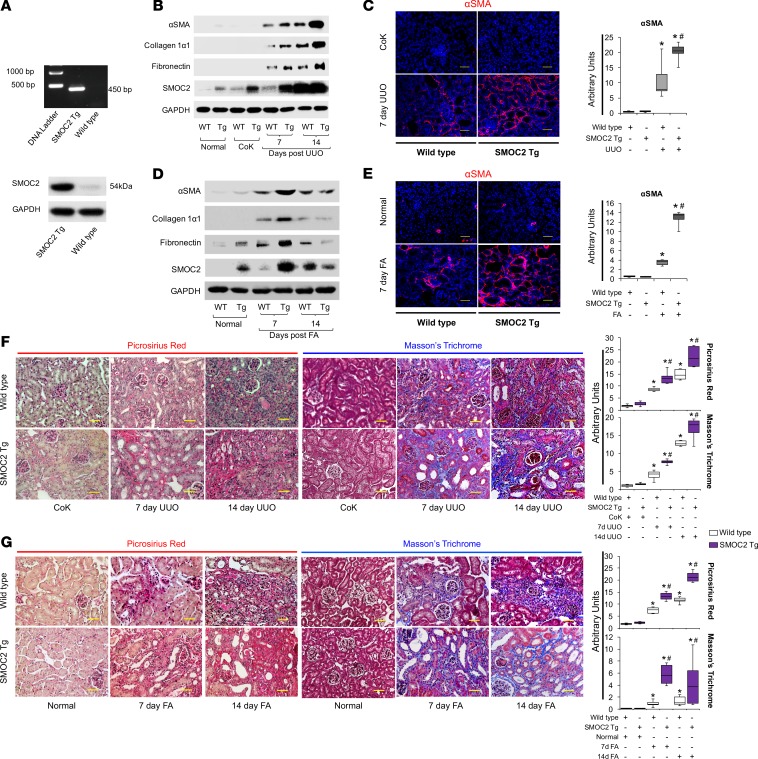
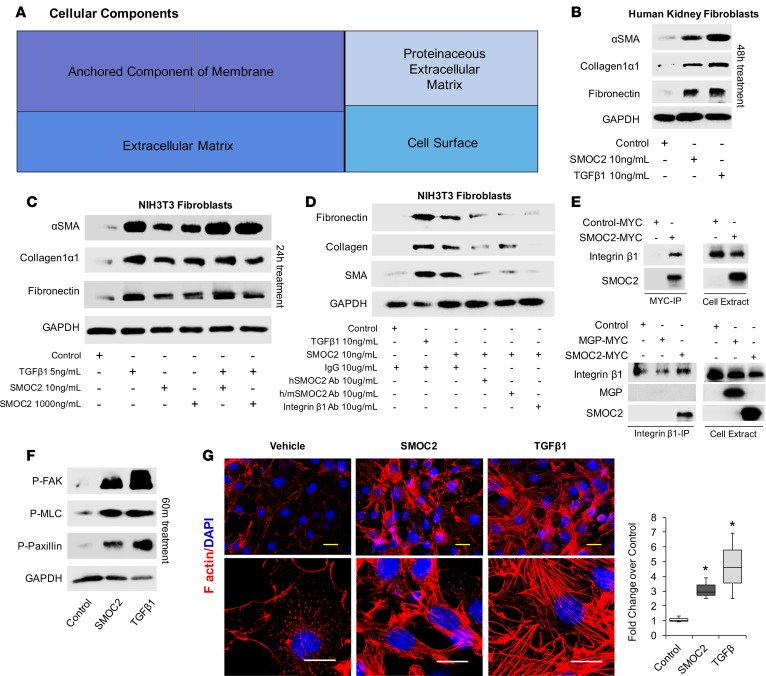
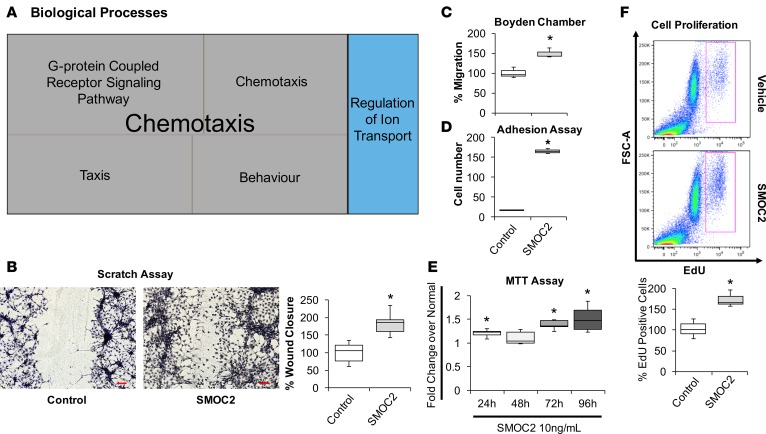
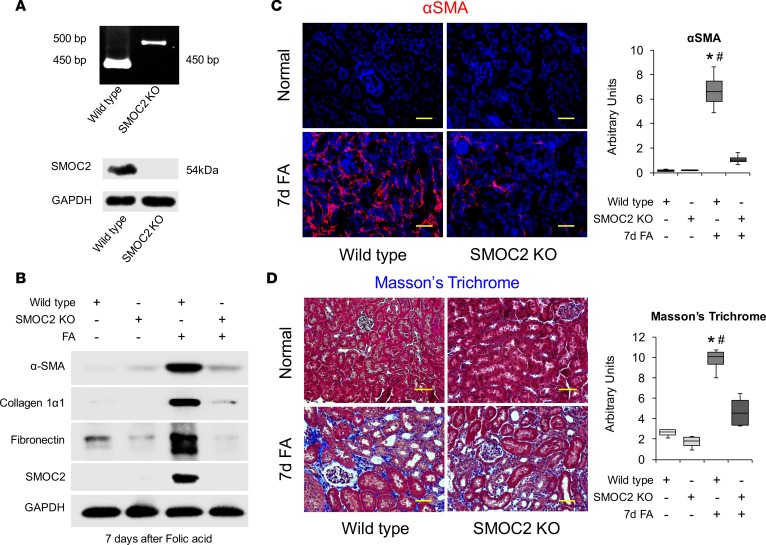
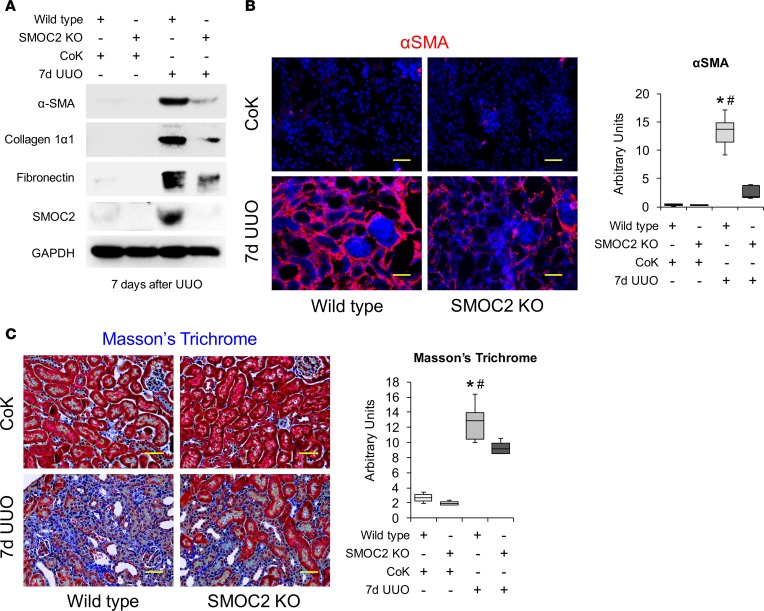
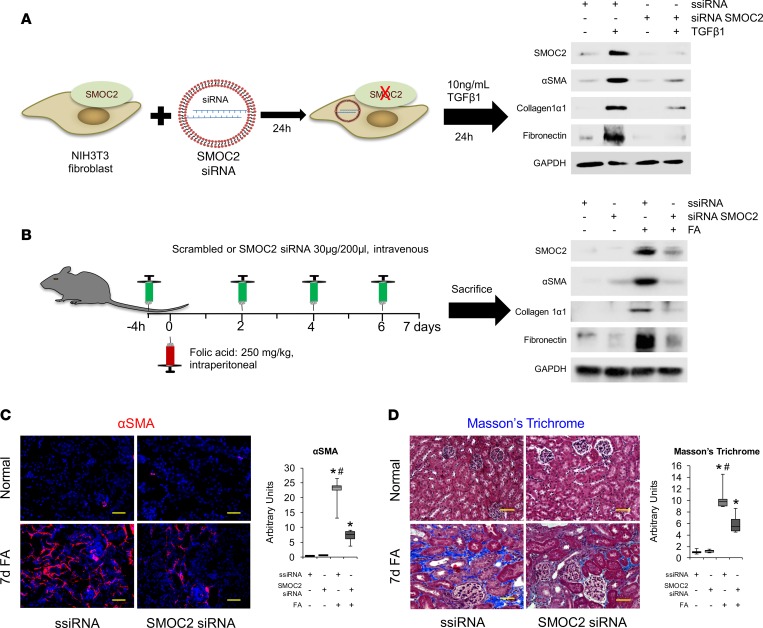
Secreted modular calcium-binding protein 2 (SMOC2) belongs to the secreted protein acidic and rich in cysteine (SPARC) family of matricellular proteins whose members are known to modulate cell-matrix interactions. We report that SMOC2 is upregulated in the kidney tubular epithelial cells of mice and humans following fibrosis. Using genetically manipulated mice with SMOC2 overexpression or knockdown, we show that SMOC2 is critically involved in the progression of kidney fibrosis. Mechanistically, we found that SMOC2 activates a fibroblast-to-myofibroblast transition (FMT) to stimulate stress fiber formation, proliferation, migration, and extracellular matrix production. Furthermore, we demonstrate that targeting SMOC2 by siRNA results in attenuation of TGFβ1-mediated FMT in vitro and an amelioration of kidney fibrosis in mice. These findings implicate that SMOC2 is a key signaling molecule in the pathological secretome of a damaged kidney and targeting SMOC2 offers a therapeutic strategy for inhibiting FMT-mediated kidney fibrosis - an unmet medical need.

Keywords: Nephrology.


Conflict of interest statement

Conflict of interest: The authors have declared that no conflict of interest exists.

Figures

Figure 1
Figure 1. SMOC2 is highly upregulated in mice and humans with kidney fibrosis.
Quantitative immunostaining for SMOC2 (red) and αSMA (green) was performed on kidney sections obtained from mice at day 7 following (A) unilateral ureteral obstruction (UUO) or (B) folic acid injection (FA) (n = 5; 20× magnification). Scale bar: 50 μm. For the UUO model, contralateral kidney (CoK) tissue from day 14 was also included. Bottom panel in A shows magnified images taken at 40× from the selected regions of the middle row. Scale bar: 30 μm. Relative quantitation of SMOC2 and αSMA immunofluorescence, as represented in a box plot, was performed using representative images of 5 visual fields for each tissue analyzed. (C and D) Representative Western blot (n = 5/condition; Supplemental Figure 1, B and C [UUO and FA, respectively]) of SMOC2, αSMA, collagen 1α1, and fibronectin expression using kidney samples obtained from mice subjected to 7 and 14 days of UUO or FA. (E) Quantitative immunostaining for SMOC2 (red) and αSMA (green) in human kidneys with pathological fibrosis underlying chronic kidney disease (CKD) (n = 5) and nonfibrotic patients (n = 5; 20× magnification). Yellow scale bars: 50 μm. Bottom panel shows magnified images taken at 60× from the selected regions of the middle row. White scale bars: 25 μm. Relative quantitation of SMOC2 and αSMA immunofluorescence as represented in a box plot was performed using representative images of 5 visual fields for each tissue analyzed. (F) Urinary levels of SMOC2 and kidney injury molecule-1 (KIM-1) normalized to urinary creatinine were measured in patients with CKD (n = 13) compared with healthy volunteers (n = 13). Box plots describe the median (line within box), upper and lower quartiles (bounds of box), and minimum and maximum values (bars). *P < 0.05 determined by t test. Yellow arrows, tubules. White arrows, interstitium.
Figure 2
Figure 2. SMOC2-overexpressing mice are more susceptible to kidney fibrosis than WT mice.
(A) Confirmation of SMOC2 overexpression in SMOC2 transgenic (SMOC2 Tg) mice by PCR (above, primers specific to recognize Tg insert) and Western blotting (below) (Supplemental Figure 3A). (B) Representative Western blot (n = 5/condition; Supplemental Figure 3B and Supplemental Figure 5B) of αSMA, collagen 1α1, fibronectin, and SMOC2 expression using kidney samples obtained from SMOC2 Tg and WT mice subjected to 7 and 14 days of unilateral ureteral obstruction (UUO). (C) Representative images of immunofluorescent staining for αSMA in CoK and fibrotic kidneys from WT and SMOC2 Tg mice at day 7 following UUO (n = 5/condition, 5 visual fields/tissue). (D) Representative Western blot (n = 5/condition; Supplemental Figure 3C and Supplemental Figure 6B) of αSMA, collagen 1α1, fibronectin, and SMOC2 expression using kidney samples obtained from SMOC2 Tg and WT mice subjected to 7 and 14 days of folic acid (FA). (E) Representative images of immunofluorescent staining for αSMA of normal and fibrotic kidneys from WT and SMOC2 Tg mice at day 7 following FA (n = 5/condition, 10 visual fields/tissue). (F) Representative images of picrosirius red (n = 5/condition, 10 visual fields/tissue) and Masson’s trichrome (n = 5/condition, 5 visual fields/tissue) staining of CoK versus 7 and 14 day UUO–treated kidneys. (G) Representative images of picrosirius red and Masson’s trichrome staining of normal versus 7 and 14 day FA–treated kidneys (n = 5/condition, 5 visual fields/tissue). Confocal and light microscopy images are 20× magnification. Scale bars: 50 μM. Relative quantifications of images are represented as box plots, which describe the median (line within box), upper and lower quartiles (bounds of box), and minimum and maximum values (bars). *P < 0.05 (CoK [UUO] or Normal [FA]) and #P < 0.05 (WT at respective time point) determined by one-way ANOVA with Tukey post-hoc analysis.
Figure 3
Figure 3. SMOC2 induces a fibroblast-to-myofibroblast transition.
(A) RNAseq was performed using kidneys from SMOC2 Tg and WT mice at day 7 following UUO treatment. REVIGO treemap visualizations are shown for enriched gene ontology (GO) categories. Highly similar GO terms for cellular components are grouped and visualized by different colors and sizes of the rectangles using semantic similarity and enrichment P values. Representative Western blots of αSMA, collagen 1α1, and fibronectin from serum-deprived primary human kidney fibroblasts (B, n = 3/condition; Supplemental Figure 8C) and NIH3T3 fibroblasts (C, n = 3/condition; Supplemental Figure 8D) treated with 10 ng/ml SMOC2 with/without TGFβ1. (D) After 1 hour of antibody pretreatment, SMOC2 or TGFβ1 was treated to serum-deprived NIH3T3 cells for 24 hours and then tested for conventional fibrotic markers, while integrin β1 antibody was pretreated with NIH3T3 cells and then treated with SMOC2 (n = 3/condition; Supplemental Figure 8E). (E) NIH3T3 fibroblasts were transfected with SMOC2-MYC, empty vector control, or negative control MGP-MYC and then immunoprecipitated with a MYC (above) or integrin antibody (below). Western blots are representative immunoprecipitation experiments. (F) Representative Western blot for Phospho-Focal Adhesion Kinase (P-FAK) Y925, P-Myosin Light Chain (MLC) Ser19, and P-Paxillin Tyr118 from NIH3T3 cells treated with 10 ng/ml SMOC2 or 5 ng/ml TGFβ1 for 60 minutes (n = 5/condition; Supplemental Figure 8H). (G) Phalloidin staining of F-actin after NIH3T3 cells were treated 24 hours with 10 ng/ml SMOC2 or 5 ng/ml TGFβ1 (n = 3). Top row 40×, 25 μM. Bottom row 100×, 15 μM. Box plots describe the median (line within box), upper and lower quartiles (bounds of box), and minimum and maximum values (bars). *P < 0.05 determined by t test.
Figure 4
Figure 4. SMOC2 induces the properties of myofibroblast activities.
(A) REVIGO treemap visualization for highly similar GO terms describing biological processes significantly different between SMOC2 Tg and WT mice at day 7 following UUO treatment. (B) Scratch assay performed on NIH3T3 cells treated 24 hours with 10 ng/ml SMOC2. Healing percentage represented in box plot (n = 5, 3 visual fields/condition; 10× magnification, scale bar: 50 μM). (C) Boyden chamber assay performed on NIH3T3 cells treated 24 hours with 10 ng/ml SMOC2. (D) NIH3T3 cells were treated 24 hours with/without 10 ng/ml SMOC2, and then trypsinized and reseeded. After 1 hour, unattached cells were washed and cell numbers were quantified for adherence (n = 3). (E) Metabolic activity of control and 10 ng/ml SMOC2-treated NIH3T3 cells were measured over time by MTT assay (n = 5). (F) NIH3T3 fibroblasts were treated 24 hours with/without 10 ng/ml SMOC2, and cell proliferation was assessed by EdU labeling and FACS (n = 5). Box plots describe the median (line within box), upper and lower quartiles (bounds of box), and minimum and maximum values (bars). *P < 0.05 determined by t test.
Figure 5
Figure 5. Genetic inhibition of SMOC2 limits folic acid–induced kidney fibrosis in mice.
(A) Confirmation of SMOC2 deletion in SMOC2-KO mice by PCR (above, PCR primers specific to recognize knock-in insert) and Western blotting (below). (B) Representative Western blot (n = 4/group; Supplemental Figure 11) of αSMA, collagen 1α1, fibronectin, and SMOC2 expression using kidney samples obtained at day 7 from SMOC2-KO and WT mice subjected to folic acid (FA) treatment. (C) Immunofluorescent αSMA staining of KO and WT kidneys at day 7 following with/out FA treatment (n = 4/group). (D) Masson’s trichrome staining of normal and FA-treated kidneys obtained at day 7 from KO and WT mice. Confocal and light microscopy images are 20× magnification. Scale bars: 50μM. Quantification of images is represented as box plots (n = 4/condition, 10 visual fields/mice), which describe the median (line within box), upper and lower quartiles (bounds of box), and minimum and maximum values (bars). *P < 0.05 (WT normal) and #P <0.05 (WT at respective treatment) determined by one-way ANOVA with Tukey post-hoc analysis.
Figure 6
Figure 6. Genetic inhibition of SMOC2 limits UUO-induced kidney fibrosis in mice.
(A) Representative Western blot (n = 5/group; Supplemental Figure 12) of αSMA, collagen 1α1, fibronectin, and SMOC2 expression using kidney samples obtained at day 7 from SMOC2-KO and WT mice subjected to UUO. (B) Representative images (n = 3/group; 5 visual fields for each tissue analyzed) of immunofluorescent αSMA staining of KO and WT kidneys from normal mice and day 7 UUO mice. Relative quantitation is represented in a box plot as arbitrary units. (C) Masson’s trichrome staining of normal and 7-day UUO kidneys from WT and KO mice. Images of Masson’s trichrome staining are representative of 5–10 visual fields for each tissue analyzed. Quantification is represented in a box plot as arbitrary units (mice n = 5–6, 5–10 visual fields/mice). Confocal images are 20× magnification; scale bar: 50 μM. Light microscopy images are 20× magnification; scale bar: 50μM. Box plots describe the median (line within box), upper and lower quartiles (bounds of box), and minimum and maximum values (bars). *P < 0.05 (WT CoK) and #P < 0.05 (WT at respective UUO) determined by one-way ANOVA with Tukey post-hoc analysis.
Figure 7
Figure 7. Silencing SMOC2 reduces TGFβ1-induced fibrotic markers in vitro and folic acid–induced kidney fibrosis in mice.
(A) Scheme of the experimental procedure for SMOC2 siRNA–transfected NIH3T3 cells. After 24 hours of treatment with SMOC2 siRNA or scrambled siRNA (ssiRNA), NIH3T3 fibroblasts were either treated with/without TGFβ1 for 24 hours. Representative Western blot (n = 3/condition; Supplemental Figure 14) was performed for SMOC2, αSMA, collagen 1α1, and fibronectin expression. (B) Scheme of the experimental procedure for SMOC2 siRNA– or ssiRNA-injected C57BL/6 mice treated with/out folic acid (FA). Mice were injected i.v. with 30 μg/200 μl of SMOC2 siRNA or ssiRNA 4 hours before and 2, 4, and 6 days after an i.p. injection of 250 mg/kg of FA. Representative Western blot (n = 5/group; Supplemental Figure 16) was performed for SMOC2, αSMA, collagen 1α1, and fibronectin. (C) Immunofluorescent αSMA staining of kidneys obtained from mice at day 7 following with/out FA either treated with ssiRNA or SMOC2 siRNA (n = 5). (D) Masson’s trichrome staining of normal and FA-treated kidneys obtained at day 7 following ssiRNA or SMOC2 siRNA administration. Confocal and light microscopy images are 20× magnification. Scale bars: 50 μM. Quantification of images is represented as a box plot (n = 5/condition, 10 visual fields/mice), which describe the median (line within box), upper and lower quartiles (bounds of box), and minimum and maximum values (bars). *P < 0.05 (ssiRNA + vehicle) and #P < 0.05 (ssiRNA respective treatment) determined by one-way ANOVA with Tukey post-hoc analysis.

References

    1. Nanthakumar CB, Hatley RJ, Lemma S, Gauldie J, Marshall RP, Macdonald SJ. Dissecting fibrosis: therapeutic insights from the small-molecule toolbox. Nat Rev Drug Discov. 2015;14(10):693–720. doi: 10.1038/nrd4592. - DOI - PubMed
    1. Ferenbach DA, Bonventre JV. Mechanisms of maladaptive repair after AKI leading to accelerated kidney ageing and CKD. Nat Rev Nephrol. 2015;11(5):264–276. doi: 10.1038/nrneph.2015.3. - DOI - PMC - PubMed
    1. Breyer MD, Susztak K. The next generation of therapeutics for chronic kidney disease. Nat Rev Drug Discov. 2016;15(8):568–588. doi: 10.1038/nrd.2016.67. - DOI - PMC - PubMed
    1. Grgic I, Duffield JS, Humphreys BD. The origin of interstitial myofibroblasts in chronic kidney disease. Pediatr Nephrol. 2012;27(2):183–193. doi: 10.1007/s00467-011-1772-6. - DOI - PMC - PubMed
    1. Duffield JS. Cellular and molecular mechanisms in kidney fibrosis. J Clin Invest. 2014;124(6):2299–2306. doi: 10.1172/JCI72267. - DOI - PMC - PubMed