

Dynamics of B Cell Recovery In Kidney/Bone Marrow Transplant Recipients
- PMID: 28422925
- PMCID: PMC5648631
- DOI: 10.1097/TP.0000000000001789
Dynamics of B Cell Recovery In Kidney/Bone Marrow Transplant Recipients
Abstract
Background: Previous studies identified B cell gene signatures and predominance of specific B cell subsets as a marker of operational tolerance after kidney transplantation. These findings suggested a role for B cells in the establishment or maintenance of tolerance. Here we analyzed B cell recovery in 4 subjects, 3 of whom achieved tolerance after combined kidney/bone marrow transplantation.
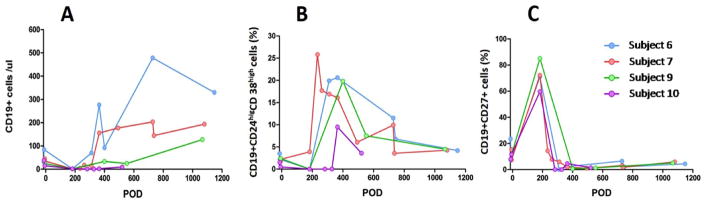
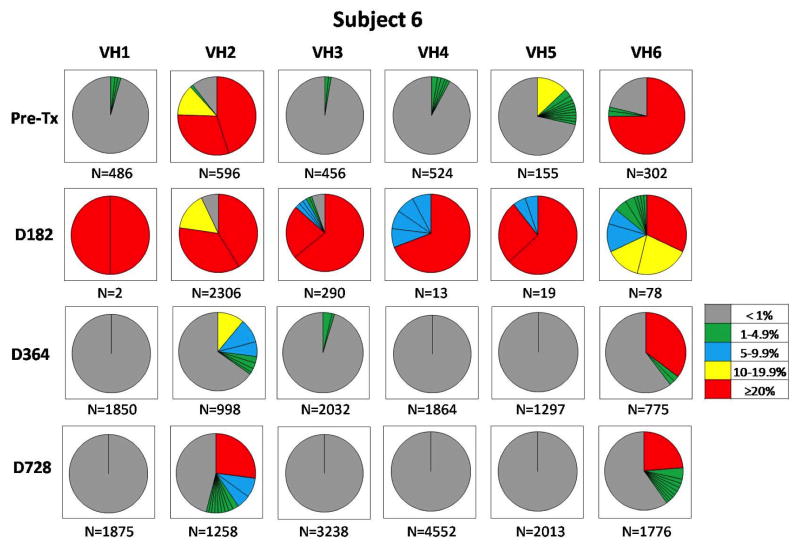
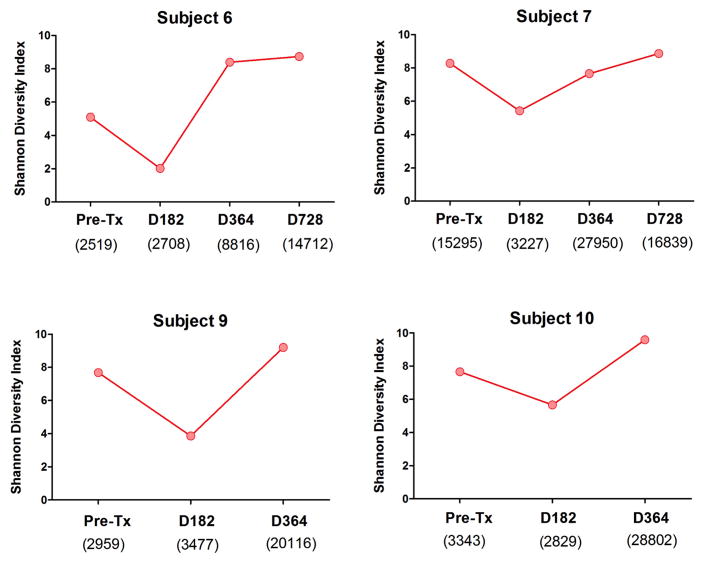
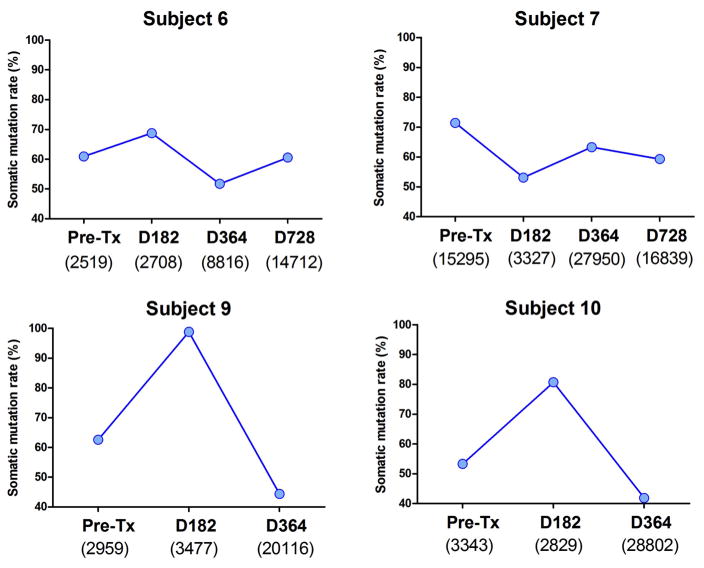
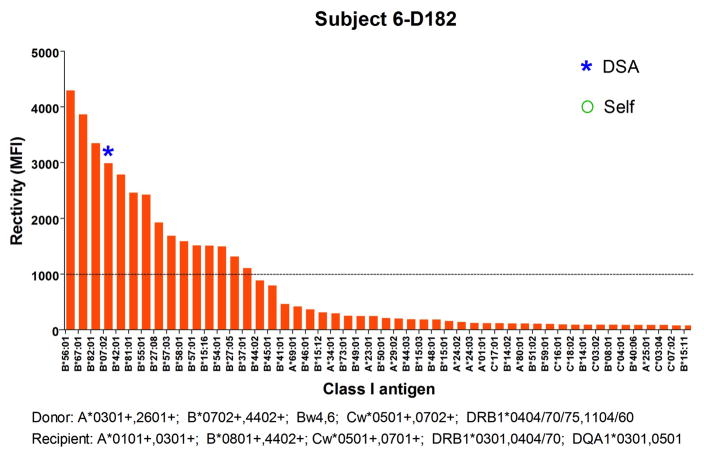
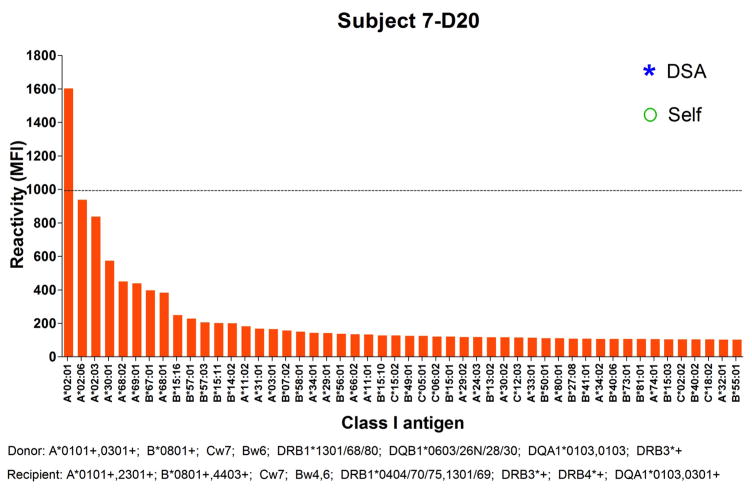
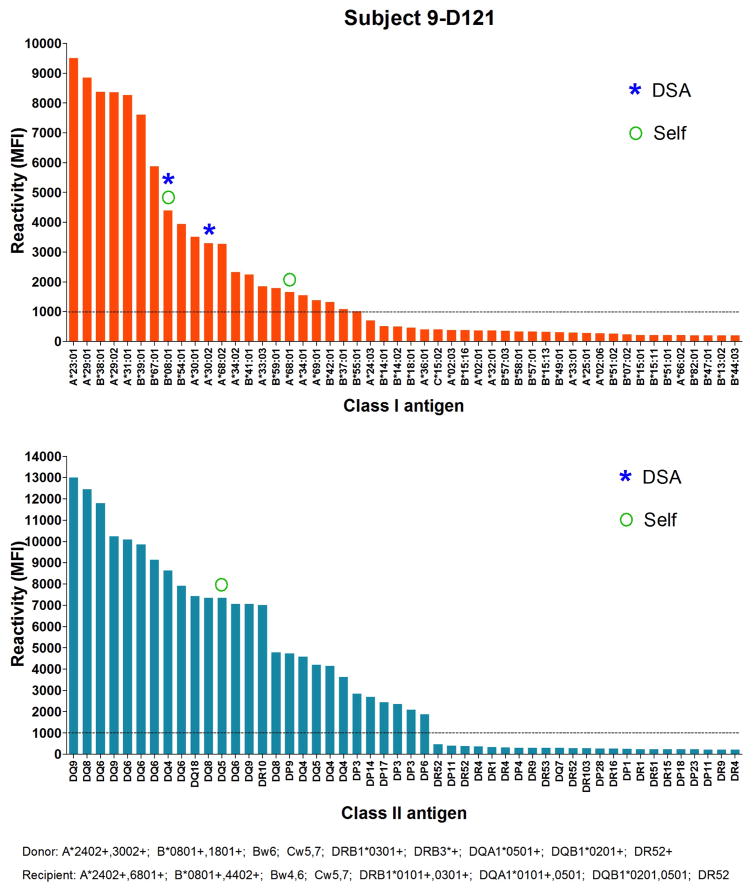
Methods: Peripheral B cell subsets were examined longitudinally by flow cytometry. Immunoglobulin heavy chain repertoire analysis was performed using next-generation sequencing. Lastly, the patients' serum reactivity to HLA was assessed by Luminex.
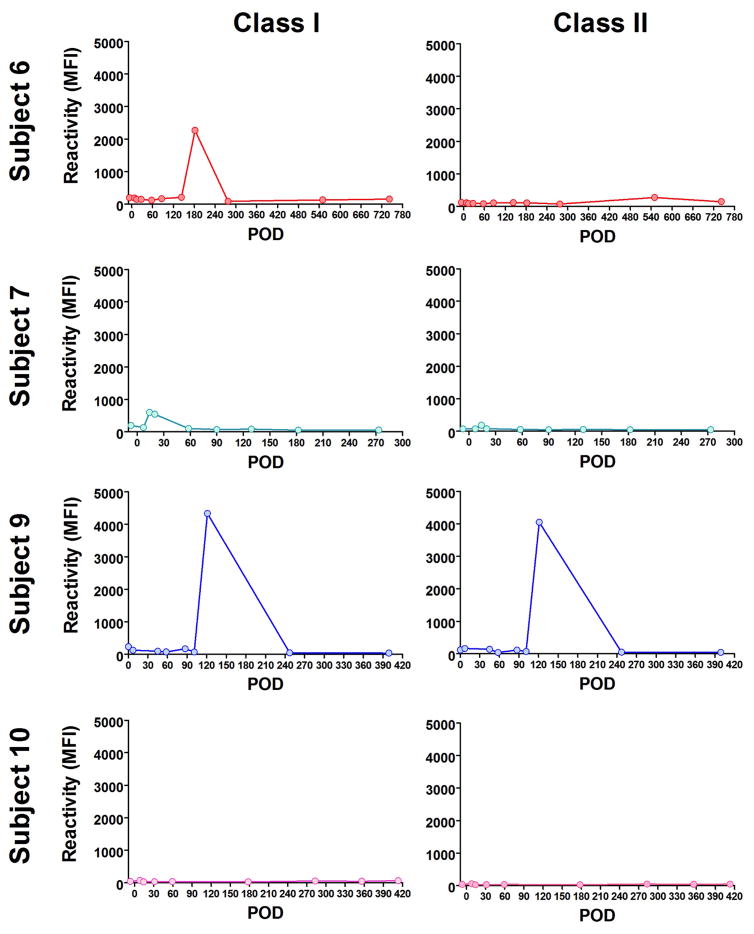
Results: B cell counts recovered approximately 1 year posttransplant except for 1 subject who experienced delayed reconstitution. This subject resumed immunosuppression for acute rejection at 10 months posttransplant and underwent preemptive retransplantation at 3 years for chronic rejection. B cell recovery was accompanied by a high frequency of CD20 + CD24CD38 transitional B cells and a diversified clonal repertoire. However, all 4 subjects showed prevalence of CD20 + CD27+ memory B cells around 6 months posttransplant when B cell counts were still low and the clonal B cell repertoire very limited. The predominance of memory B cells was also associated with high levels of somatically mutated immunoglobulin heavy chain variable sequences and transient serum reactivity to HLA.
Conclusions: Our observations reveal the presence of memory B cells early posttransplant that likely escaped the preparative regimen at a time consistent with the establishment of tolerance. Further studies are warranted to characterize the functional properties of these persisting memory cells and evaluate their potential contribution to tolerance induction.
Figures
Similar articles
-
Evidence to Support a Contribution of Polyreactive Antibodies to HLA Serum Reactivity.Transplantation. 2016 Jan;100(1):217-26. doi: 10.1097/TP.0000000000000840. Transplantation. 2016. PMID: 26285015 Free PMC article.
-
Monitoring alloimmune response in kidney transplantation.J Nephrol. 2017 Apr;30(2):187-200. doi: 10.1007/s40620-016-0320-7. Epub 2016 May 31. J Nephrol. 2017. PMID: 27245689 Free PMC article. Review.
-
A clinically feasible approach to induce delayed tolerance in recipients of prior kidney or vascularized composite allotransplants.Transplantation. 2012 Oct 15;94(7):671-8. doi: 10.1097/TP.0b013e318264fbc1. Transplantation. 2012. PMID: 22948444
-
Reconstitution of peripheral allospecific CD19+ B-cell subsets after B-lymphocyte depletion therapy in renal transplant patients.Transplantation. 2009 May 15;87(9):1394-401. doi: 10.1097/TP.0b013e3181a27683. Transplantation. 2009. PMID: 19424042
-
Memory B cells in transplantation.Transplantation. 2015 Jan;99(1):21-8. doi: 10.1097/TP.0000000000000545. Transplantation. 2015. PMID: 25525921 Free PMC article. Review.
Cited by
-
Clinical application of immune repertoire sequencing in solid organ transplant.Front Immunol. 2023 Feb 14;14:1100479. doi: 10.3389/fimmu.2023.1100479. eCollection 2023. Front Immunol. 2023. PMID: 36865546 Free PMC article. Review.
-
Rejection of xenogeneic porcine islets in humanized mice is characterized by graft-infiltrating Th17 cells and activated B cells.Am J Transplant. 2020 Jun;20(6):1538-1550. doi: 10.1111/ajt.15763. Epub 2020 Jan 21. Am J Transplant. 2020. PMID: 31883299 Free PMC article.
-
Rapid Emergence of T Follicular Helper and Germinal Center B Cells Following Antiretroviral Therapy in Advanced HIV Disease.Front Immunol. 2021 Dec 1;12:752782. doi: 10.3389/fimmu.2021.752782. eCollection 2021. Front Immunol. 2021. PMID: 34938286 Free PMC article.
References
-
- Chesneau M, Pallier A, Braza F, et al. Unique B cell differentiation profile in tolerant kidney transplant patients. Am J Transplant. 2014;14(1):144–155. - PubMed
-
- Durand J, Huchet V, Merieau E, et al. Regulatory B cells with a partial defect in CD40 signaling and overexpressing granzyme B transfer allograft tolerance in rodents. J Immunol. 2015;195(10):5035–5044. - PubMed
Publication types
MeSH terms
Substances
Grants and funding
LinkOut - more resources
Full Text Sources
Other Literature Sources
Medical
Research Materials
