

Phenotypic Characterization of Adherent Cells Population CD34+ CD90+ CD105+ Derived from Wharton's Jelly
- PMID: 28422936
- PMCID: PMC5405783
- DOI: 10.12659/msm.902186
Phenotypic Characterization of Adherent Cells Population CD34+ CD90+ CD105+ Derived from Wharton's Jelly
Abstract
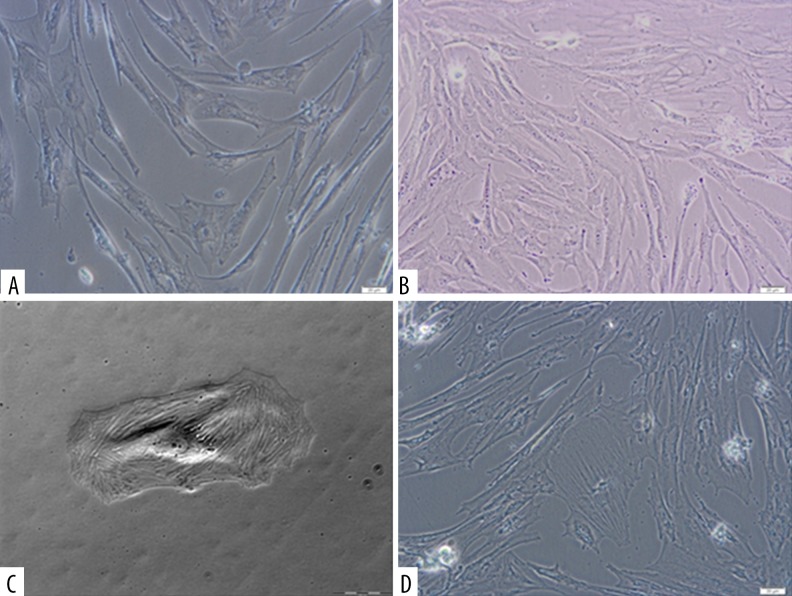
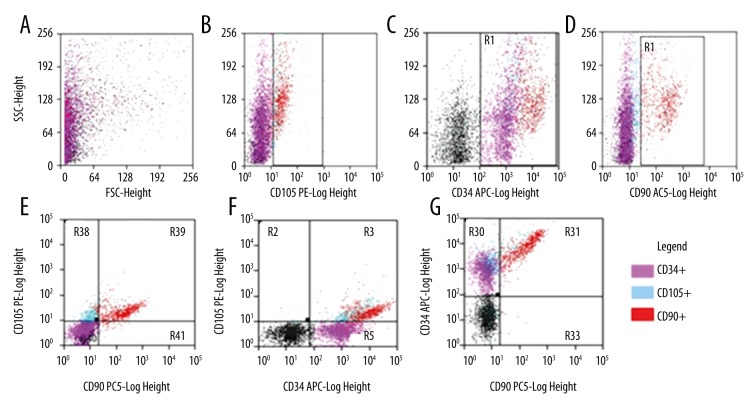
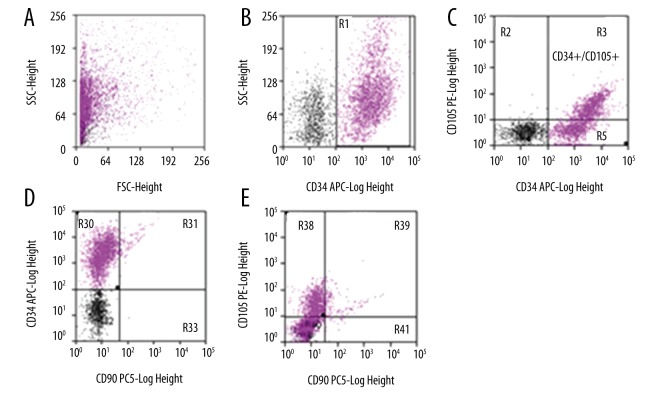
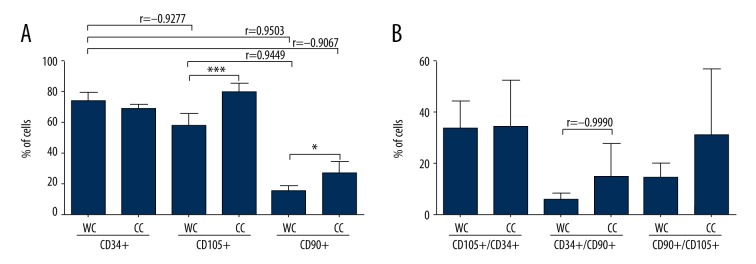
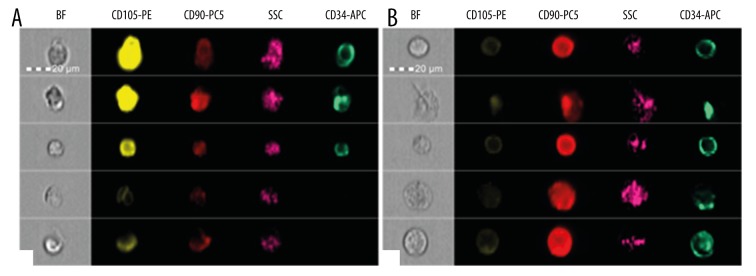
BACKGROUND Mesenchymal stromal cells, MSCs, show expression of specific antigens on their surface. The aim of the study is to assess the phenotype of stem cells like isolated from the umbilical cord with respect to the presence of surface antigens CD34, CD90, and CD105 and differences in the expression of surface antigens in cells isolated from freshly sampled material in comparison with the phenotype of cells from in vitro culture. MATERIAL AND METHODS Stem cells collected from the umbilical cord from healthy patients and then cultured in vitro. To assess the phenotype of stem cells, cytometric analysis was carried out. To assess the phenotype of cells we used fluorescently labelled monoclonal antibodies: APC Mouse anti-human CD34, PC5 Mouse anti-human CD90 and PE Mouse anti-human CD105. RESULTS In the case of cells from the umbilical cord and then cultured in vitro for the period of 10-14 days CD34 expression is lower (69,5%) in comparison with the group of cells not cultured. Not cultured cells were demonstrated 37% of cells co-expression of antigens CD34 and CD105, over 21% of CD34/CD90 cells and over 24% of CD105/CD90. Cultured cells group was showed higher percentage of CD90, CD105, CD34/CD105, CD34/CD90, CD105/CD90 in comparison with not cultured cells. CONCLUSIONS Our reults suggested that adherent cells population from umbilical cord, demonstrate CD34 expression In vivo. Moreover, the phenotype of MSCs, mainly in the context of CD34 expression, may vary depending on the place of collection of cells and the length of growing the cell culture.
Figures
Similar articles
-
Characteristics of mesenchymal stem cells derived from Wharton's jelly of human umbilical cord and for fabrication of non-scaffold tissue-engineered cartilage.J Biosci Bioeng. 2014 Feb;117(2):229-235. doi: 10.1016/j.jbiosc.2013.07.001. Epub 2013 Jul 27. J Biosci Bioeng. 2014. PMID: 23899897
-
Comparative analysis of human Wharton's jelly mesenchymal stem cells derived from different parts of the same umbilical cord.Cell Tissue Res. 2018 Apr;372(1):51-65. doi: 10.1007/s00441-017-2699-4. Epub 2017 Dec 4. Cell Tissue Res. 2018. PMID: 29204746 Free PMC article.
-
Mesenchymal stem cells from the Wharton's jelly of umbilical cord segments provide stromal support for the maintenance of cord blood hematopoietic stem cells during long-term ex vivo culture.Transfusion. 2008 Dec;48(12):2638-44. doi: 10.1111/j.1537-2995.2008.01926.x. Epub 2008 Sep 16. Transfusion. 2008. PMID: 18798803 Free PMC article.
-
Mesenchymal stem cells in the umbilical cord: phenotypic characterization, secretome and applications in central nervous system regenerative medicine.Curr Stem Cell Res Ther. 2011 Sep;6(3):221-8. doi: 10.2174/157488811796575332. Curr Stem Cell Res Ther. 2011. PMID: 21476975 Review.
-
Epithelial In vitro Differentiation of Mesenchymal Stem Cells.Curr Stem Cell Res Ther. 2018;13(6):409-422. doi: 10.2174/1574888X13666180501120416. Curr Stem Cell Res Ther. 2018. PMID: 29714147 Review.
Cited by
-
Variations in Umbilical Cord Hematopoietic and Mesenchymal Stem Cells With Bronchopulmonary Dysplasia.Front Pediatr. 2019 Nov 14;7:475. doi: 10.3389/fped.2019.00475. eCollection 2019. Front Pediatr. 2019. PMID: 31799226 Free PMC article.
-
Influence of Umbilical Cord Blood Biochemical Parameters and Disease Condition on the Expression of the TSG-6 Gene in Umbilical Mesenchymal Stem Cells.Med Sci Monit. 2023 Jun 14;29:e939716. doi: 10.12659/MSM.939716. Med Sci Monit. 2023. PMID: 37312421 Free PMC article.
-
Aldehyde dehydrogenase activity of Wharton jelly mesenchymal stromal cells: isolation and characterization.Cytotechnology. 2019 Feb;71(1):427-441. doi: 10.1007/s10616-018-0283-8. Epub 2019 Jan 4. Cytotechnology. 2019. PMID: 30610510 Free PMC article.
-
Potential Involvement of BIRC5 in Maintaining Pluripotency and Cell Differentiation of Human Stem Cells.Oxid Med Cell Longev. 2019 Jan 10;2019:8727925. doi: 10.1155/2019/8727925. eCollection 2019. Oxid Med Cell Longev. 2019. PMID: 30774747 Free PMC article.
-
Increased Expression of BIRC2, BIRC3, and BIRC5 from the IAP Family in Mesenchymal Stem Cells of the Umbilical Cord Wharton's Jelly (WJSC) in Younger Women Giving Birth Naturally.Oxid Med Cell Longev. 2020 Apr 8;2020:9084730. doi: 10.1155/2020/9084730. eCollection 2020. Oxid Med Cell Longev. 2020. PMID: 32322338 Free PMC article.
References
-
- Baker N, Boyette LB, Tuan RS. Characterization of bone marrow-derived mesenchymal stem cells in aging. Bone. 2015;70:37–47. - PubMed
-
- Busser H, Najar M, Raicevic G, et al. Isolation and characterization of human mesenchymal stromal cell subpopulations: Comparison of bone marrow and adipose tissue. Stem Cells Dev. 2015;24:2142–57. - PubMed
-
- Trivanović D, Kocić J, Mojsilović S, et al. Mesenchymal stem cells isolated from peripheral blood and umbilical cord Wharton’s jelly. Srp Arh Celok Lek. 2013;144:178–86. - PubMed
-
- Najar M, Rodrigues RM, Buyl K, et al. Proliferative and phenotypical characteristics of human adipose tissue-derived stem cells: Comparison of Ficoll gradient centrifugation and red blood cell lysis buffer treatment purification methods. Cytotherapy. 2014;9:1220–28. - PubMed
MeSH terms
Substances
LinkOut - more resources
Full Text Sources
