. 2017 Apr 19;15(4):e2001573.
doi: 10.1371/journal.pbio.2001573. eCollection 2017 Apr.

Molecular regionalization of the developing amphioxus neural tube challenges major partitions of the vertebrate brain

Affiliations

Molecular regionalization of the developing amphioxus neural tube challenges major partitions of the vertebrate brain

Beatriz Albuixech-Crespo et al. PLoS Biol. .

Abstract

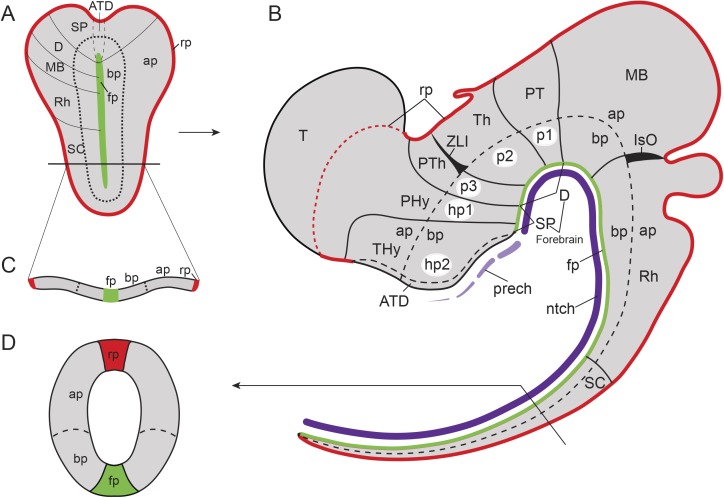
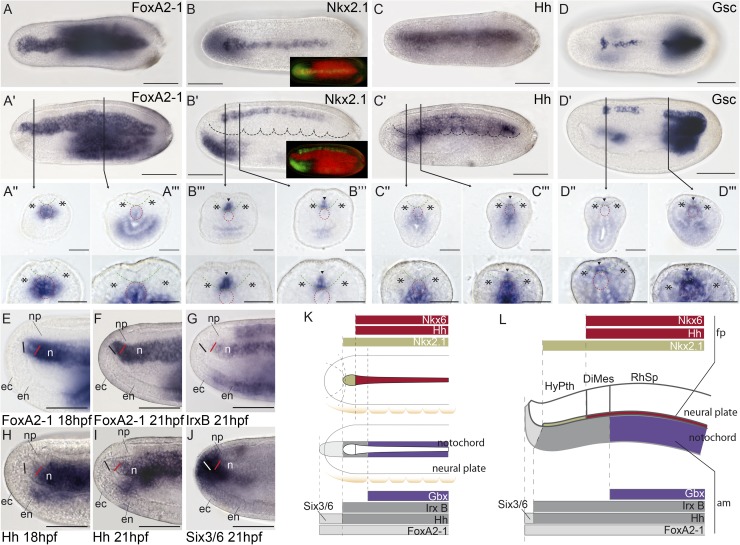
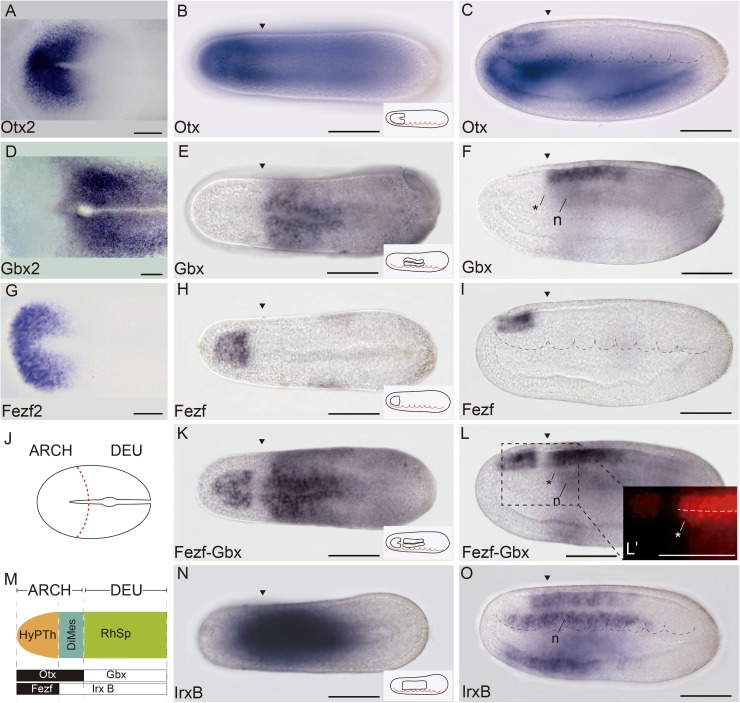
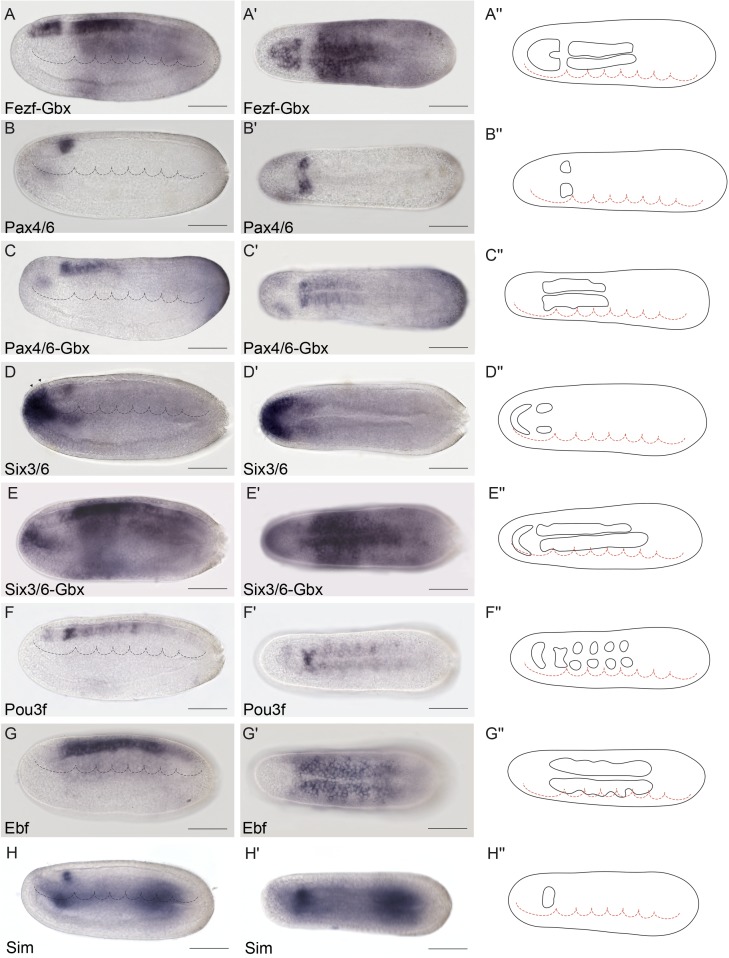
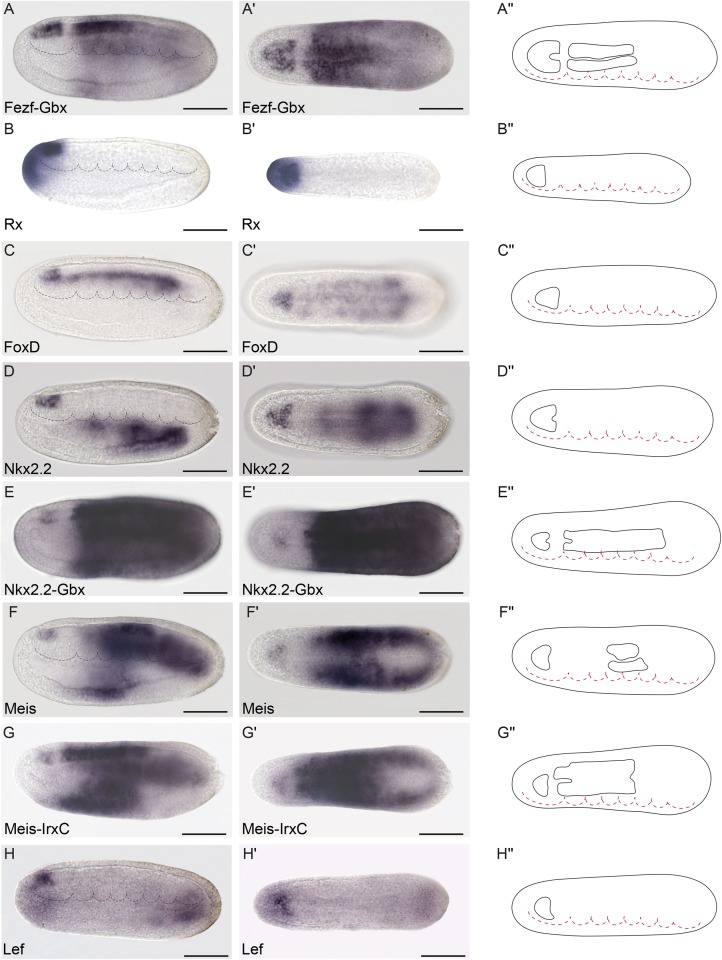
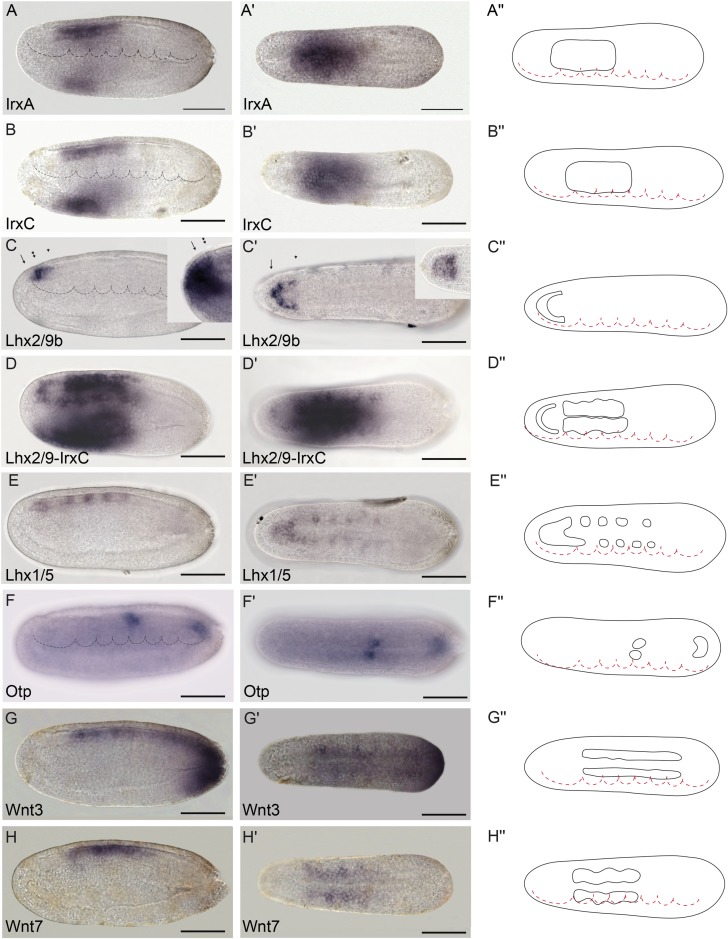
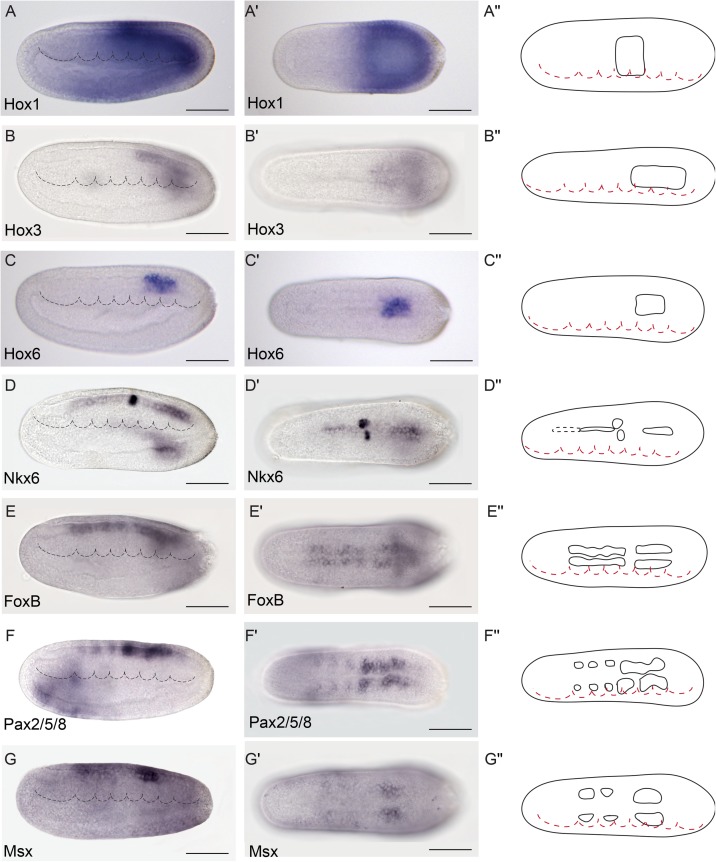
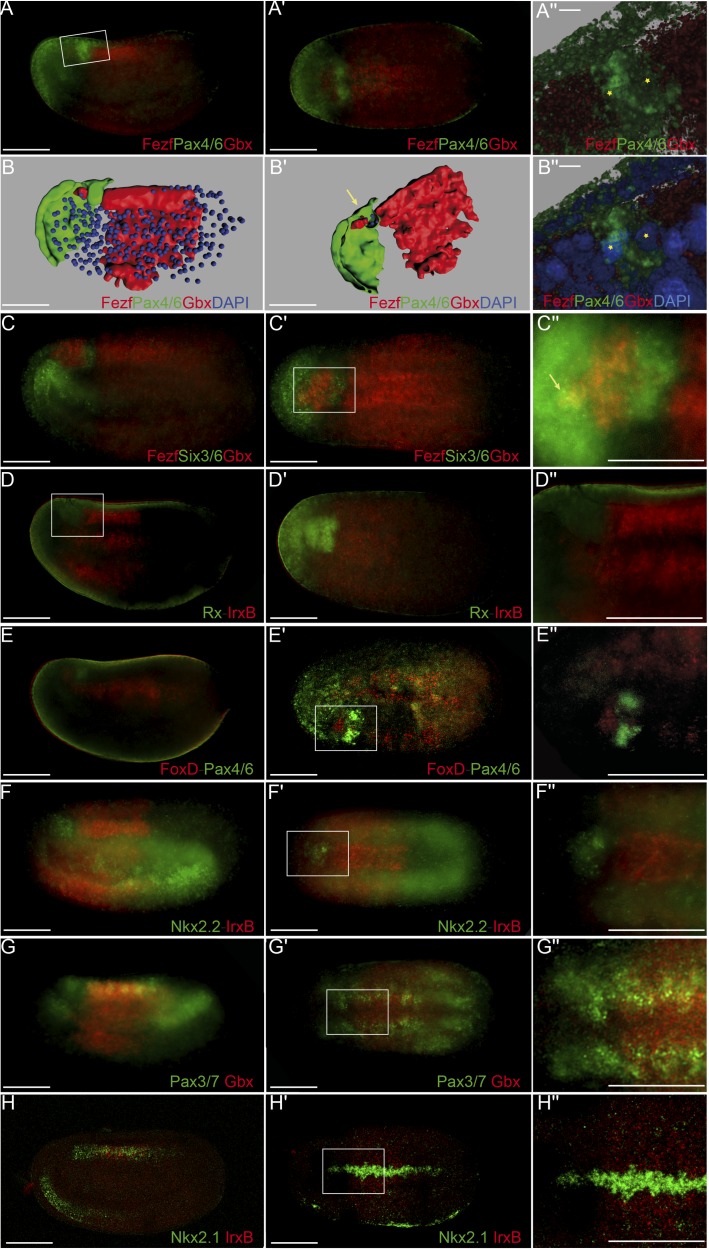
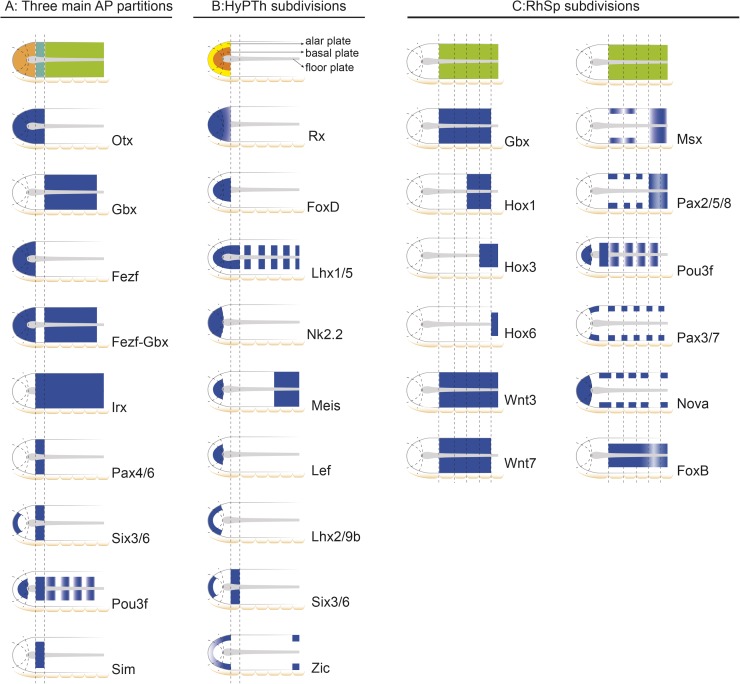
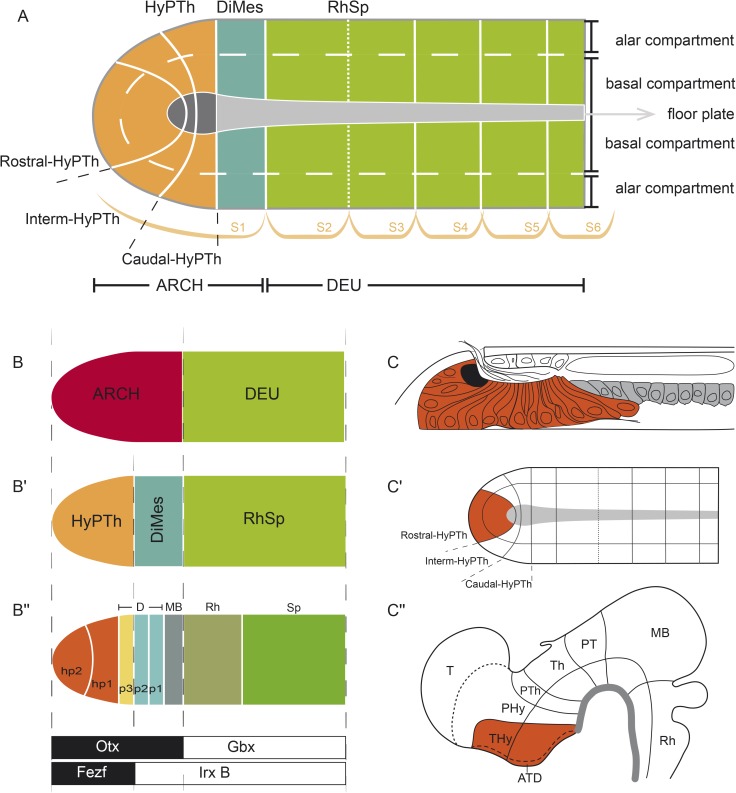
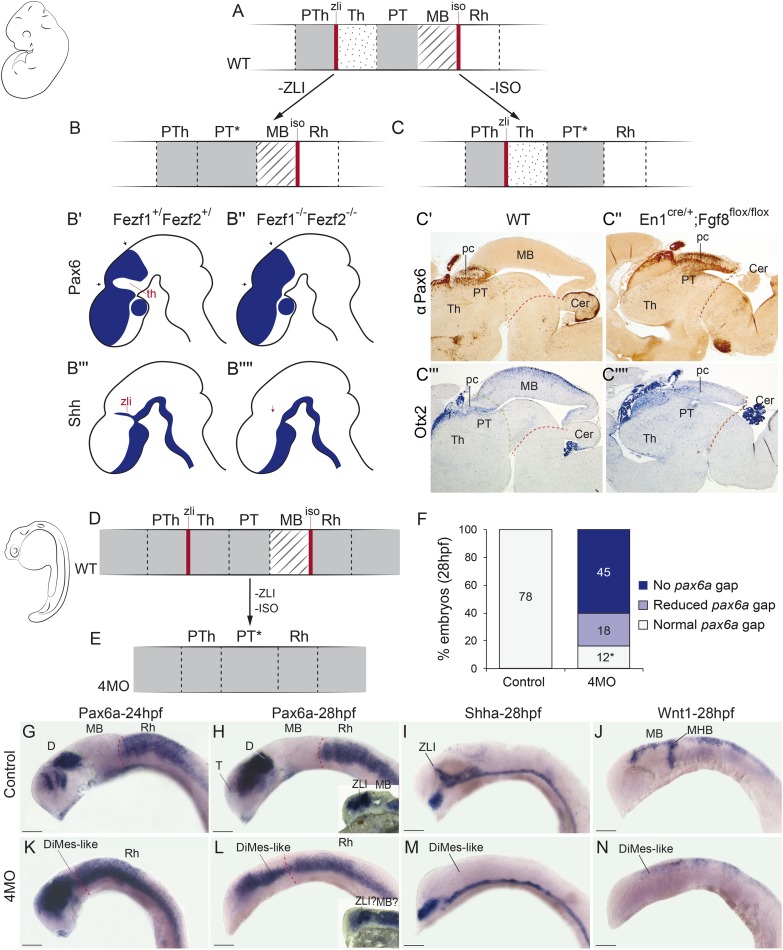
All vertebrate brains develop following a common Bauplan defined by anteroposterior (AP) and dorsoventral (DV) subdivisions, characterized by largely conserved differential expression of gene markers. However, it is still unclear how this Bauplan originated during evolution. We studied the relative expression of 48 genes with key roles in vertebrate neural patterning in a representative amphioxus embryonic stage. Unlike nonchordates, amphioxus develops its central nervous system (CNS) from a neural plate that is homologous to that of vertebrates, allowing direct topological comparisons. The resulting genoarchitectonic model revealed that the amphioxus incipient neural tube is unexpectedly complex, consisting of several AP and DV molecular partitions. Strikingly, comparison with vertebrates indicates that the vertebrate thalamus, pretectum, and midbrain domains jointly correspond to a single amphioxus region, which we termed Di-Mesencephalic primordium (DiMes). This suggests that these domains have a common developmental and evolutionary origin, as supported by functional experiments manipulating secondary organizers in zebrafish and mice.


Conflict of interest statement

The authors have declared that no competing interests exist.

Figures

Fig 1
Fig 1. Bauplan of the vertebrate central nervous system (CNS).
Schematic representation of the Bauplan of the vertebrate CNS according to the updated prosomeric model (Puelles and Rubenstein, 2015) at neural plate and early neural tube closure stages. (A) Schematic dorsal view of a representative neural plate of vertebrates depicting the components that define the longitudinal axis: floor plate (fp, in green) and parallel basal (bp), alar (ap) and roof (rp, in red) plates. Note that the fp does not reach the rostral boundary of the neural plate, whereas the bp, ap, and rp go around the fp; a similar phenomena can be observed in the caudal end of the neural plate. This peculiarity defines a rostral-most dorsoventral (DV) region termed acroterminal domain (ATD). From this domain, several anteroposterior (AP) partitions can be defined molecularly from rostral to caudal: secondary prosencephalon (SP) and diencephalon proper (D) (classic forebrain components), midbrain (MB), rhombencephalon (Rh), and spinal cord (SC) regions. (B) Schematic lateral view of an early closed neural tube in a more advanced stage of regionalization. Longitudinal components are indicated as fp (green), bp, ap, and rp (red). At this stage, the vertebrate neural tube is characterized by several definitive neuromeric units (i.e., AP partitions with all the DV components). The forebrain is subdivided into SP, with peduncular and terminal prosomeres (hp1 and hp2, respectively), which include the hypothalamic region, telencephalon (Tel), and the optic vesicles, and D (with prosomeres 1, 2, and 3 [p1–p3], which are represented at the ap level by pretectum [PT], thalamus [Th], and prethalamus [PTh], respectively). More caudally, MB, Rh, and SC regions are identified (for simplicity, their respective neuromeric components are not depicted). The secondary organizers zona limitans intrathalamica (ZLI) and the isthmic organizer (IsO) are located between the PTh and Th regions, and the MB and Rh regions, respectively. (C) The transversal section throughout the open neural plate in (A), showing the main longitudinal components (fp, bp, ap, and rp) arranged medio-laterally at this stage. (D) Cross section through the closed neural tube, showing the DV relationships of the same longitudinal components highlighted in (C).
Fig 2
Fig 2. Molecular regionalization of the amphioxus floor plate and axial mesoderm.
(A-A′′′) FoxA2-1 is expressed throughout the notochord, as shown by whole-mount in situ hybridization in dorsal (A) and lateral (A′) views and in situ hybridization in cryostat transversal sections (A′′,A′′′). (B-B′′′) Nk2.1 mRNA is expressed throughout the entire floor plate, as observed in dorsal (B) and lateral (B′) views, and in cryostat transversal sections (B′′,B′′′). Insets in (B) and (B′) show the combined FoxA2-1 and Nkx2.1 expression patterns using pseudocolors, indicating that Nkx2.1 is expressed above the notochord but does not reach its rostral boundary. (C-C′′′) Hh mRNA is detected in most of the floor plate, with exception of the rostral-most portion (hypothalamo-prethalamic primordium [HyPTh] floor plate) as observed in dorsal (C) and lateral (C') views, and in cryostat transversal sections (C′′, C′′′). (D-D′′′) Gsc expression is observed in different rostro-caudal patches in dorsal (D) and lateral (D′) views and in cryostat transversal sections (D′′, D′′′). E-J) Detailed analysis of the rostral end of the notochord using whole-mount data at 18 h post fertilization (hpf) and 21 hpf stages further supports that FoxA2-1 (E,F) is present throughout the entire length of the notochord; IrxB (G) and Hh (H,I) are absent rostrally and expressed caudally, and Six3/6 (I) is expressed only in the rostral tip. (K,L) The rostral molecular code (Six3/6 and FoxA2-1 positive, but IrxB and Hh negative) is summarized in dorsal (K) and lateral (L) schematic representations. In cryostat sections, asterisks mark somites, and arrowheads indicate neural expression; red and green dotted lines delineate the notochord and neural plate, respectively. Abbreviations: np, neural plate; ec, ectoderm; en, endoderm; n, notochord; fp, floor plate; am, axial mesoderm. Scale bar: 50 μm.
Fig 3
Fig 3. Three major molecular anteroposterior (AP) regions are observed in the incipient amphioxus neural tube.
(A) Whole-mount in situ hybridization of chicken Otx2 at Hamburger–Hamilton 5 (HH5) stage. (B,C) Expression of amphioxus Otx at 21 h post fertilization (hpf) in dorsal (B) and lateral (C) views. (D) Whole-mount in situ hybridization of chicken Gbx2 at HH5 stage. (E,F) Expression of amphioxus Gbx at 21 hpf in dorsal (E) and lateral (F) views. G) Whole-mount in situ hybridization of chicken Fezf2 at HH5 stage. (H,I) Expression of amphioxus Otx at 21 hpf in dorsal (H) and lateral (I) views. (J) Schematic representation of HH5 chicken neural plate with the archencephalic prototagma (ARCH) and deuteroencephalic prototagma (DEU) domains depicted. The boundary between ARCH and DEU correspond to the border between Otx2 and Gbx2 expression patterns (A,D). (K,L) Double chromogenic in situ hybridization combining amphioxus Fezf and Gbx probes in dorsal (K) and lateral (L) views, showing two subdivisions in the amphioxus ARCH territory: a rostral hypothalamo-prethalamic primordium (HyPTh) domain (Fezf and Otx positive) and a caudal Di-Mesencephalic primordium (DiMes) domain (Fezf negative and Otx positive) (L′). (M) Schematic representation of the three major AP subdivisions in the amphioxus central nervous system (CNS) at the 21 hpf stage and the relative expression of their key markers. (N,O) Single chromogenic in situ hybridization with an amphioxus IrxB probe in dorsal (N) an lateral (O) views. Insets in B, E, H, K, and N depict the neural components of the corresponding gene expression patterns. Arrowheads mark the ARCH–DEU boundary, and asterisks mark the corresponding limit at the notochord level, based on Gbx expression. Abbreviations: n, notochord. Scale bar: 50 μm.
Fig 4
Fig 4. Genoarchitectonic signature of the Di-Mesencephalic primordium (DiMes).
(A-A′′) Combined Fezf-Gbx expression defines a gap of expression in the caudal archencephalic prototagma (ARCH), identified as the DiMes (as per Fig 3K and 3L, for reference). (B-E′′) Whole-mount chromogenic in situ hybridization of Pax4/6 (B-B′′) or Six3/6 (D-D′′) alone or each one combined with Gbx in a double in situ hybridization (C-C′′ and E′-E′′, respectively) reveal that both genes are expressed in the DiMes domain. The two arrowheads in (D) indicate the expression of Six3/6 in Rostral-hypothalamo–prethalamic primordium (Rostral-HyPTh). (F-F′′) Pou3f is highly expressed in DiMes but with a decreased signal in the Rostral-HyPTh and Intermediate-HyPTh primordia and in some areas of the deuteroencephalic prototagma (DEU). (G-G′′) Ebf mRNA was detected in the DiMes and DEU domains. (H-H′′) Sim neural expression was observed exclusively in the DiMes domain at the analyzed stage. Expression patterns correspond to lateral (A-H) or dorsal views (A′-H′) at the 21 h post fertilization (hpf) embryonic stage and are represented in schematics dorsal views (A′′-H′′). Somites (dotted lines) were used as main landmarks to localize the position of the patterns analyzed in the late neural plate. Scale bar: 50 μm.
Fig 5
Fig 5. Genoarchitectonic signatures of the hypothalamo-prethalamic primordium (HyPTh) (I).
(A-A′′) Combined Fezf-Gbx expression defines a Fezf-positive rostral archencephalic prototagma (ARCH) territory identified as HyPTh (as per Fig 3K and 3L, for reference). (B-B′′) Rx is specifically expressed throughout the entire HyPTh primordium. (C-C′′) Neural expression of FoxD was detected only in the basal and floor plates of HyPTh. (D-E′′) Nkx2.2 is expressed in the Rostral-HyPTh and Interm-HyPTh domains but not in Caudal-HyPTh (D-D′′), as observed by a large gap in a double in situ hybridization for Nkx2.2 and Gbx (E-E′′). (F-G′′) Similarly, Meis mRNA is only detected in the basal plate of the Rostral and Intermediate domains of HyPTh (F-F′′), leaving a gap of expression when combined with IrxC (G-G′′). Further expression of Meis is also detected in specific deuteroencephalic prototagma (DEU) areas (F-F′′). (H-H′′) Lef is expressed in the basal plate of Rostral-HyPTh and Interm-HyPTh. Expression patterns correspond to lateral (A-H) or dorsal views (A′-H′) at the 21 h post fertilization (hpf) embryonic stage and are represented in schematics dorsal views (A′′-H′′). Somites (dotted lines) were used as main landmarks to localize the position of the patterns analyzed in the late neural plate. Scale bar: 50 μm.
Fig 6
Fig 6. Genoarchitectonic signatures of the hypothalamo-prethalamic primordium (HyPTh) (II).
(A-A′′) IrxA mRNA expression is observed from the HyPTh/Di-Mesencephalic primordium (DiMes) boundary extending caudally to the rostral portion of the Rhombencephalo-Spinal primordium (RhSp) domain. (B-B′′) IrxC mRNA expression is observed from the HyPTh/DiMes boundary, extending caudally to the rostral portion of the RhSp domain. (C-D′′) Lhx2/9b marks the alar plate in the Rostral-HyPTh and Intermediate-HyPTh domains (C-C′′), as shown by a gap of expression in a double in situ hybridization between Lhx2/9b and IrxC (D-D′′). The lateral view of Six3/6 expression (inset in C) is provided for comparison with Lhx2/9b and highlights the restricted expression of Six3/6 to the Rostral-HyPTh (compare the region between the arrow and the single arrowhead, which corresponds to the Rostral-HyPTh and Intermediate-HyPTh domains, with the region between the arrow and double arrowhead, which includes only the Rostral-HyPTh domain (C,C′)). On the other hand, a dorsal view of Fezf (inset in C′) shows expression across both the alar and basal plates of the HyPTh. (E,E′′) Lhx1/5 mRNA expression is observed only in the basal plate of the HyPTh and DiMes primordia and in some RhSp subdivisions (see inset in C′ for comparison). (F-F′′) Otp is a key hypothalamic marker in vertebrates but was only found in amphioxus in one domain at the RhSp region. (G-H′′) Wnt3 and Wnt7 mRNAs were detected from the DiMes/RhSp border, extending caudally in the entire RhSp region. Expression patterns correspond to lateral (A-G) or dorsal views (A′-G′) at the 21 h post fertilization (hpf) embryonic stage and are represented in schematics dorsal views (A′′-G′′). Somites (dotted lines) were used as main landmarks to localize the position of the patterns analyzed in the late neural plate. Scale bar: 50 μm.
Fig 7
Fig 7. Genoarchitectonic signatures of the Rhombencephalo-Spinal primordium (RhSp).
(A-C′′). Hox1, Hox3, and Hox6 were expressed in the alar and basal plates of some caudal domains of the RhSp region in a sequential rostro-caudal order. (D-D′′) Nkx6 was detected at different degrees of expression mainly at the floor plate of the Di-Mesencephalic primordium (DiMes) and RhSp domains and a localized bilateral spot at the equivalent position of the fifth somite. (E-E´´) FoxB mRNA was observed extending caudally from the DiMes/RhSp border into the basal plate of the entire RhSp region. (F-G´´) Pax2/5/8 and Msx mRNAs were detected in some patches in the alar plate of the RhSp region. Expression patterns correspond to lateral (A-G) or dorsal views (A′-G′) at the 21 h post fertilization (hpf) embryonic stage, and are represented in schematics dorsal views (A′′-G′′). Somites (dotted lines) were used as main landmarks to localize the position of the patterns analyzed in the late neural plate. Scale bar: 50 μm.
Fig 8
Fig 8. Precise genetic boundaries define three major anteroposterior (AP) partitions.
(A-B′′) Triple fluorescent in situ hybridization combining Fezf-Pax4/6-Gbx in lateral (A) and dorsal views (A′) reveals clear-cut boundaries between the hypothalamo–prethalamic primordium (HyPTh) Fezf+, the Di-Mesencephalic primordium (DiMes) Pax4/6+, and the Rhombencephalo-Spinal primordium (RhSp) Gbx+ regions; details are summarized in a 3-D reconstruction (B,B′). A magnified view of Pax4/6 expression combined with DAPI showed that the DiMes domain consists of two rows of cells along the AP axis (asterisks)(A′′,B′′). (C-C′′) Triple fluorescent in situ hybridization combining Fezf-Six3/6-Gbx probes in lateral (C) and dorsal views (C′) confirms a rostral Fezf+ domain (HyPTh), a caudal Gbx+ domain (RhSp), and a double-negative domain in between characterized by Six3/6 expression (DiMes). A magnified view (C′′) helps to visualize a rostral domain with Six3/6 and Fezf coexpression (yellow staining, arrow) that we identified as the Rostral-HyPTh domain. (D-D′′) Double fluorescent in situ hybridization combining Rx and IrxB probes in lateral (D) and dorsal views (D´) show that Rx is expressed in the entire HyPTh territory, stopping caudally at the HyPTh/DiMes boundary; details can be observed in the magnified view (D′′). (E-E′′) Double fluorescent in situ hybridization combining FoxD and Pax4/6 probes in lateral (E), dorsal (E′), and magnified dorsal (E′′) views shows that the small territory expressing FoxD corresponds to the basal plate of the entire HyPTh primordium, stopping caudally at the DiMes border. (F-F′′) Double fluorescent in situ hybridization combining Nk2.2 and IrxB probes in lateral (F), dorsal (F′), and magnified dorsal (F′′) views determines that Nk2.2 is expressed only in the alar and basal plate of the Rostral-HyPTh and Intermediate-HyPTh domains, leaving a negative gap corresponding to the Caudal-HyPTh domain. (G-G′) Double fluorescent in situ hybridization combining Pax3/7 and Gbx probes identifies patches of Pax3/7 expression in the Caudal-HyPTh domain. (H,H′) Double fluorescent in situ hybridization combining Nkx2.1 and IrxB probes shows that Nk2.1 expression in the floor plate extends rostrally beyond the HyPTh/DiMes boundary. Scale bar in A-H′: 50 μm except A′′ and B′′, scale bar: 5 μm.
Fig 9
Fig 9. Schematic representation of informative markers used in this study.
(A) Main tagmata and Hypothalamo-Prethalamic (HyPTh), Di-Mesencephalic (DiMes), and Rhombencephalo-Spinal (RhSp) primordia. (B) HyPTh internal subdivisions. (C) RhSp internal subdivisions.
Fig 10
Fig 10. Genoarchitectonic model of the developing central nervous system (CNS) at the amphioxus 7-somite neurula stage.
(A) Summary of all identified anteroposterior (AP) and dorsoventral (DV) partitions of the neural plate of amphioxus. (B-B′′) Topological comparison of major molecular subdivisions between cephalochordates and vertebrates. (C,C′) Neural plate model highlighting the basal and alar plates of Rostral-hypothalamo–prethalamic primordium (Rostral-HyPTh) (orange) and the whole floor plate domain (gray) and its correspondence in a late larval stage (adapted from [90]). (C′′) Vertebrate neural tube highlighting the Terminal-Hypothalamic prosomere (orange) and the whole floor plate (grey).
Fig 11
Fig 11. Experimental disruption of secondary organizers in vertebrates results in a Di-Mesencephalic primordium (DiMes)-like remnant.
(A-C) A schematic representation of mouse Pax6 neural expression pattern (solid grey) in wild-type condition (WT) (A) and abolishing the function of the zona limitans intrathalamica (ZLI) (B) or isthmic organizers (IsO) (C). (B′-B′′′′) Drawings adapted from the results of Hirata et al. 2006 upon ZLI abrogation during mouse development. (C′-C′′) Immunohistochemical detection of αPax6. (C′′′-C′′′′) In situ hybridizations for Otx. (C′) and (C′′′) are WT expression domains of Pax6 and Otx, whereas (C′′) and (C′′′′) are conditional En2-Fgf8 knockout (KO) mice. (D,E) Schematic representation of pax6a gene expression (solid grey) in zebrafish embryos in WT (D) or quadruple morpholino knockdown (4MO) of otx1a, otx2, eng2a, and eng2b (E) conditions. (F) Quantification of the phenotypes observed upon 4MO treatment. All treated embryos showed a reduction in the size of the gap, even those scored as normal (indicated by an asterisk). Embryos with “reduced pax6a gap” showed only a very small expression gap, often with weak pax6a expression in it. Embryos with “no pax6a gap” had a continuous expression of the gene. (G-N) Expression patterns of key genes in WT (G-J) or 4MO (K-N) embryos. Insets in H and L showed sagittal sections of a different representative embryo. Sections of the indicated embryos. Abbreviations: Cer, cerebellum; D, diencephalon; Rh, rhombencephalon; pc, posterior commissure; pTh, prethalamus; Th, thalamus; PT, pretectum; MB, midbrain; MHB, midbrain–hindbrain boundary; T, telencephalon. Anterior is to the left. Scale bar = 100 μm.

Similar articles

Cited by

References

    1. Nieuwenhuys R, Puelles L. Towards a New Neuromorphology. Cham: Springer International Publishing; 2016.
    1. Puelles L, Martinez-de-la-Torre M, Bardet SM, Rubenstein JLR. Hypothalamus In: Watson C, Paxinos G, Puelles L, editors. The mouse neurvous system, London, San Diego, CA: Academic Press/Elsevier; 2012, p. 221–312.
    1. Puelles L. Plan of the Developing Vertebrate Nervous System In: Rubenstein JLR, Rakic P, editors. Pattering and Cell Type Specification in the Developing CNS and PNS, vol. 1, Amsterdam: Academic Press; 2013, p. 187–209.
    1. Puelles L, Rubenstein JLR. A new scenario of hypothalamic organization: rationale of new hypotheses introduced in the updated prosomeric model. Front Neuroanat 2015;9:27 doi: 10.3389/fnana.2015.00027 - DOI - PMC - PubMed
    1. Hidalgo-Sánchez M, Millet S, Bloch-Gallego E, Alvarado-Mallart RM. Specification of the meso-isthmo-cerebellar region: The Otx2/Gbx2 boundary. Brain Res Rev 2005;49:134–49. doi: 10.1016/j.brainresrev.2005.01.010 - DOI - PubMed

Publication types

MeSH terms