. 2017 Apr 19;13(4):e1006734.
doi: 10.1371/journal.pgen.1006734. eCollection 2017 Apr.

The ESCRT regulator Did2 maintains the balance between long-distance endosomal transport and endocytic trafficking

Affiliations

The ESCRT regulator Did2 maintains the balance between long-distance endosomal transport and endocytic trafficking

Carl Haag et al. PLoS Genet. .

Abstract

In highly polarised cells, like fungal hyphae, early endosomes function in both endocytosis as well as long-distance transport of various cargo including mRNA and protein complexes. However, knowledge on the crosstalk between these seemingly different trafficking processes is scarce. Here, we demonstrate that the ESCRT regulator Did2 coordinates endosomal transport in fungal hyphae of Ustilago maydis. Loss of Did2 results in defective vacuolar targeting, less processive long-distance transport and abnormal shuttling of early endosomes. Importantly, the late endosomal protein Rab7 and vacuolar protease Prc1 exhibit increased shuttling on these aberrant endosomes suggesting defects in endosomal maturation and identity. Consistently, molecular motors fail to attach efficiently explaining the disturbed processive movement. Furthermore, the endosomal mRNP linker protein Upa1 is hardly present on endosomes resulting in defects in long-distance mRNA transport. In conclusion, the ESCRT regulator Did2 coordinates precise maturation of endosomes and thus provides the correct membrane identity for efficient endosomal long-distance transport.


Conflict of interest statement

The authors have declared that no competing interests exist.

Figures
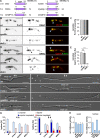
Fig 1
Fig 1. Deletion of did2 causes defects in hyphal growth.
(A) Comparison of amino acid sequence identity (>92% query coverage; BLASTp) [35] and domain architecture (SMART) [36] of ESCRT regulators Did2 and Vps60. All proteins belong to the family of Snf7 proteins (PFAM; PF03357; for accession numbers, see Materials and Methods). (B) Fluorescence micrographs of yeast cells (inverted images, left) ectopically expressing Prc1 C-terminally fused to mCherry (Prc1C, left). The amino acid sequence of S. cerevisiae Prc1p exhibits 41% identity to U. maydis Prc1 (79% query coverage). Vacuoles were stained with CMAC (centre). An overlay is shown on the right (arrowheads indicate vacuoles; size bar, 10 μm). (C) Bar chart depicting co-localization of lumenal Prc1C with CMAC-stained vacuoles (d≥1 μm). (n = 3 independent experiments; at least 39 vacuoles/strain per experiment were analysed). (D) Fluorescence micrographs of yeast cells (inverted image) ectopically expressing Cps1 C-terminally fused to mCherry (Cps1C). Cps1p from S. cerevisiae exhibits 39% identity to Cps1 from U. maydis (87% query coverage). Vacuoles were stained with CMAC (centre). An overlay is shown on the right (arrowheads indicate vacuoles, arrows mark nuclear-associated ER; size bar, 10 μm). (E) Bar chart depicting co-localization of lumenal Cps1C with CMAC-stained vacuoles (d≥1 μm; error bars, s.d.; n = 3 independent experiments, at least 44 vacuoles/strain per experiment were analysed; ***, p<0.001; ns, not significant; unpaired two-tailed t-test). (F) Growth of AB33 derivates four and nine hours post induction of filamentous growth (4 and 9 h.p.i., basal septae and growth direction are marked by asterisks and arrows, respectively; size bar, 10 μm). (G) Percentage of hyphae (4 and 9 h.p.i.): quantification of unipolarity, bipolarity and septum formation (error bars, s.e.m.; n = 3 independent experiments, > 100 hyphae/strain were counted per experiment). (H) Measurement of extracellular Cts1 activity in yeast cells and hyphae ([31]; error bars, s.e.m.; n = 3 independent experiments).
Fig 2
Fig 2. Endosomal localisation of Did2 is independent of Rrm4.
(A) Fluorescent micrograph and corresponding kymograph of a hypha (6 h.p.i.) expressing Did2G. Bidirectional movement of signals is shown as diagonal lines (yellow arrowhead; size bar, 10 μm; S1 Video). (B) Dynamic co-localisation study of Did2G (left) with FM4-64 (right). Fluorescence signals were detected simultaneously using dual colour imaging. Processive co-localising signals are marked by yellow arrowheads, corralled signals by red arrowheads. Position of hyphal tips are marked by asterisks. (C-D) Co-localisation studies of Did2G with Rab5aC (C) and Rrm4C (D). Fluorescence micrographs were acquired by dual color imaging. The boxed areas are shown enlarged with the Gfp- and mCherry-signal, as well as an overlay of both images. Co-localising signals are marked by arrowheads (for corresponding kymographs, see S5A and S5B Fig). (E) Percentage of signals of the respective endosomal marker exhibiting co-localisation with Did2G (error bars, s.e.m.; n = 3 independent experiments; 6 hyphae/ strain were analysed). (F) Kymographs of hyphae expressing Cdc3G in the rrm4 wildtype background (left) and rrm4Δ (right). (G) Kymographs of hyphae expressing Did2G in the rrm4 wildtype background (left) and rrm4Δ (right); processive signals are marked by yellow arrowheads, corralled signals by red arrowheads and static signals by blue arrowheads; hyphal tips are marked by asterisks). (H) Bar chart depicting amount of Did2G signals per 10 μm hyphae (error bars, s.e.m; n = 3 independent experiments; 10 hyphae/strain were analysed per experiment); *, p<0.05; ns, not significant (unpaired two-tailed t-test).
Fig 3
Fig 3. Rrm4-mediated endosomal mRNA transport is disturbed upon deletion of did2.
(A) Kymographs of hyphae (6 h.p.i) expressing Rrm4G in the did2 wildtype background (left) and did2Δ (right); processive signals are marked by yellow arrowheads and corralled signals by red arrowhead; hyphal tips are marked by asterisks; S2 Video). (B) Bar chart depicting the amount of Rrm4G signals per 10 μm hyphae (error bars, s.e.m.; N = 15 for wildtype hyphae and 16 for did2Δ hyphae, derived from four independent experiments were analysed, signals were scored as processive if run length > 5 μm; ***, p<0,001; unpaired two-tailed t-test). (C) Number of passing processive Rrm4G signals (run length > 5μm) over time at distinct regions within hyphae (error bar, s.e.m.; N = 15 for wildtype hyphae and 16 for did2Δ hyphae, derived from four independent experiments were analysed; ***, p<0.001; unpaired two-tailed t-test). (D) Bar chart depicting the velocity of processive Rrm4G signals (error bar, s.d.; see (B) for number of hyphae analysed, n = 4 independent experiments, at least three hyphae/strain, corresponding to at least 24 signals, were analysed per experiment; ns, not significant; unpaired two-tailed t-test). (E) Kymographs of hyphae (6 h.p.i) expressing Upa1G (did2 wildtype allele left and did2Δ right; processive signals are marked by yellow arrowheads; hyphal tips are marked by asterisks). (F) Hyphal tip of strains expressing Cdc3G (wildtype and did2Δ allele are compared at the top and bottom, respectively, tip gradients are marked by arrow heads; size bar 5 μm). False colour image of maximum projection of acquired z stacks (black/blue, low to red/white high intensities).
Fig 4
Fig 4. Loss of Did2 causes defects in processive endosomal movement.
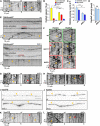
(A) Kymographs of hyphae (6 h.p.i) expressing Rab5aG in did2 wildtype background (left) and did2Δ (right); processive signals are marked by yellow arrowheads and corralled signals by red arrowheads; hyphal tips are marked by asterisks, S3 Video). (B) Bar chart depicting the amount of Rab5aG signals per 10 μm hyphae (error bars, s.e.m..; N = 20 wildtype hyphae and 18 did2Δ hyphae derived from four independent experiments, signals were scored as processive if run length > 5 μm; *** p<0,001; unpaired two-tailed t-test). (C) Number of passing processive Rab5aG signals (run length > 5μm) over time at distinct regions within hyphae (error bar, s.e.m.; number of hyphae analysed given in (B);. ** p<0.01; *** p<0.001; unpaired two-tailed t-test). (D) Bar chart depicting the velocity of processive Rab5aG signals (error bar, s.d.; number of hyphae analysed given in (B), n = 4 independent experiments, at least three hyphae/strain, corresponding to at least 68 signals, were analysed per experiment; ns, not significant, unpaired two-tailed t-test). (E) Fluorescence micrographs of strain expressing photoactivatable Rab5a-paG3 before and after photoactivation (red line). Corresponding micrograph recorded after photoactivation is shown below (wildtype allele of did2 top panel, did2Δ bottom panel; size bar 10 μm; S4 Video). (F) Dynamic co-localisation studies of Rrm4G (left) with Rab5aC (C, right). Fluorescence signals were detected simultaneously using dual colour imaging. Processive co-localizing signals and corralled signals are marked by yellow and red arrowheads, respectively. For better comparison, kymographs depicting normal movement are framed in green and those with aberrant movement in red. (G-H) Kymographs of hyphae (6 h.p.i) expressing Yup1CM (G) and PhoxG (H) in thedid2 wildtype background (left) and did2Δ (right); processive signals are marked by yellow arrowheads and corralled signals by red arrowhead; hyphal tips are marked by asterisks. (I-J) Fluorescence micrographs of hyphae expressing Vps27G (I) and Vps4G (J) in the did2 wildtype background (top) and did2Δ (bottom). Vps27G and Vps4G-particles are marked by yellow arrowheads; size bar 10 μm. (K-L) Kymographs of hyphae (6 h.p.i) expressing Vps27G (K) and Vps4G (L) in the did2 wildtype background (left) and did2Δ (right); processive signals are marked by yellow arrowheads and corralled signals by red arrowhead; hyphal tips are marked by asterisks.
Fig 5
Fig 5. Endosomal association of the motor proteins Kin3 and Dyn2G is altered upon loss of Did2.
(A) Kymographs of hyphae (6 h.p.i) expressing Kin3G3 in the did2 wildtype backround (left) and did2Δ (right); processive signals are marked by yellow arrowheads; hyphal tips are marked by asterisks; S5 Video). (B) Kymographs of hyphae (6 h.p.i) expressing Dyn2G3 in the did2 wildtype background (left) and did2Δ (right); processive signals are marked by yellow arrowheads; hyphal tips are marked by asterisks. (C) Fluorescence micrograph in false colours (black/blue, low to red/white high intensities) of strains expressing Dyn2G3 in the did2 wildtype background (top) and did2Δ (bottom); size bar, 10 μm). (D) Measurement of Dyn2G3-fluorescence at hyphal tips. Dots represent individual measurements of Dyn2G3-fluorescence (total fluorescence—background) within a defined area at hyphal tips. The red line denotes the median. Tip accumulation was measured in N = 27 hyphae per strain derived from three independent experiments (arbitrary units are given; *** p>0.001; unpaired two-tailed t-test). (E) Maximum projection of z stacks in false colours (black/blue, low to red/white high intensities) of strains expressing Rab5aG (top), Yup1CM (centre) and Rrm4G (bottom) in thedid2 wildtype background (left) and did2Δ (right; size bar, 10 μm). (F) Percentage of hyphae exhibiting tip accumulation of respective proteins (error bars, s.d., n = 3 independent experiments; > 100 hyphae per strain were analysed per experiment, ** p<0.01; *** p<0.001; ns, not significant, unpaired two-tailed t-test).
Fig 6
Fig 6. Endosomal maturation is disturbed in did2Δ hyphae.
(A) Dynamic co-localisation studies of Rab5aC (left) and Rab7G (right). Fluorescence signals were detected simultaneously using dual colour imaging. Processive co-localizing signals are marked by arrowheads in the respective kymographs (hyphal tips are marked by asterisks). Strain with wildtype allele of did2 (top) is compared to did2Δ strain (bottom). (B) Fluorescence micrograph in false colours (black/blue for low to red/white for high signal intensity) of strains expressing Rab5aC (left) and Rab7G (right) in the did2 wildtype background (top) and did2Δ (bottom; size bar, 10 μm). (C) Bar chart depicting the percentage of Rab7-positive hyphal tips (error bars, s.e.m; n = 3 independent experiments; >100 hyphae per strain analysed per experiment; *** p<0.001 (unpaired two-tailed t-test). (D) Fluorescence micrographs of hyphae expressing Rab5aC and Rab7G before and after bleaching for improved detection of processive signals. Corresponding kymographs recorded after bleaching are shown below; wildtype allele of did2 on the left and did2Δ on the right). Fluorescence signals of dynamic co-localisation studies were detected simultaneously using dual colour imaging (arrowheads indicate processive signals, size bar, 10 μm, S6 Video). (E) Bar chart depicting percentage of Rab7G-positive endosomes in the bleached area (error bars, s.d.; n = 3 independent experiments; 7 hyphae per strain were analysed per experiment); * p<0.05 (unpaired two-tailed t-test). (F) Kymographs of hyphae (6 h.p.i) expressing Prc1C in the did2 wildtype background (left) and did2Δ (right); processive signals are marked by yellow arrowheads. Note that the empty area on the left corresponds to the nuclear region, which was chosen for better visibility of processive signals; hyphal tips are marked by asterisks; S7 Video). (G) Bar chart depicting amount of Prc1C signals per 10 μm hyphae (error bars, s.d.; N = 12 for wildtype and 14 for did2Δ hyphae were analysed, signals were scored as processive if run length > 5 μm; *** p<0.001 unpaired two-tailed t-test). (H) Bar chart depicting the velocity of processive signals (error bar, s.d.; number of hyphae given in G, corresponding to 30 signals in wildtype hyphae and more than 100 signals in did2Δ hyphae).
Fig 7
Fig 7. Did2 coordinates endosomal long-distance transport and endocytic trafficking.
(A) The model at the top depicts two seemingly independent main functions of early endosomes (EE) that shuttle along microtubules. Long-distance transport involved in mRNA and septin transport on the left is compared to endocytic trafficking of e.g. vacuolar proteases on the right. At the bottom endosomal transport in the wildtype (B) is compared to transport events in the absence of ESCRT regulator Did2 (C). Note that loss of Did2 causes defects in maturation and changes the membrane identity (green area of EE). Therefore, Rab7 as well as cargo protein Prc1 is present more extensively on aberrant EEs, see text for further details.

Similar articles

Cited by

References

    1. Huotari J, Helenius A. Endosome maturation. EMBO J. 2011;30(17):3481–500. doi: 10.1038/emboj.2011.286 - DOI - PMC - PubMed
    1. Teis D, Saksena S, Emr SD. SnapShot: the ESCRT machinery. Cell. 2009;137(1):182–e1. doi: 10.1016/j.cell.2009.03.027 - DOI - PubMed
    1. Hanson PI, Cashikar A. Multivesicular body morphogenesis. Annu Rev Cell Dev Biol. 2012;28:337–62. doi: 10.1146/annurev-cellbio-092910-154152 - DOI - PubMed
    1. McCullough J, Colf LA, Sundquist WI. Membrane fission reactions of the mammalian ESCRT pathway. Annu Rev Biochem. 2013;82:663–92. doi: 10.1146/annurev-biochem-072909-101058 - DOI - PMC - PubMed
    1. Hurley JH. ESCRTs are everywhere. EMBO J. 2015;34(19):2398–407. doi: 10.15252/embj.201592484 - DOI - PMC - PubMed

MeSH terms

Substances

LinkOut - more resources