

Accurate phenotyping: Reconciling approaches through Bayesian model averaging
- PMID: 28423058
- PMCID: PMC5396931
- DOI: 10.1371/journal.pone.0176136
Accurate phenotyping: Reconciling approaches through Bayesian model averaging
Abstract
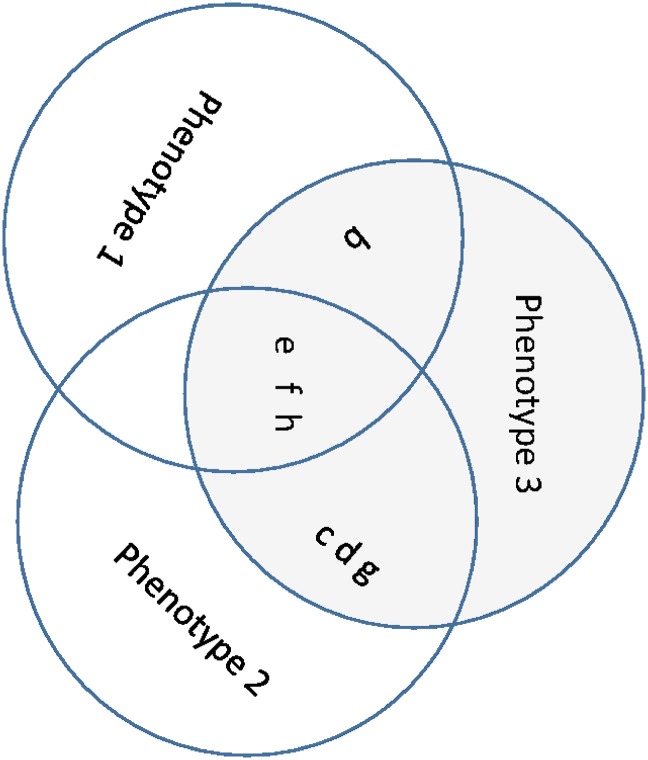
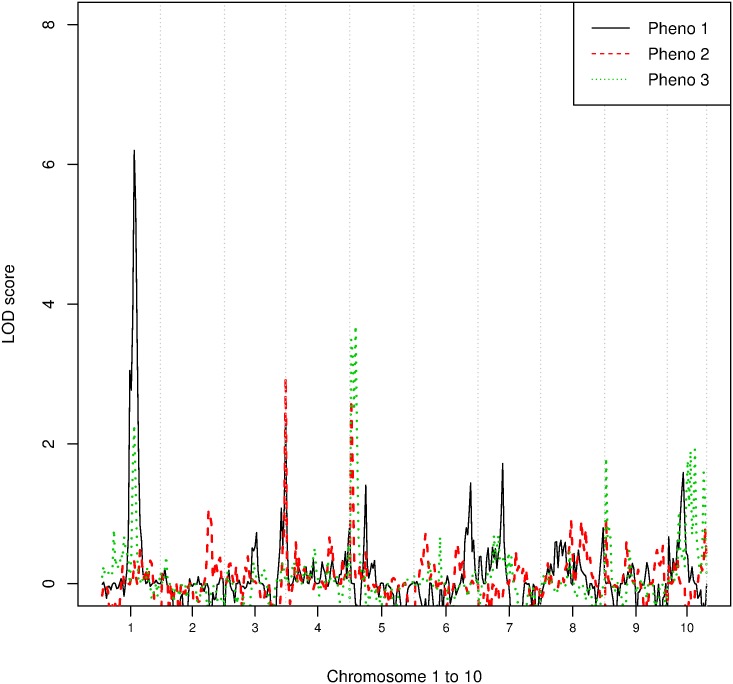
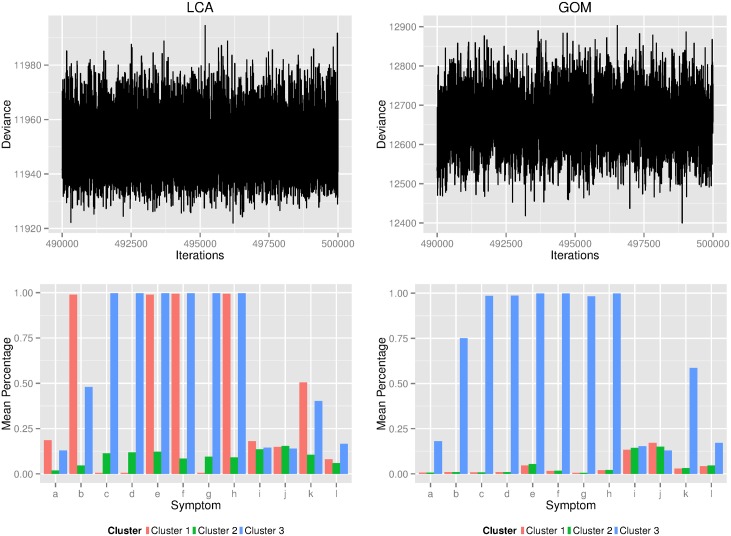
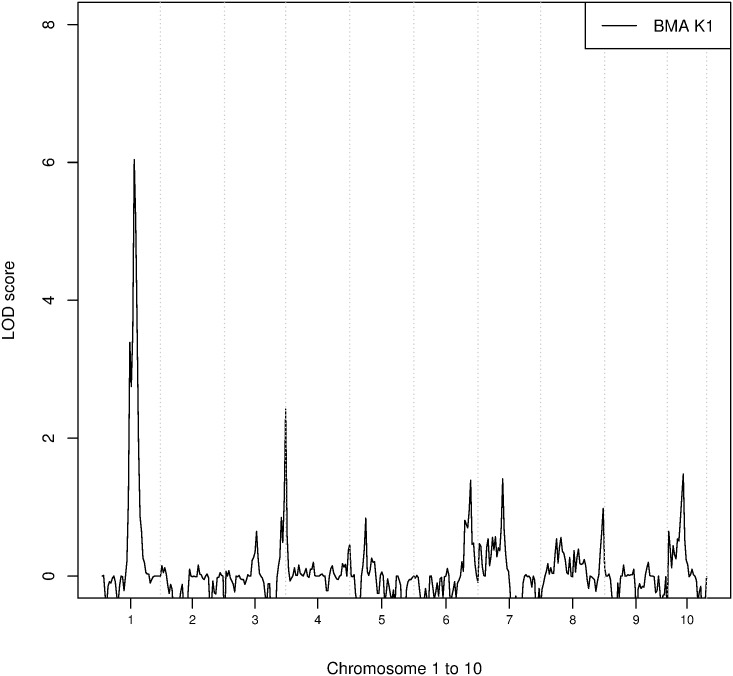
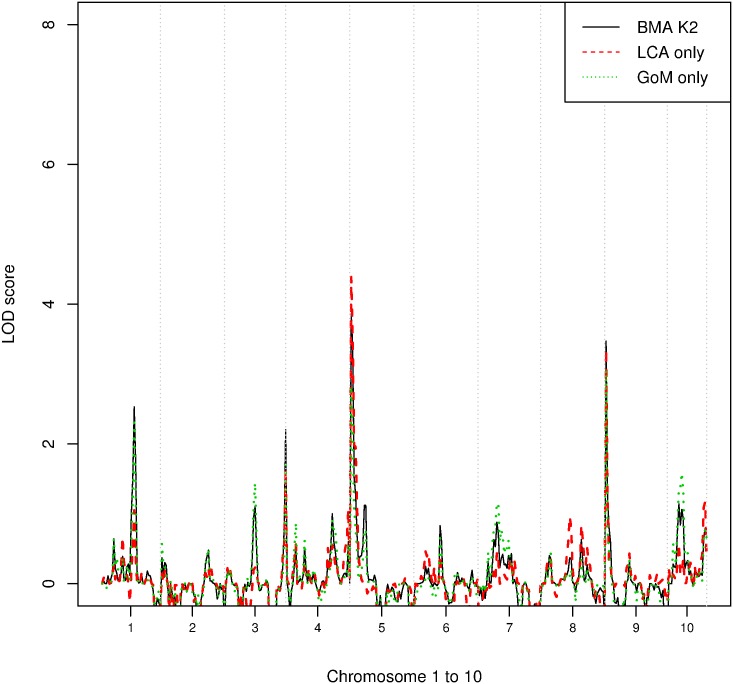
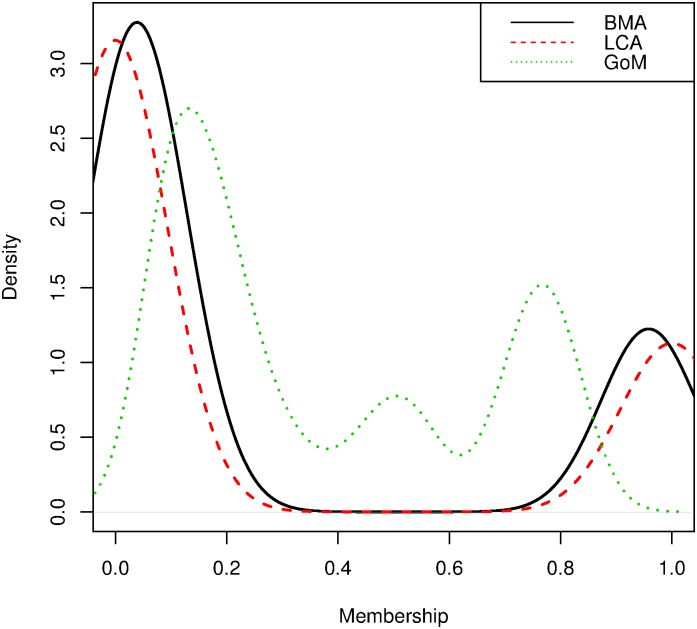
Genetic research into complex diseases is frequently hindered by a lack of clear biomarkers for phenotype ascertainment. Phenotypes for such diseases are often identified on the basis of clinically defined criteria; however such criteria may not be suitable for understanding the genetic composition of the diseases. Various statistical approaches have been proposed for phenotype definition; however our previous studies have shown that differences in phenotypes estimated using different approaches have substantial impact on subsequent analyses. Instead of obtaining results based upon a single model, we propose a new method, using Bayesian model averaging to overcome problems associated with phenotype definition. Although Bayesian model averaging has been used in other fields of research, this is the first study that uses Bayesian model averaging to reconcile phenotypes obtained using multiple models. We illustrate the new method by applying it to simulated genetic and phenotypic data for Kofendred personality disorder-an imaginary disease with several sub-types. Two separate statistical methods were used to identify clusters of individuals with distinct phenotypes: latent class analysis and grade of membership. Bayesian model averaging was then used to combine the two clusterings for the purpose of subsequent linkage analyses. We found that causative genetic loci for the disease produced higher LOD scores using model averaging than under either individual model separately. We attribute this improvement to consolidation of the cores of phenotype clusters identified using each individual method.
Conflict of interest statement
Figures
Similar articles
-
A Bayesian approach to replication of linkage findings.Genet Epidemiol. 1999;17 Suppl 1:S749-54. doi: 10.1002/gepi.13701707123. Genet Epidemiol. 1999. PMID: 10597525
-
The utility of Bayesian model averaging for detecting known oligogenic effects.Genet Epidemiol. 2001;21 Suppl 1:S789-93. doi: 10.1002/gepi.2001.21.s1.s789. Genet Epidemiol. 2001. PMID: 11793779
-
Mapping and Predicting Non-Linear Brassica rapa Growth Phenotypes Based on Bayesian and Frequentist Complex Trait Estimation.G3 (Bethesda). 2018 Mar 28;8(4):1247-1258. doi: 10.1534/g3.117.300350. G3 (Bethesda). 2018. PMID: 29467188 Free PMC article.
-
Passive-aggressive personality disorder: the demise of a syndrome.Psychiatry. 1999 Spring;62(1):49-59. doi: 10.1080/00332747.1999.11024851. Psychiatry. 1999. PMID: 10224623 Review.
-
A survey of current Bayesian gene mapping methods.Hum Genomics. 2004 Aug;1(5):371-4. doi: 10.1186/1479-7364-1-5-371. Hum Genomics. 2004. PMID: 15588497 Free PMC article. Review.
References
-
- Drewnowski A and Rock CL. The influence of genetic taste markers on food acceptance. Am J Clin Nutr 1995;62, 506–511 - PubMed
MeSH terms
Grants and funding
LinkOut - more resources
Full Text Sources
Other Literature Sources
