. 2017 Sep;152(1):52-64.
doi: 10.1111/imm.12747. Epub 2017 Jun 1.

Mesenteric lymph node CD11b- CD103+ PD-L1High dendritic cells highly induce regulatory T cells

Affiliations

Mesenteric lymph node CD11b- CD103+ PD-L1High dendritic cells highly induce regulatory T cells

Aya Shiokawa et al. Immunology. 2017 Sep.

Abstract

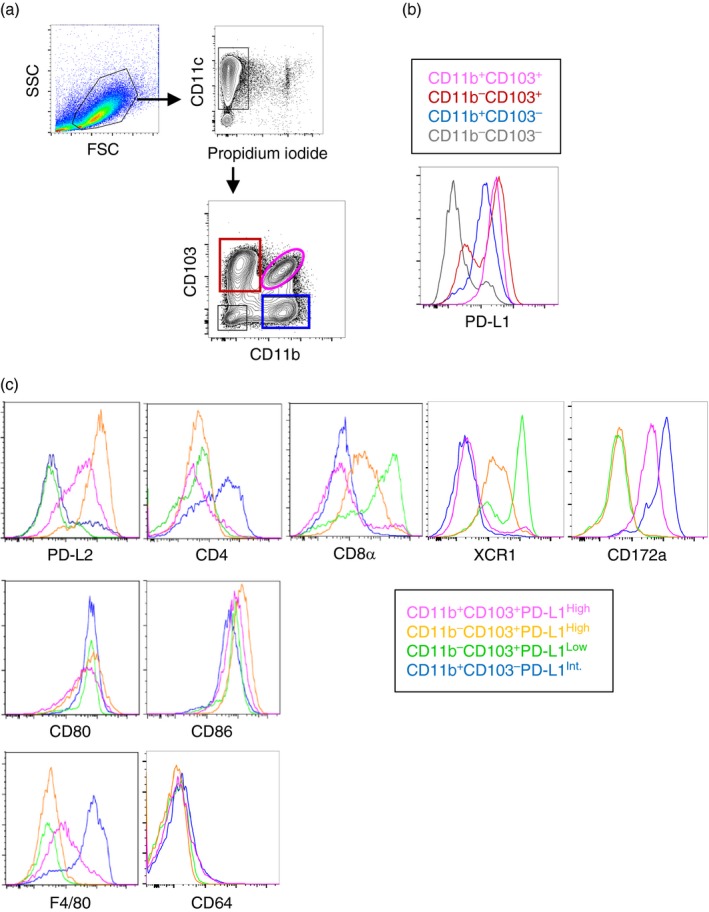
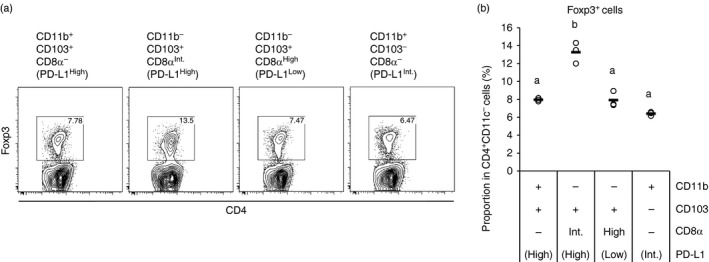
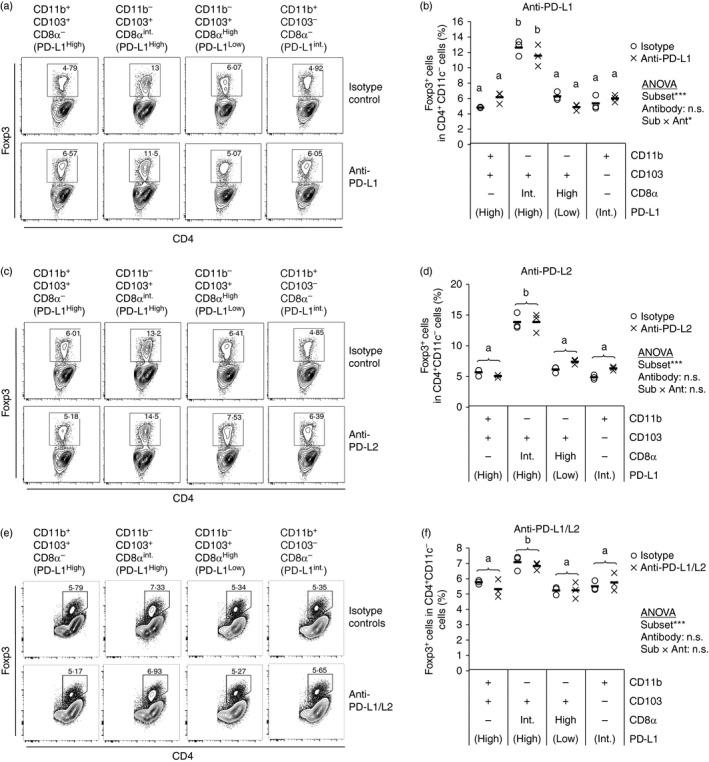
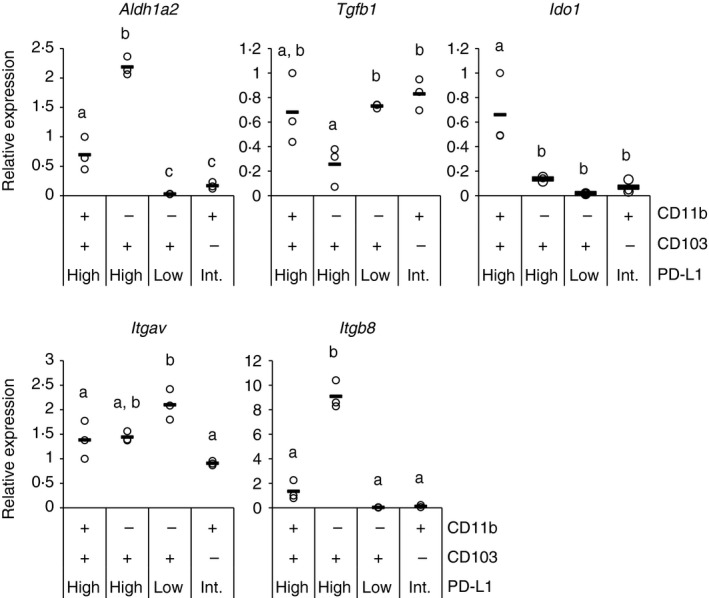
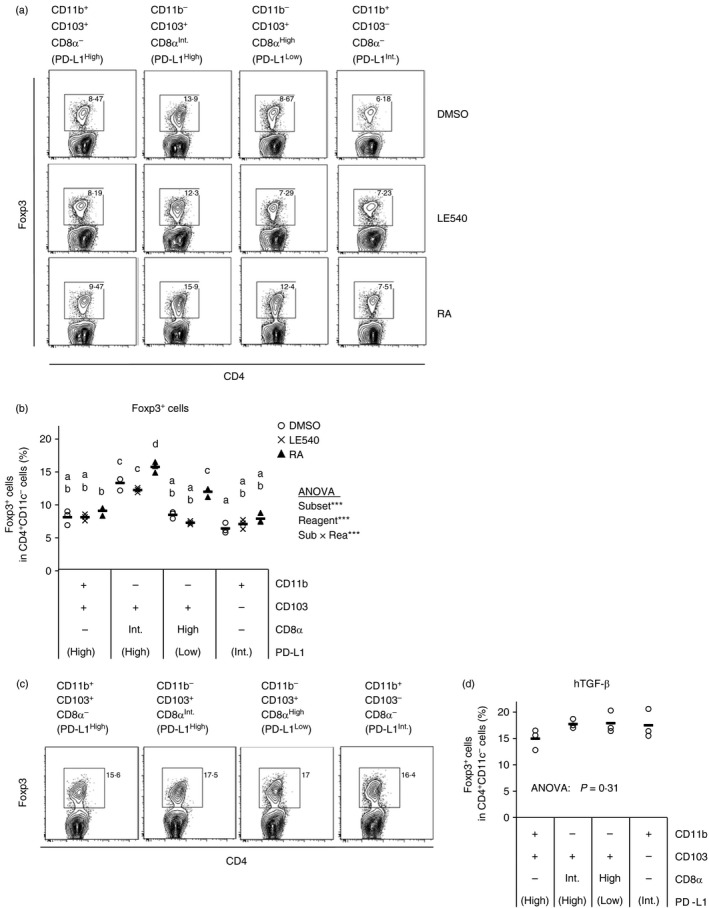
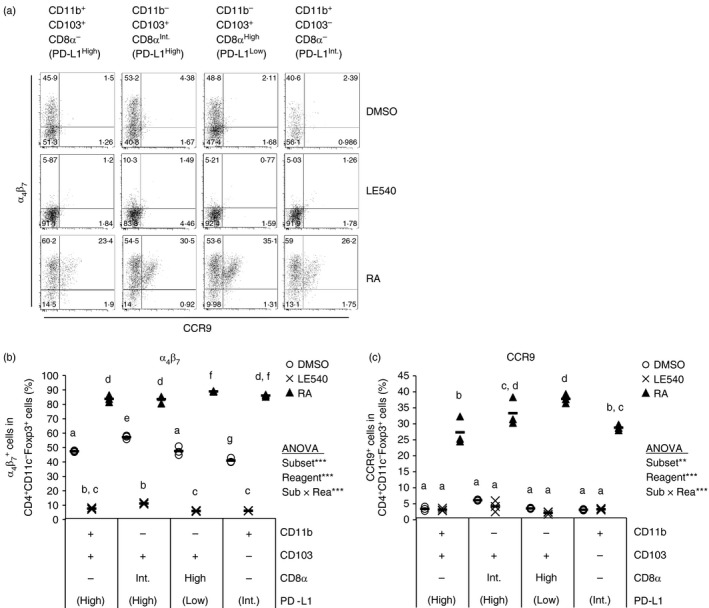
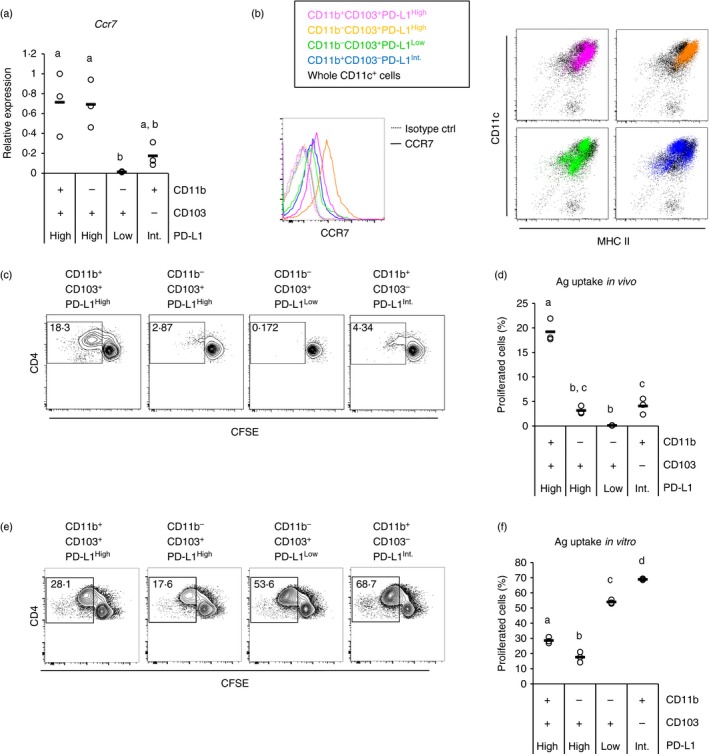
Dendritic cells (DCs) in mesenteric lymph nodes (MLNs) induce Foxp3+ regulatory T cells to regulate immune responses to beneficial or non-harmful agents in the intestine, such as commensal bacteria and foods. Several studies in MLN DCs have revealed that the CD103+ DC subset highly induces regulatory T cells, and another study has reported that MLN DCs from programmed death ligand 1 (PD-L1) -deficient mice could not induce regulatory T cells. Hence, the present study investigated the expression of these molecules on MLN CD11c+ cells. Four distinct subsets expressing CD103 and/or PD-L1 were identified, namely CD11b+ CD103+ PD-L1High , CD11b- CD103+ PD-L1High , CD11b- CD103+ PD-L1Low and CD11b+ CD103- PD-L1Int . Among them, the CD11b- CD103+ PD-L1High DC subset highly induced Foxp3+ T cells. This subset expressed Aldh1a2 and Itgb8 genes, which are involved in retinoic acid metabolism and transforming growth factor-β (TGF-β) activation, respectively. Exogenous TGF-β supplementation equalized the level of Foxp3+ T-cell induction by the four subsets whereas retinoic acid did not, which suggests that high ability to activate TGF-β is determinant for the high Foxp3+ T-cell induction by CD11b- CD103+ PD-L1High DC subset. Finally, this subset exhibited a migratory DC phenotype and could take up and present orally administered antigens. Collectively, the MLN CD11b- CD103+ PD-L1High DC subset probably takes up luminal antigens in the intestine, migrates to MLNs, and highly induces regulatory T cells through TGF-β activation.

Keywords: dendritic cells; intestinal immunity; mesenteric lymph nodes; oral tolerance; regulatory T cells.


Figures

Figure 1
Figure 1
Mesenteric lymph node (MLN) CD11c+ cells are classified into four subsets based on CD11b, CD103 and programmed death ligand 1 (PD‐L1) expression. Enriched MLN CD11c+ cells were analysed by flow cytometry. (a) CD11b and CD103 expression on live (propidium iodide) CD11c+ cells was analysed. (b) PD‐L1 expression on the four subsets in (a) was analysed. (c) Cell surface molecules on the four subsets expressing CD103 and/or PD‐L1 in (b) were analysed. The results are representatives of three independent experiments.
Figure 2
Figure 2
CD11b CD103+ PD‐L1High dendritic cells (DCs) highly induce regulatory T (Treg) cells. DO11.10 CD4+ T cells (5 × 10⁵ cells/ml) were co‐cultured with the indicated CD11c+ cell subsets (5 × 10⁴ cells/ml) in the presence of ovalbumin peptide (OVAp; 10 nm). After 3·5 days, the cells in each well were collected and were analysed by flow cytometry. Two independent experiments were performed. (a) CD4 and Foxp3 expression on CD4+ CD11c cells are shown. Data are from a representative well of each sample. (b) Proportions of Foxp3+ cells in CD4+ CD11c cells [gates shown in (a)] were analysed. The plot shows representative data from one experiment (n = 3). Circles and horizontal bars indicate data from one well and mean of results from three wells, respectively. Statistical analysis was performed by Tukey's honest significant difference test. Values not sharing a common letter are significantly different (P < 0·05).
Figure 3
Figure 3
Neither programmed death ligand 1 (PD‐L1) nor PD‐L2 is critical for regulatory T (Treg) cell induction by CD11b CD103+ PD‐L1High dendritic cells (DCs). DO11.10 CD4+ T cells (5 × 10⁵ cells/ml) were co‐cultured with the indicated CD11c+ cell subsets (5 × 10⁴ cells/ml) in the presence of ovalbumin peptide (OVAp; 10 nm) with anti‐PD‐L1 (a, b), anti‐PD‐L2 (c, d), or both anti‐PD‐L1 and anti‐PD‐L2 antibodies (e, f), and their isotype control antibodies (9 μg/ml). After 3·5 days, the cells in each well were collected and were analysed by flow cytometry. Two independent experiments were performed. (a, c, e) CD4 and Foxp3 expression on CD4+ CD11c cells are shown. Data are from a representative well of each sample. (b, d, f) Proportion of Foxp3+ cells in CD4+ CD11c cells [gates shown in (a), (c) and (e)] were analysed. The plot shows representative data from one experiment (n = 3). Symbols and horizontal bars indicate data from one well and mean of results from three wells, respectively. Statistical analysis was performed by two‐way analysis of variance and subsequent Tukey's honest significant difference test. Values not sharing a common letter are significantly different (P < 0·05). *P < 0·05, ***P < 0·001, n.s. (not significant): P ≥ 0·1.
Figure 4
Figure 4
CD11b CD103+ PD‐L1High dendritic cells (DCs) highly express RALDH2 and integrin β 8 genes. Relative gene expression of four indicated mesenteric lymph node (MLN) CD11c+ cell subsets was measured by quantitative PCR. cDNA from three independent experiments were analysed together, and relative values to expression in CD11b+ CD103+ PD‐L1High subset of one experiment are plotted. Circles and horizontal bars indicate data from one experiment and mean of data from the three experiments, respectively. Statistical analysis was performed by Tukey's honest significant difference test. Values not sharing a common letter are significantly different (P < 0·05).
Figure 5
Figure 5
Transforming growth factor‐β (TGF‐β) is a determinant factor for regulatory T (Treg) cell induction by mesenteric lymph node (MLN) dendritic cell (DC) subsets. DO11.10 CD4+ T cells (5 × 10⁵ cells/ml) were co‐cultured with the indicated CD11c+ cell subsets (5 × 10⁴ cells/ml) in the presence of ovalbumin peptide (OVAp; 10 nm) with LE540 (1 μm), retinoic acid (RA) (1 μm), DMSO (a, b), and human TGF‐β (2 ng/ml), (c, d). After 3·5 days, the cells in each well were collected and were analysed by flow cytometry. Two independent experiments were performed. (a, c) CD4 and Foxp3 expression on CD4+ CD11c cells are shown. Data are from a representative well of each sample. (b, d) Proportion of Foxp3+ cells in CD4+ CD11c cells [gates shown in (a) and (c)] were analysed. The plot shows representative data from one experiment (n = 3). Symbols and horizontal bars indicate data from one well and mean of results from three wells, respectively. Statistical analysis was performed by two‐way analysis of variance and subsequent Tukey's honest significant difference test. Values not sharing a common letter are significantly different (P < 0·05). ***P < 0·001.
Figure 6
Figure 6
α 4 β 7 and CCR9 on regulatory T (Treg) cells could be induced by retinoic acid (RA). DO11.10 CD4+ T cells (5 × 10⁵ cells/ml) were co‐cultured with indicated CD11c+ cell subsets (5 × 10⁴ cells/ml) in the presence of ovalbumin peptide (OVAp; 10 nm) with LE540 (1 μm), RA (1 μm) and DMSO. After 3·5 days, the cells in each well were collected and were analysed by flow cytometry. Two independent experiments were performed. (a) α 4 β 7 and CCR9 expression on CD4+ CD11c Foxp3+ cells are shown. Data are from a representative well of each sample. (b,c) Proportion of α 4 β 7 + cells (b) or CCR9+ cells (c) in CD4+ CD11c Foxp3+ cells were analysed. The plot shows representative data from one experiment (n = 3). Symbols and horizontal bars indicate data from one well and mean of results from three wells, respectively. Statistical analysis was performed by two‐way analysis of variance and subsequent Tukey's honest significant difference test. Values not sharing a common letter are significantly different (P < 0·05). **P < 0·01, ***P < 0·001.
Figure 7
Figure 7
CD11b CD103+ PD‐L1High dendritic cells (DCs) are a migratory DC subset. (a) Relative gene expression of four indicated mesenteric lymph node (MLN) CD11c+ cell subsets were measured by quantitative PCR. cDNA from three independent experiments were analysed together, and relative values to expression in CD11b+ CD103+ PD‐L1High subset of one experiment are plotted. Circles and horizontal bars indicate data from one experiment and mean of data from the three experiments, respectively. (b) Enriched MLN CD11c+ cells were analysed by flow cytometry, and CCR7 (left) histogram and MHC II‐CD11c plots (right) of the four indicated subsets are shown. Data are representative of three independent experiments. (c,e) Four MLN CD11c+ cell subsets from ovalbumin (OVA) ‐fed mice (c) or normal mice (e) were cultured with CFSE‐labelled CD4+ cells from DO11.10 mice (three wells/sample). In addition, OVA protein (100 ng/ml) was added in (e). After 3 days, the cells in the each well were collected, and CD4 and CFSE expression on CD4+ CD11c cells were analysed by flow cytometry. Data are from a representative well of each sample. (d,f) Proportion of proliferated (CFSELow) cells in CD4+ CD11c cells [gates shown in (c) and (e)] were analysed. The plot shows representative data from one experiment (n = 3). Circles and horizontal bars indicate data from one well and mean of results from three wells, respectively. Statistical analysis was performed by Tukey's honest significant difference test. Values not sharing a common letter are significantly different (P < 0·05).

Similar articles

Cited by

References

    1. Steele L, Mayer L, Cecilia Berin M. Mucosal immunology of tolerance and allergy in the gastrointestinal tract. Immunol Res 2012; 54:75–82. - PMC - PubMed
    1. Weiner HL, Wu HY, Quintana F, Wu H. Oral tolerance. Immunol Rev 2011; 241:241–59. - PMC - PubMed
    1. Pabst O, Mowat AM. Oral tolerance to food protein. Mucosal Immunol 2012; 5:232–9. - PMC - PubMed
    1. Faria AMC, Weiner HL. Oral tolerance: therapeutic implications for autoimmune diseases. Clin Dev Immunol 2006; 13:143–57. - PMC - PubMed
    1. Hori S. Lineage stability and phenotypic plasticity of Foxp3+ regulatory T cells. Immunol Rev 2014; 259:159–72. - PubMed

MeSH terms

LinkOut - more resources